Volume 2020,
Article ID 114245,
Journal of Eastern Europe Research in Business and Economics,
18 pages,
DOI: 10.5171/2020.114245
Received date: 21 September 2020; Accepted date: 25 September 2020; Published date: 7 December 2020
Academic Editor: Ionuț Jianu
Cite this Article as:
ZAI Paul Vasile (2020)," Comparative Approach Regarding Good Governance", Journal of Eastern Europe Research in Business and Economics Vol. 2020 (2020), Article ID 114245, DOI: 10.5171/2020.114245
This paper tries to analyze good governance using an Eurostat and World Bank approach. In the first part, a brief history of good governance will be presented along with various definitions of the concept and its key characteristics. Then, in the second part, various indicators of good governance at EU 28 level will be shown, together with their corresponding data for the past 10 years and more, according to different sources such as Eurostat and the World Bank. The author also tried to create a model for participatory budgeting.
JEL Codes: E6
Keywords: Eurostat, World Bank, Indicators, Good Governance.
Introduction
Governance, as the World Bank defines it, refers to the “the manner in which power is exercised in the management of a country’s economic and social resources for development”. This simple and clear definition shows both what governance is – exercise of power towards state level resource management, and what its end goal is, namely the socio-economic development of that state. Furthermore, this definition is useful because it also links the age-old concept of governance with the relatively modern concept of “good governance”, which emerged during the “government crisis” of the late 1980s of several African countries in which the IMF and the World Bank, at the time, were implementing economic aid programs that were severely hindered by administrative corruption and ineffectiveness.
Nanda (2006) stated that good governance emphasizes the means of achieving development, by fighting corruption, nepotism and bureaucracy, and by instituting principles such as transparency and accountability in government institutions. Moreover, due to these governance issues, the two aforementioned international aids started conditioning financial aids based on good governance principles, so as to ensure the efficiency and effectiveness of those aids. This shift of paradigm meant that the quality of the government now became the main factor of the long-term socio-economic development, and so, sustainability became the key for requesting aid.
According to UNDP (1997), the concept of good-governance has been thoroughly debated, and there are dozens of definitions and views upon it depending on the agent (scholar, institution, organization etc.). Hence, it can be seen as a series of positive principles which aims to fight administrative dysfunctionalties, an instrument that eases financial aids as previously mentioned and also as a fundament for consensus and representation in decision-making. In addition, the World Bank gives the most comprehensive definition of the concept, namely that good governance “is epitomized by predictable, open and enlightened policy making (that is, transparent processes), a bureaucracy imbued with professional ethos; an executive arm of government accountable for its actions; and a strong civil society participating in public affairs, and all behaving under the rule of law.”
Thus, linked with the long-term state socio-economical development, good governance is both a means and a goal in itself. It manifests itself on three main levels – political, administrative and social level and, according to some views, incorporates not only public institutions but civil society organizations as well.
The concept of good governance involves and also reinstates that the means of achieving socio-economical development are as important as the goals of doing it. Public administration is no longer an enclosed system which functions independently of its citizens. On the contrary, people’s needs are the focus now. Their freedom must be ensured, as well as their dignity, as according to human rights, and they must have a voice in policy making. Therefore, besides efficiency and effectiveness in public institutions, there is also a need for transparency and accountability in the public office, which must now be open to criticism, praise and amendment, since after all, governments must be “off the people, by the people, for the people” as a fundament for both a well functioning democracy and a good state governance that enables long term social and economical development and sustainability. I chose this topic in order to realize a comparative approach between indicators of good governance from E.U. and indicators from World Bank. Another very important motivation was to derermine the situation regarding good governance in the countries from global level.
Methodology
The data used in this paper is exclusively from the European Commission site: Eurostat which is a free provider of a high quality statistic database (it describes itself as follows: “Eurostat is the statistical office of the European Union. Its task is to provide the European Union with statistics at European level that enable comparisons between countries and regions”), and the World Bank site. Taking into consideration the type of data being used, a quantitative research will be conducted with special regards to budget.
Principles of Good Governance
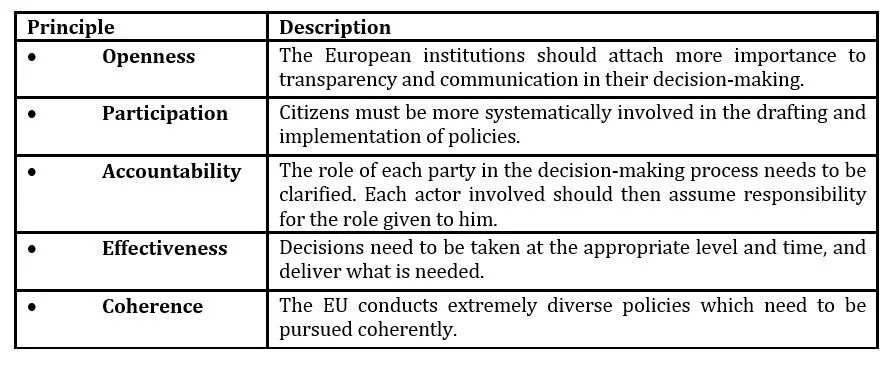
The basis of good governance at the European Union level contains the following five main principles:
Of these five principles, participation, accountability and effectiveness are identical to those from the UNESCAP model. Furthermore, the openness principle from the EU level incorporates the transparency component from the previous model. In addition, the coherence principle frames the overall government activity into that of policy integration that aims to ensure the integrity and well functioning of state institutions which can be linked not only with efficiency and effectiveness but also with vision and long-term sustainability that actually depends on the latter. On a final note, it must be mentioned that all these five principles enclose good governance into the activity of public institutions, and somehow remove the external dimension of government, even though they require openness, transparency and participation.
Good Governance Indicators
Table 1: Good Governance Indicators
Having in mind the Eurostat indicators for good governance, one must notice that they are far from being able to encompass even the main components of the concept which were presented in the previous section.
For example, when measuring participation, in terms of voter-turnout in national elections and European Parliament elections, one can notice a slight decrease of 1.5% from 2000 to 2018, which followed a major decrease since the early 1990s.
At EU27 level, there is a slightly big discrepancy between countries regarding national elections. Countries such as Malta, Luxembourg, Belgium, Denmark, Italy, Cyprus, Sweden and Austria have a turn-out rate higher than 80% (even close to 90% for some of those countries), while most of the other countries range from 60 to 80%, and countries from the Eastern Block such as Romania, Bulgaria, Hungary and Poland have less than 40% turn-out rates.
Croatia, the newest entrance into the EU has a slightly increased voter turnout – 59.6% in 2007 and 54.2% in 2018. Its entrance slightly changes the average with only 0.1% decrease for EU28 as opposed to EU27. Among the causes which decrease voter-turnout, young population absenteeism from elections , population size, electoral closeness and electoral expenditures are of great significance.
Analyzing Main Indicators Eurostat
After gathering the required data for the analysis, the author will try to determine, using the indicators, firstly, which countries from the European Union have the highest level of good governance and what policies did they apply in order to reach that level.
The author will also try to find out new correlations and new theories out of this analysis.
Firstly, the “new infringement cases” indicator will be analyzed. As stated above, this indicator represents new direct actions brought before the Court of Justice, which concern the failure of a Member State to fulfill his obligations. (United Nations, 2007: 25–32; Mayntz, R., 2002: 86–99).
Therefore, the higher the number of new cases of infringement, the worse the level of good governance in that country. The data from Eurostat from year 2012 (the most recent year available) shows the following growth regarding new cases of infringement.
With the exception of Croatia, which has been recently added to the EU, and since there are no recent data to categorize it, the top list of new infringement cases in the member states shows as follows:
The countries with the smallest number of cases are: United Kingdom, Sweden, Finland, Romania, Austria, Malta, Latvia, Estonia, Denmark and Czech Republic. The leading countries with the largest number of cases in 2012 are: Poland, Germany, France, Italy, Spain, Hungary, Bulgaria and Slovenia. The in-between countries which have 1-2 new cases are Belgium, Ireland, Greece, Cyprus, Lithuania, Luxembourg, Netherlands and Slovakia.
In parallel, the average of the new infringement case numbers growth (how much did this number grow in these six years) is analyzed, for the same indicator, from year 2007 until 2018. The list rendered the following order: (ascending, from the smallest numbers to the biggest numbers) Czech Republic, Denmark, Estonia, Latvia, Malta, Austria, Romania, Finland, Sweden, United Kingdom, Lithuania, Luxembourg, Netherlands, Slovakia, Belgium, Ireland, Greece, Cyprus, Bulgaria, Slovenia, Spain, Hungary, France, Italy, Germany and Poland.
It can be seen that almost all five leading countries kept their position: Poland, Germany, France, Spain and Hungary, which shows a constant growth in the last six years. The five countries that show the best numbers, which means less new infringement cases, are: Austria, Malta, Romania, Sweden and Czech Republic.
Between 2007 and 2018, the number of new Single Market related infringement cases fell by 38 %. Most of this decline occurred since 2010. Taxation and environmental issues make up the two largest groups of Single Market related infringement cases by policy sector, representing 44 % of all the pending infringement cases in November 2012.
Moving on to the next indicator, the transposition deficit (which shows the percentage of Single Market directives which have not been notified yet “as national transposition measures” to the Commission in relation to the total number of directives that should have been notified by the deadline) the following can be observed:
After dropping significantly since 2000, the transposition deficit of EU Single Market law reached a new decrease of 0.6 % in November 2018. Promoted by the Internal Market Scoreboard as the ‘best result ever’, the transposition deficit was 0.4 percentage points below the 1 % target for the transposition of Single Market rules.
Again, for the year 2018, the following 13 countries have big percentages (from 2% to 0.6%) of transposition deficit: Belgium, Poland, Austria, United Kingdom, Slovenia, Cyprus, Italy, Finland, Luxembourg, Lithuania, Spain, Germany and Bulgaria. The countries that have a number of deficits under 0.6% (from 0.5% to 0%) are: Hungary, Greece, Romania, Netherlands, Latvia, Denmark, Slovakia, France, Czech Republic, Sweden, Malta, Estonia and Ireland (with 0%).
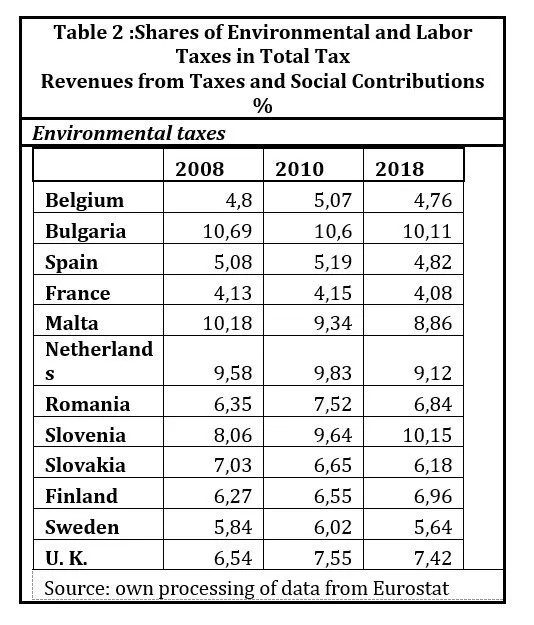
Table 2 :Shares of Environmental and Labor Taxes in Total Tax
Revenues from Taxes and Social Contributions %
It can be observed that for the period 2008-2018, the evolution of this problem regarding deficit renders the following: The top 5 countries with the biggest percentages of deficit are: Poland, Italy, Belgium, Cyprus, Luxembourg and Greece. The top 5 countries with the smallest percentages of deficit are: Malta, Denmark, Latvia, Slovakia, Bulgaria and Romania. (S´everine Menguy, 2008: 1093–1105; Paredesa, J., Pedregalb, D. J. and Pérez, J. J., 2014: 84–97).
Taking only about the second and third part of the next indicator (openness and participation), which are e-government on-line availability and E-government usage by individuals, the following can be observed (data from annex 3*):
The 10 peoples that have used the internet mostly for interaction with public authorities, for a 3 year period 2008 -2010 (most recent data) are: (starting with best score) Denmark, Sweden, Netherlands, Finland, Luxembourg, Estonia, United Kingdom, Slovenia, Austria and Germania. The last 6 countries on the list are: Poland, Italy, Czech Republic, Bulgaria, Greece and Romania. Yes, Romania is the last on the list, which means that Romanians hardly go online to search for public information.
Citizens’ online interaction with public authorities in the EU rose by 8 percentage points between 2008 and 2018. After a slight decrease in 2011, internet interactions with public authorities have increased again, reaching 44 % in 2018. This trend partly reflects an overall increase in the internet usage across the EU.
Moving on to the environmental taxes, which represent tax revenues, they stem from four types of taxes: energy taxes (which contribute with around three-quarters of the total), transport taxes (about one fifth of the total), and pollution and resource taxes (about 4 %). ( Mutiganda J. C., 2013: 518–531; Aronson, R. and Schwsrtz, E., 1996: 114–136).
The author of this paper extracted the data from Eurostat for a period of 3 years regarding this indicator, measuring the level of the revenues that comes from this type of environmental taxes. He chose a period no longer than 3 years because after verifying other options, he noticed that the data was constant.
The top ten countries that have the lowest level of environmental taxes (under 7%) are: France, Belgium, Spain, Germany, Sweden, Austria, Lithuania, Luxembourg, Slovakia and Hungary. The countries that have the highest level of taxes (over 8%) are: Slovenia, Bulgaria, Netherlands, Malta, Croatia, Ireland, Latvia, Estonia, Greece and Denmark.
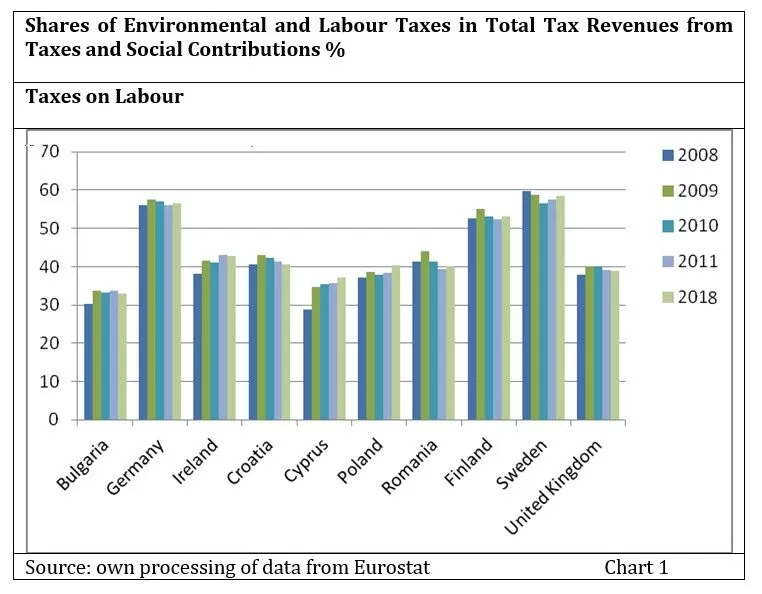
This indicator “Economic instruments” has two layers. It considers the shares of environmental and labour taxes in total tax revenues from taxes and social contributions. One layer is environmental taxes, which has just been analysed and the second is labour taxes.
Taxes on labour are defined as all personal income taxes, payroll taxes and social contributions of employees and employers that are levied on labour income (both employed and non-employed). On average, about 65 % of labour taxes consist of social contributions
The next graph will helps see the existent labour taxes level measured in percentage in each country of the EU.
It can also be seen that Bulgaria, Malta, Cyprus, United Kingdom, Romania, Poland, Croatia, Greece and Ireland have a level under 45 %.
The share of labour taxes in total revenues from taxes and social contributions showed a fluctuating but an overall increasing trend between 2000 and 2011, reaching almost 55 % in 2011. This is compared with an overall decline in the share of environmental taxes over the same period, reaching 6.17 % in 2011. This trend counters the Europe 2020 strategy’s argument that ‘raising taxes on labour, as occurred in the past, at great costs to jobs, should be avoided’. Nevertheless, there are large differences in the share of labour taxation among the Member States, ranging from 33.4 % to 58.1 %.
With regards to the environmental taxes, only two Member States (Bulgaria and the Netherlands) showed a share above 10 % of the environmental taxes in total revenues from taxes and social contributions in 2011, and two others (Malta, Slovenia) had a share above 9 %. In the remaining Member States, the share of the environmental taxes ranged from 4.15 to 8.94 %.
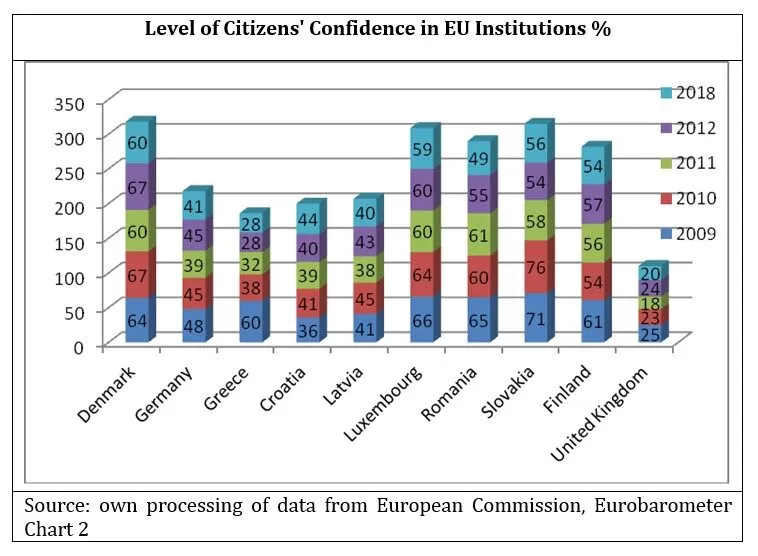
Next on the list is the level of citizens’ confidence in EU institutions. This indicator is expressed as the share of positive opinions (people who declare that they tend to trust) about the institutions.
On average, in the period 2011-2018, people in Denmark, Luxembourg, Belgium, Hungary, Estonia, Sweden, Slovakia, Bulgaria, Finland and Malta trust the EU institutions the most, while people from countries like UK, Spain, Greece, Cyprus, Italy, Slovenia, France, Latvia, Germany and Ireland have low trust level in the EU institutions.
Less than half of the EU citizens have trust in the three main EU institutions. In 2012, the European Parliament was the most trusted among them (44 % of the citizens say they trust it), followed by the European Commission (40 %) and the Council of the EU (36 %). Citizens’ trust in political institutions on all political levels is generally low, especially regarding the political parties and institutions at the national level. In order to create a good governance level in the EU, several lists of scores obtained by these countries were created for each indicator. The countries that constantly got good scores in every list are: 1. Estonia, 2. Malta, 3. Denmark, 4. Sweden, 5. Bulgaria. (6. Netherlands, 7. Latvia, 8. Finland, 9. Ireland, and 10. Luxembourg).
Analyzing Main Indicators Worldbank
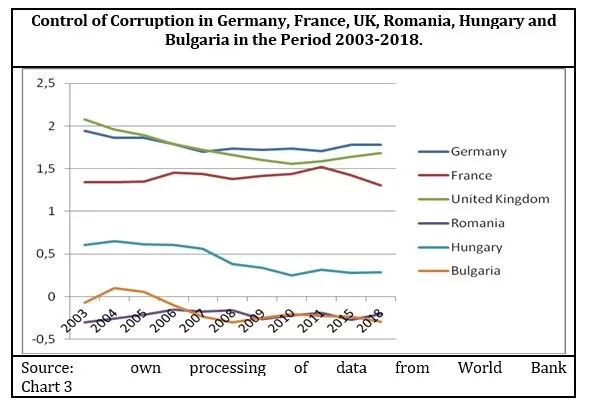
Control of Corruption
The first two states with the best results in corruption control are Germany and UK, but both of their values were steadily declined in the 2003-2009 period, and only after the 2008, the crisis started to rise again. Furthermore, this gradual decline in corruption control is present in all the six countries, and the most visible one belongs to Bulgaria, which started from 2005 and continued through 2008 and 2009.
However, in most of the countries, the emergence of the crisis triggered slight increases in corruption control, when severe state interventions were actually required, and needed as much control as possible over corruption cases, which led to inefficiencies and waste of precious financial resources due to private interest use of the public money. Unfortunately, Romania and Bulgaria present negative values in corruption control. While in Bulgaria, there was that serious downfall, in Romania, there were slight increases over the years that were weakly affected by the financial crisis.
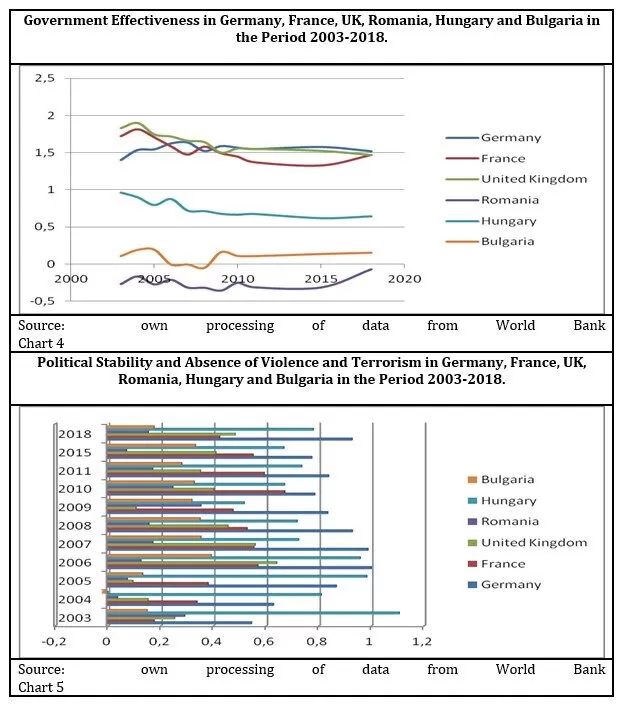
There was also a downfall in government effectiveness related to service provision, proper policy making, state commitment and credibility in the case of Germany, France and UK which reached similar values for all the three Western states in 2018. The other three countries are more dispersed, with Hungary following the Western trend for the decline in government effectiveness, then by Bulgaria which again had a series of increases and decreases during the analysis period, and of course Romania, which although it had less abrupt shifts, still maintained negative values related to government effectiveness up until 2018, and it appears in that it will reach a positive value in the forthcoming years.
There is a severe downfall and subsequent uprisings in the political stability visible for all the analyzed 6 countries after the 2008 financial crisis, which can be explained by the increased level of social unrest due to diminishing incomes, high unemployment rates and severe austerity measures. One cannot but notice the heavy downfall of stability that happened in the UK in 2009, when it was lower than that of both Romania and Bulgaria, but which then started to increase after 2010, surpassing again the two countries. Hungary was one of the most stable countries at the beginning of the analysis period in 2003, but up until 2018, it drastically shifted a couple of times and fell behind Germany, which has the highest values from all the 6 countries and which experienced a major increase in the political stability from 2004 to 2005.
As for France, the country had two major uprisings and downfalls in the decade, ending up with a slightly lower value in 2013 compared to the UK. When it comes to legislation quality, according to the chart, the United Kingdom leads, followed by Germany, then France, then Hungary, and in the last two places, Romania and Bulgaria. For most of the countries, the shifts are not abrupt, except in the case of Romania where there is rather a significant increase from 2003 to 2006, in the period before entering the EU that continued with slightly lower increase values up until 2018. Last but not least, it is interesting to see that the countries are paired-two by having similar evolutions throughout the years.
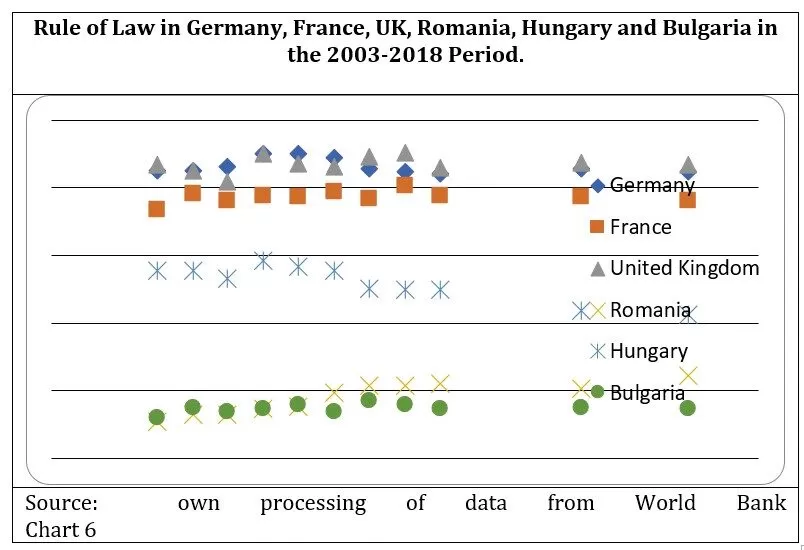
As it was with the regulatory quality, the United Kingdom again leads in the Rule of Law dimension. Its course throughout the decade runs very close to and in parallel with Germany. France is again next, with a couple of shifts that somehow translate into a stagnation on this dimension since the values in 2018 are similar to those from 2003 despite those subtle increase-decrease turns. Bulgaria and Romania have an overlapping evolution which ends in 2007, the year in which they both entered the EU, when Romania had a slight increase in values up until 2018 while Bulgaria continued steadily, thus ending up being surpassed by Romania.
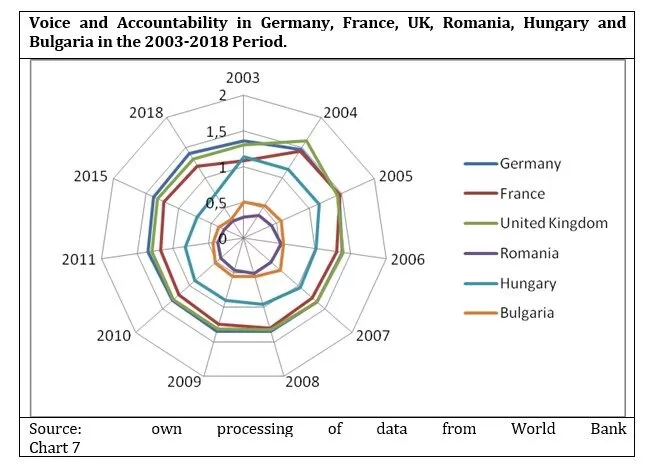
For Germany, France and the UK, regarding voice and accountability in the country, a small peak can be noticed for all the three in 2004, followed by a steady evolution in which Germany emerged as the leader, followed closely by the UK, and then by France. In the case of Hungary, a steady decline can be observed on the chart. Whereas Romania and Bulgaria again had an almost parallel course of a slight decline after their 2007 EU integration.
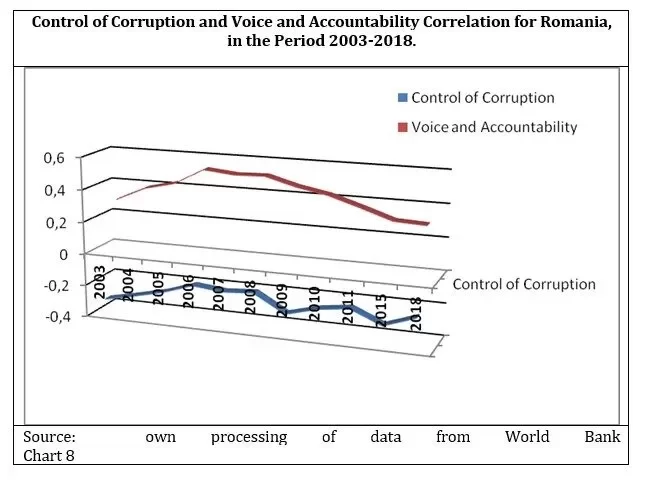
World Bank – Governance Indicators Correlation
One can see that for the most part, there is a direct correlation between corruption control and voice and accountability in Romania for the respective time period.
From 2003 to 2006, in the case of both indicators, a slight increase is visible which can be explained by mentioning that during that respective period, Romania was able to absorb pre-accession funds from the EU. Therefore, the corruption control inside the public institutions was increased, as a condition for administrative capacity, and concurrently public institutions in the country also became more open and representative to ensure better resource management and policy formulation and implementation. Then, after Romania’s entry in the EU in 2007, the two indicators had a similar evolution – a slight decrease, followed by a slight increase, as more development funds were available to the country to access, both for public institutions and civil society organizations. Then, after the 2008 crisis, the indicators passed through a downfall, one more severe in the case of corruption control, than in the case of accountability and public voice, perhaps because the economical uncertainty triggered an increase in acts of corruption. After the crisis, the indicators took a different direction, so while the voice & accountability remained constant, at a significant level lower than before the crisis, the control of corruption shifted rather drastically, increasing after the crisis, then decreasing after 2011, followed immediately by another increase. This period was considered as one of many political scandals in the country as multiple cases of broad-scale corruption were uncovered, many political and public charts were caught in corruption scandals and some of them were even sent to prison. Of course, the parliament and the presidential elections in that period also contributed to these shifts as a consequence of the many power shifts caused by them.
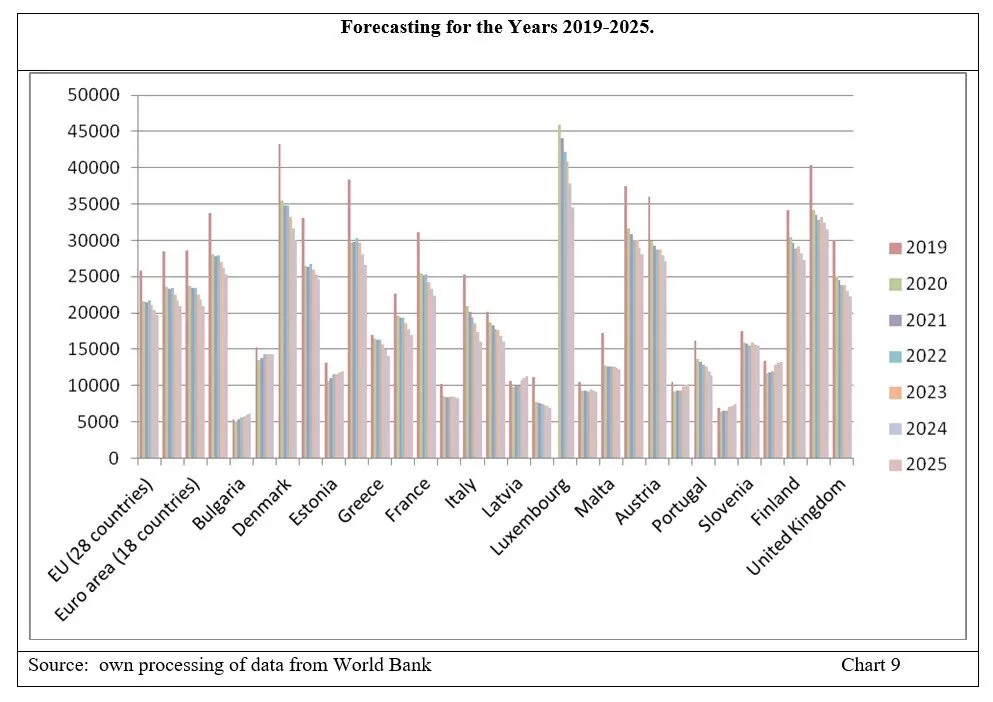
Forecasting for the years 2019-2025
The data for the years 2015-2020 was extracted using the FORECAST function of MICROSOFT OFFICE EXCEL based on previous data beginning with the year 2003.
Biggest amounts are in Nordic countries and in developed countries.
Conclusions
Good governance is an absolute must in all countries because without proper resource management at state level, proper openness and participation, control of corruption, accountability, trust in public institutions, and sound legal frameworks, corruption, waste and loss of legitimacy become prevalent. Of course, other principles must be included so as to ensure good governance, such as transparency, efficiency and equity so that state institutions provide the best goods and services to citizens and make the most satisfying decision for all of them. Then, the measurement of good governance, by Eurostat and the World Bank, focuses on internal processes, how institutions should function and what principles to implement, like for example those mentioned above, but the author of this paper suggests a new series of indicators which focuses on the results or outcomes of state institutions, namely the real GDP/capita which measures the economical performance in terms of welfare and population income increase, and also proper resource allocation in social fields so as to diminish the rate of poverty risk for citizens, in environmental policies in order to reduce pollution and ensure long term socio-economical development and sustainability, and also in innovation, research and development in order to access more and more useful technologies which increase goods and service production and provision. As for concrete results, almost in all governance indicators from the World Bank, those mentioned before and also in terms of the economical performance, there is a high discrepancy between the Western States and the Eastern States, with better performances present in the Western States such as UK, Germany, France, Netherlands and Luxembourg, in contrast with the Eastern States such as Romania, Bulgaria and Hungary.
In order to achieve the principles of transparency, collaboration and involvement of citizens, a research instrument was created according to social sciences, by which the opinions of citizens will be collected, centralized and studied. This semi-structured guide interview allows respondents to identify by themselves as many local problems as possible and then evaluate them by the indicators of costs, emergency, period of time and number of people affected. The idea behind this method is that it will help in studying the differences between the evaluation of citizens and that of an expert, differences which consist in a helpful instrument for studying the degree of public awareness on local problems.
The author of this paper hopes that the instrument will be successfully applied through the local authorities’ collaboration and citizens’ implication. That will be a real achievement for his academic background and a strong sign for participatory democracy in allocating public funds for local problems.
End-Notes
1World Bank, “Managing Development – The Governance Dimension”, 1991, Washington D. C., available [Online] at http://wwwwds.worldbank.org/external/default/WDSContentServer/WDSP/IB/2006/03/07/000090341_20060307104630/Rendered/PDF/34899.pdf
2 World Bank, “Sub-Saharan Africa: From Crisis to Sustainable Development”, 1989,Washington, D. C., World Bank, [Online] disponibil la adresa http://wwwwds.worldbank.org/external/default/WDSContentServer/WDSP/IB/1999/12/02/000178830_98101901364149/Rendered/PDF/multi0page.pdf
3 See Nanda V P, “The ‘Good Governance’ Concept Revisited”, 2006, 603: 269, available [Online] at http://ann.sagepub.com/content/603/1/269
4 Idem.
5 Santiso, C., “Good Governance and Aid Effectiveness: The World Bank and Conditionality”, 2001, The Georgetown Public Policy Review Volume 7 Number 1 Fall 2001, available [Online] at http://www.sti.ch/fileadmin/user_upload/Pdfs/swap/swap108.pdf
7 See Srivastava, M., “Good Governance – Concept, Meaning and Features: A Detailed Study”, 2009, available [Online] at http://dx.doi.org/10.2139/ssrn.1528449
[1] See Mkandawire Thandike: “Good governance: the itinerary of an idea”, 2007,
Development in Practice, 17:4-5, 679-681, [Online] disponibil la adresa
http://dx.doi.org/10.1080/09614520701469997
8 As mentioned in UNDP, “Governance for Sustainable Human Development”, New York: UNDP, 1997, available [Online] at
Mayntz R., (2002) „Common Goods Reinventing European and International Governance: Common Goods and Governance”, INC, Lanham, Boulder, New York, Oxford, Rowman&Littlefield Publishers, , New York, Oxford;
Mkandawire Thandike: „Good governance: the itinerary of an idea‟, 2007, Development in Practice, 17:4-5, 679-681, [Online] disponibil la adresa
Nanda V. „The ”Good Governance” Concept Revisited‟, 2006, 603: 269, available [Online] at http://ann.sagepub.com/content/603/1/269
Rosen H. (2002) , Public Finance, McGraw Hill, , New York;
Rubin I. (2014), „The Politics of Public Budgeting, Copress”, Los Angeles, London, Singapore;
World Bank, „Governance: The World Bank‟s Experience‟., 1994, p. vii,available [Online] at http://books.google.ro/books/about/Governance.html?id=lylQWqEdtrkC&redir_esc=
World Bank, „Managing Development – The Governance Dimension‟, 1991, Washington D.C., available [Online] athttp://wwwwds.worldbank.org/external/default/WDSContentServer/WDSP/IB/2006/03/07/00009034
Mutiganda J. C. (2013), “Budgetary governance and accountability in public sector organisations: An institutional and critical realism approach”, Critical Perspectives on Accounting 24, 518–531;
OECD,Poland (2013), Developing Good Governance Indicators for Programmes Funded by the European Union, OECD Public Governance Reviews, OECD Publishing, Paris.
DOI: http://dx.doi.org/10.1787/9789264193543-en;
Paredesa, J., Pedregalb D. J. and Pérez J. J. (2014), „Fiscal policy analysis in the euro area: Expanding thetoolkit”, Journal of Policy Modeling, sciencedirect.com. ;
S´everine Menguy (2008), „A dynamic rule applied to the threshold imposed on the European budgetary deficits”, Journal of Policy Modeling 30, 1093–1105;
Thomas M.A. (2010), „What Do the Worldwide Governance Indicators Measure?”, European Journal of Development Research, 22, 31–54;