Andreea DUMITRACHE, Alexandra A. M. NASTU and Stelian STANCU
Bucharest University of Economic Studies, Bucharest, Romania
Volume 2020,
Article ID 241442,
Journal of Eastern Europe Research in Business and Economics,
11 pages,
DOI: 10.5171/2020.241442
Received date: 30 August 2019; Accepted date: 22 November 2019; Published date: 21 February 2020
Academic Editor: Katarina Tomičić-Pupek
Cite this Article as:
Andreea DUMITRACHE, Alexandra A. M. NASTU and Stelian STANCU (2020)," Churn Prediction in Telecommunication Industry: Model Interpretability", Journal of Eastern Europe Research in Business and Economics Vol. 2020 (2020), Article ID 241442, DOI: 10.5171/2020.241442
The large number of studies published in the last ten years on the problem of customers migrating from one telecommunications service provider to another competing provider proves that this problem has become a major concern for this industry and beyond. The purpose of this paper is to detect which variables from the multitude presented in the data set for postpaid clients, represents an important driver in the problem of migrating customers to another Romanian mobile telecommunications company. To enable us to understand and solve the problem of churn in telecommunications, we need tools that can interpret the results. Thus, we use a Balanced Random Forest for the churn model and three feature selection tools: Permutation Importance, Partial Dependence Plot and SHAP. Applying them to the churn model, we classify the predictive indicators according to their importance, their predictive power and the distribution of the impact that each characteristic has in the model. According to the Permutation Importance, the drivers regarding churn issue are: the number of months since the last offer was changed from the account, the number of minutes consumed outside the company, the value of the invoice, the age of the customer and his time at this telecommunications operator. Partially Dependence Plot determinates the churn risk areas faced by the Romanian telecommunications company for each of the indicators listed, such as: clients with younger ages or with outdated offers (unchanged for almost two years). SHAP also shows that many months since the last offer, a significant percentage of minutes received from competing networks or a small age in the network, increases the estimated churn per customer.
Keywords: churn, feature importance, model agnostic features, churn risk area
Introduction
According to the portability balance provided by ANCOM (May 2019), the churn phenomenon has grown to a large extent in the Romanian telecommunications sector. The National Authority for Administration and Regulation in Communications (ANCOM) states that over a decade since the launch of the portability service, over five million phone numbers have been ported, over four million of them being mobile numbers and over seven hundred thousand of them being landline numbers. The portability service allows consumers to keep their phone number when changing service providers, thus increasing the freedom to migrate from one provider to another and giving them the opportunity to enjoy the benefits of a competitive market. Since October 21, 2008, when this service was launched on the market, and up to mid-October 2018, a total of over 5.1 million numbers were ported, of which 4.4 million are mobile phone numbers. The telecommunications sector is one of the sectors that supports in influencing the Romanian economy: together with the IT industry, in 2017, it reached 6.2% of Romania’s GDP.
The number of studies published in recent years regarding the interpretability of the prediction model of the churn phenomenon in telecommunications proves that this problem has become a major concern. So far, the Romanian data sets on this topic have not been the subject of published studies.
Given the real maturity of the telecommunications market, it has become increasingly profitable for companies in this area, to invest significantly in their customer relationship than to invest in acquiring new customers. In order to successfully retain customers, it is essential to identify which are the main engines related to the potential risk of churn, i.e. the proportion of subscribers leaving the current provider in a certain period of time, identifying the main indicators that determine a migratory behavior, the decision makers regarding the action of churn and what measures can be taken to avoid the situation where customers leave the company for similar services provided by the competition.
The purpose of this paper is to identify the causal factors in the churn action from the telecommunications industry. We want to achieve this through graphical methods that are easy to view and interpret. We will use a prediction technique called Balanced Random Forest and three methods of agnostic explanation. The first one, Permutation Importance, classifies variables according to their predictive power, thus, it generates the most important characteristics. The second mechanism applied – Partial Dependence Plot, can be seen as a directional tool that explains the evolution and meaning of the features in the predictive model. It has the property of an antenna, being more sensitive in one direction than in another. It indicates the directionality of the characteristic values in the churn model at the level of each indicator. The last method, SHAP, is part of the group of explanatory techniques. This is a technique derived from game theory, which is based on Shapley values. It shows how big the contribution for each player is in the predictive model. We apply this concept to identify the contribution of each feature in the problem of churn phenomenon.
In this study, we propose to find out about the technologies that allow analytical work. We will go through a landscape of modern tool classes and learn how these tools support common analytical tasks in combating the churn phenomenon by determining drivers – the most important indicators in this process. We will study three types of instruments of the same typology that determinate the most important drivers in the prediction model of the churn. Then, we will focus on the behavior of churn customers in telecommunications.
In this paper, we want to provide a solid basis in how the interpretation of the results of the prediction model really works, the focus being on the predictive indicators. Regarding the forecasting activity, from a subjective point of view, the most important thing is a correct and affordable interpretation, and for this, we need tools that rise to the level of expectations. We could compare this process, of analysis and interpretation, with one sport: surfing. To practice it, you must know what wave is to come and interpret it correctly. You need to know how it might behave and what rules to follow to navigate with others. You also must have the right tools for the right wave. So, we want to test whether these three interpreting tools are suitable for the wave called churn prediction in the telecommunications sector. Data analysis and interpretation is a process that creates clarity in chaos. To enable us to understand and solve real-world problems using advanced data and predictive methods, we need the most capable tools. These are among the most important elements that support the analytical environment.
Literature Review
The telecommunications industry is facing fierce competition to keep customers and, therefore, requires an efficient churn prediction model. In the specialty literature, Adnam Idris (2012) studies the churn prediction in the field of telecommunications using Random Forest and the nearest neighbor’s method (KNN). In his work, these two techniques are applied on a high dimensional data set, in which the minority class has fewer instances compared to the majority class, so poor learning leads to unsatisfactory results. Random Forest needs a level of training to produce desirable performance. This paper addresses the imbalance between classes by applying the Balanced Random Forest (BRF) because this technique underestimates the majority class so that it is a cardinal fit with the minority one (Robert O’Brian, Hemant Ishwaran, 2019).
A study that seeks to correct the imbalance is that of Chao Chen (2004). It demonstrates that imbalanced data is corrected by Random Forest techniques, such as Weighted Random Forest (WRF) and Balanced Random Forest (BRF). WRF gives higher weight to the minority class, sharply sanctioning the wrong classification of the minority class. BRF combines the technique of down sampling majority class and the idea of learning together, artificially altering the distribution of the class so that the classes are represented equally by each tree. The article further demonstrates that BRF and WRF perform better than the SHRINK, 1-NN and C4.5 techniques. However, there is no clear winner between BRF and WRF. By building BRF and WRF, the first one is computationally more efficient on a large and unbalanced dataset because each tree uses only a small portion of the training set, while WRF must use the entire training set. Also, because WRF assigns a weight to the minority class, it is possible to label to classes more wrongly than the BRF. A majority case that is wrongly labeled as belonging to the minority class could have a greater effect on the accuracy of the majority class prediction in the WRF than in the BRF.
Understanding why a model makes a certain prediction can be just as crucial as the accuracy of forecasting in many applications. Complex nonparametric models – such as neural networks, Random Forest and the car support vector – are more common than ever in predictive applications, especially when dealing with large databases that do not meet the strict assumptions imposed by traditional statistical techniques. Unfortunately, understanding the results of such models can be difficult for management. The partial dependency graph offers a simple solution. Partial dependency graphs are rendering the graphical dimension of the prediction function, so that the relationship between the outcome and the predictors of interest can be easier to understand. These graphs are especially useful in explaining black box outputs (Brandon M. Greenwell, 2017). The partial dependency graph (short graph or PDP) shows the marginal effect that one or two characteristics have on the expected outcome of a machine learning model (J. H. Friedman, 2001). A partial dependency diagram can show whether the relationship between a target and a feature is linear, monotone or more complex.
In this paper, in order to detect the indicators that are most important in the churn model, we propose the use of three tools: Permutation Importance (PI), Partial Plot Dependency (PDP) and SHAP. In the specialty literature, the first technique is used by Andre Altmann et al. (2010) to select important variables from a specific data set in the medical field (HIV detection). The technique involves the normalization of the bias measure by a permutation test and returns p-values for each characteristic. As for technique SHAP (SHPley Additive exPlanations), it helps break down a prediction to show the impact of each feature. It is based on Shapley values, a technique used in collaborative games from game theory in order to determine how much each player has contributed to the success of the game. Normally, the balancing between the precision of the results and the interpretation is a difficult act, but SHAP values can provide both. SHAP assigns each feature an important value for a prediction. Its new elements include: identifying a new class of measures of importance of the additive characteristics and the theoretical results that show the existence in this class of a unique solution with a set of desirable properties (Scott M. Lundberg, 2017).
The importance based on the permutation (PI) represents a good balance of calculation and performance for any model, Fisher A. et al. (2018). Its applicability is precisely the reason for the recommendation of academicians, Baptiste G. et al. (2016). Permutation Importance shows the performance of the model with and without variables, altering in turn all indicators, Gregorutti B. et al. (2017). PI are current methods that play with model agnostic features, Casalicchio G., Molnar C. and Bischl B. (2019).
Methodology
We apply Balanced Random Forest on a sample of 10,701 customers of a large telecommunications operator in Romania. The target indicator, found in the specialty literature under the name of variable Churn, is populated with the value 1 if the client has made churn, and 0 otherwise. The predictive model is applied on a snapshot of March 2018. The balance of the active or migrated clients was realized at the time of the cohort (after 3 months).
In the collected data set, we group the variables according to the information they bring in 4 categories: demographic data: such as age, gender of the client; data on the life cycle in the company: the client’s age, the number of months since the last offer change in the account or the contract change; information about the financial power of each client: the value of the invoice, the additional cost paid etc.; and data regarding the interaction of the subscribers with the customers of the competing networks: the number of minutes that it uses to call in another network and the number of minutes received from another network.
The first step in our analysis and research process is to apply the Balanced Random Forest prediction technique to the dataset. The database will be divided as follows: 75% train and 25% validation. On the train set, we will apply the three tools to detect the indicators that are most important in the churn model – Permutation Importance (PI), which are the influencing factors in the model and to what extent they affect the behavior of churn or non-churn – Partial Plot Dependency (PDP). With this technique, we also want to detect which is the safety zone, in our case, high probability of remaining non-churn and which is the risk zone, the probability of becoming churn depending on the values of the analyzed indicators. Thus, we can set a risk threshold for each factor in the model. We will generate PDP type charts only for the most important features of the churn model – top 5 important indicators determined by PI. Then, based on the trained dataset, we will apply SHAP to solve the same problem: determining the most important causal factors in the churn problem. Besides finding out, we also want to see the impact of the indicators in the prediction model of churn behavior as there may be indicators that do not add value in the model or that even harm the prediction.
All three tools generate an output with an easy interpretation for business people in marketing or management and an easy identification of significant variables in managerial decision making.
Results
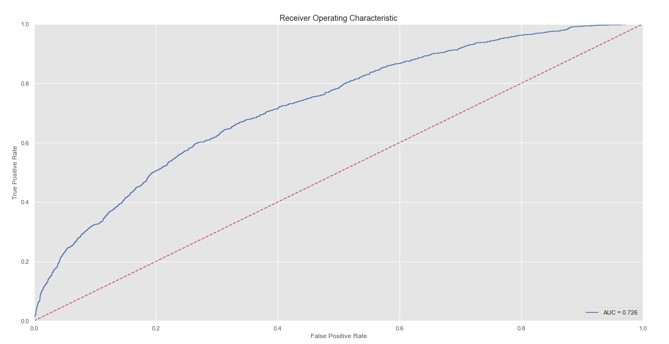
We measure the accuracy of the churn model generated by the Balanced Random Forest using the ROC curve and the AUC coefficient (Fig. 1). The main purpose of the paper is given by the performance, applicability and interpretation of the three tools in the feature selection category. So, a not very high value of the coefficient that measures the performance of the area under the curve does not affect us.
Fig. 1: ROC Curve
Source: Authors’ own research
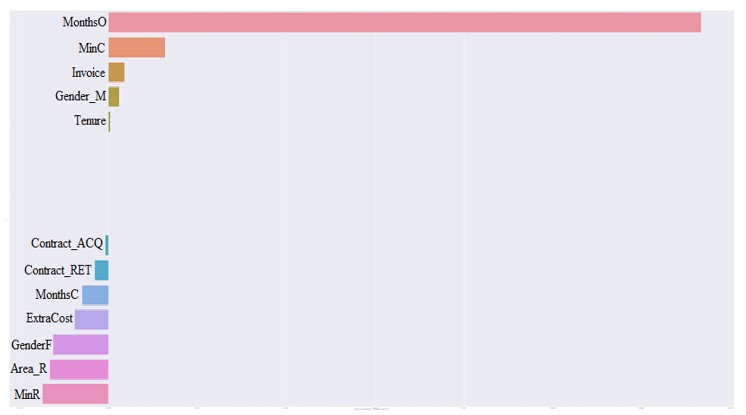
From all the 16 indicators included in the model, Permutation Importance (PI) selects only 5 that are the most important in the churn problem: MonthsO, MinC, Invoice, Age and Tenure. The rest can be considered important or even harmful to the prediction – those indicators that are centered on the left side of the axis (Fig. 2).
Fig. 2: Heatmap of Churn Prediction Drivers
Source: Author’s own research
Therefore, according to PI, the most important factors and variables that bring the greatest informational power in the churn model are: the frequency of changing the last customer offer (measured in number of months), the amount of minutes consumed outside the company, the value of the invoice, the age of the customer and his period at this telecommunications operator. Thus, the main causal factors in the problem of churn in the telecommunications sector detected by the Permutation Importance are related to the novelty of the offers communicated and implemented to the customers. They need new offers and services competitive with the market, but at an accessible price. Another factor is the comfort over competing networks, namely, a subscription with as many minutes as possible, so that the customer is not conditioned and does not feel the difference when communicating with a client interlocutor of a competing company. The variables: age of the client and his period in the company are difficult to be modeled in churn action, but they can be stimulated through various marketing campaigns.
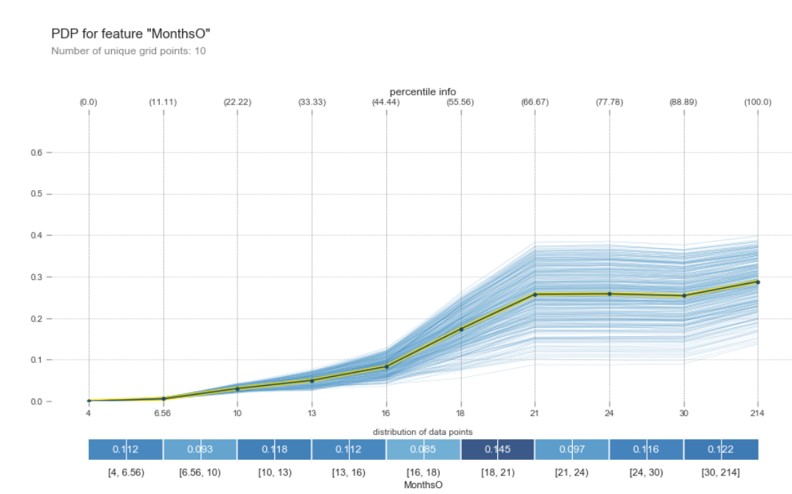
Applying PDP charts on the most important indicators detected above, we note that MonthsO, the number of months since the last offer change on the client’s account, can lead to 30% variations (maximum threshold 0.3). The risk zone starts from plus 16 months. If the customer has not changed the offer on account for more than 16 months, there is a probability of about 10% for the individual to churn. The trend in the churn action is an ascending one, starting from this value and up to 21 (months), where we have a probability of churn over 25%, increasing later to 30%, when the threshold reaches the value of 214 months. We consider this threshold to be a high risk in terms of conversion to churn. As a safe area, we consider the range of 4 to 10 months, where the probability of churning is below 2% (Fig. 3).
Fig. 3: PDP of MonthsO
Source: Author’s own research
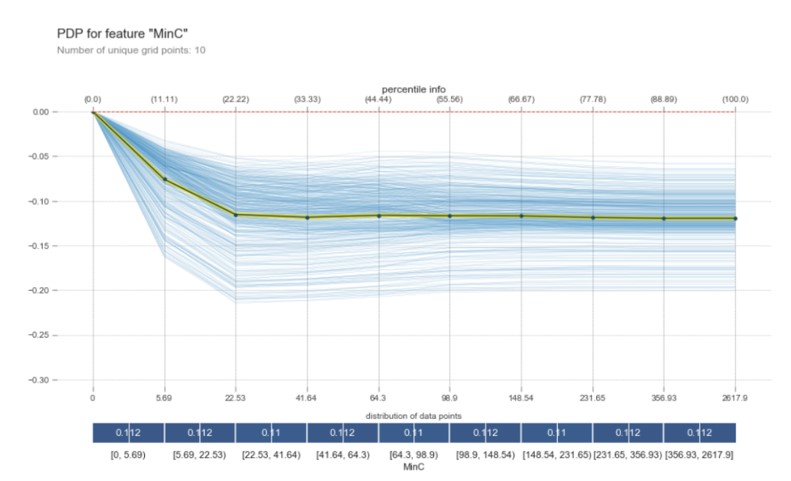
The number of minutes consumed in other networks has a variation of 12%. The higher the MinC, the less likely it is to make churn. It has 2 sharp drop thresholds: one at 5.69 minutes, with a probability between 5 and 10% and another one at 22.53 minutes consumed with a probability of churn of about 13%. They are followed by a very small, constant decrease. So, the minimum churn risk threshold can be considered as less than 11 minutes consumed, and the maximum of more than 22. The values in the PDP graphs are delta probability, as the number of minutes consumed outside the network is higher, with this decreases the probability of churning in the future (Fig. 4).
Fig. 4: PDP of MinC
Source: Author’s own research
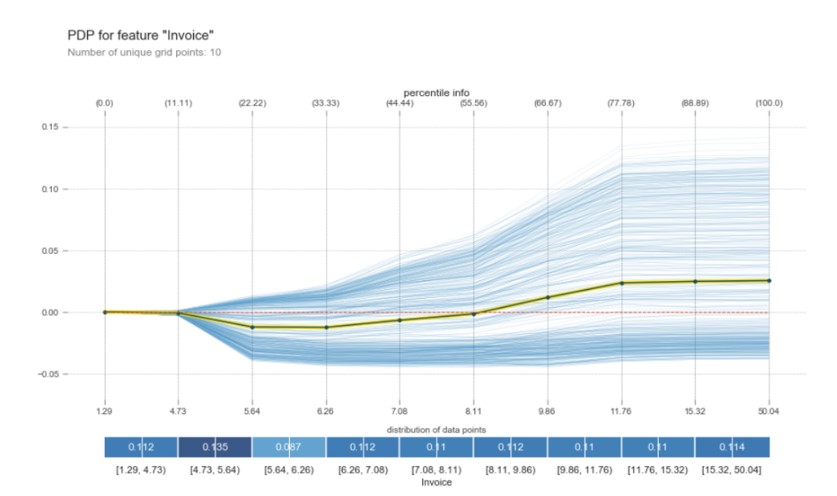
The value of the invoice shows somewhat small variations, which means that it can be considered a not very relevant factor in the churn model. The switch from churning or not, turns around the bill of 8.11 euros. If the value of the invoice exceeds this threshold, the probability that the individual will make churn in the future increases by a maximum of 2.5% (Fig. 5).
Fig. 5: PDP of Invoice
Source: Author’s own research
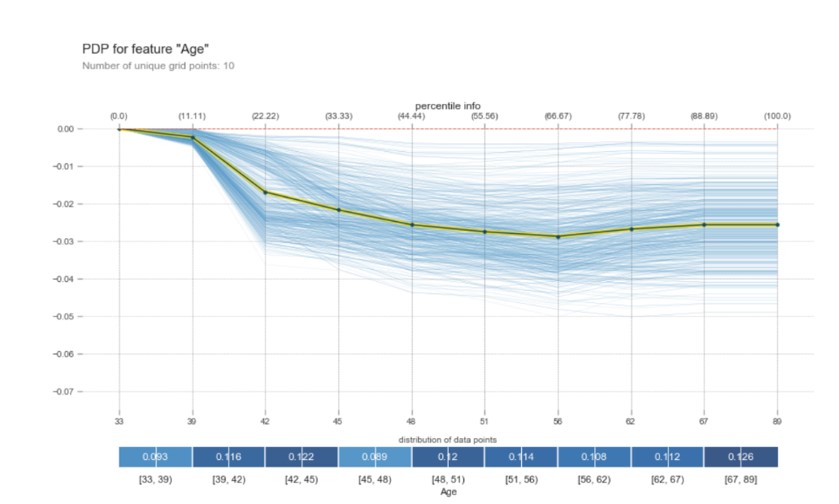
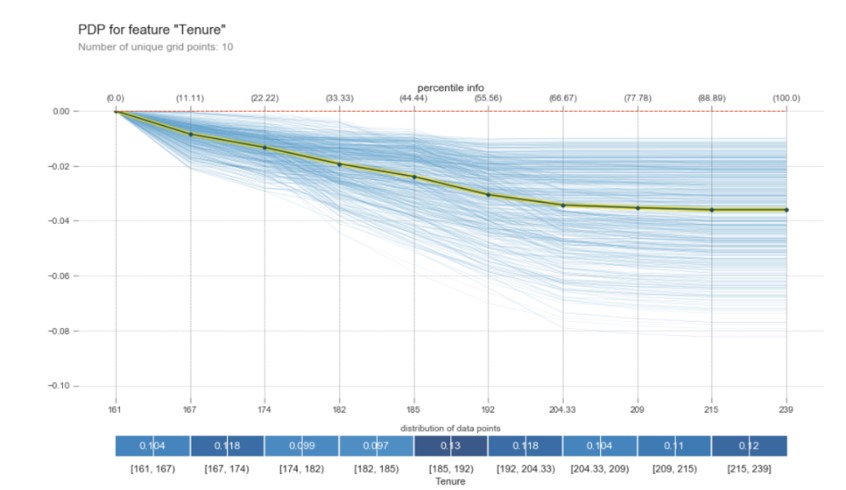
Regarding the indicators that contain information about the period and seniority in the company, we observe that, as the age of the clients is higher (older clients), the probability of making churn decreases (Fig. 6). The same thing happens in the case of clients with a company age of 185 to 204 months. Over 204 months, there is a constant decrease, the probability of churn decreases by 3.5%. The significant variation is between 161 and 204 months (Fig. 7).
Fig. 6: PDP of Age
Source: Author’s own research
Fig. 7: PDP of Tenure
Source: Author’s own research
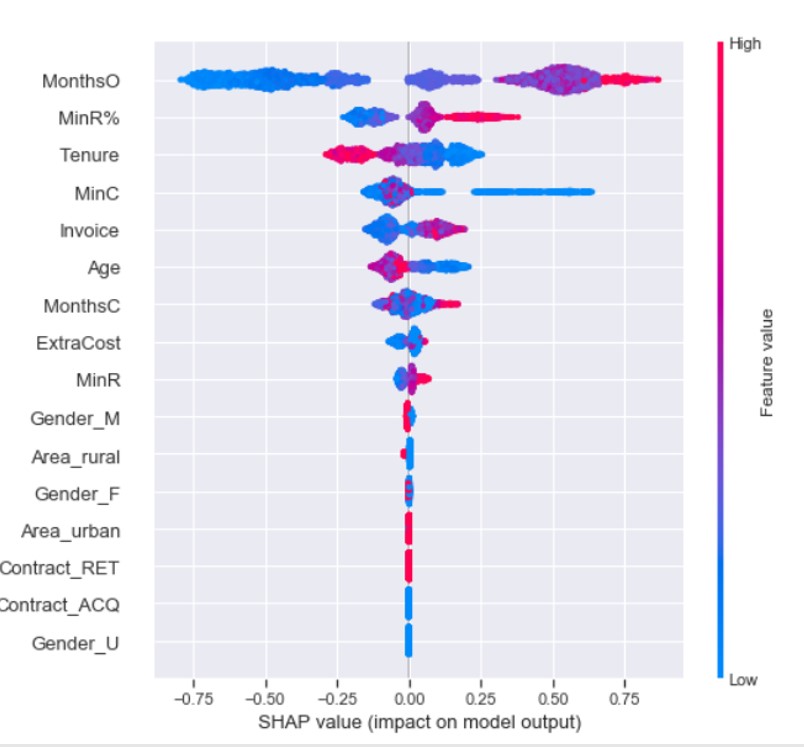
To get an overview of the characteristics of the churn model, we compile the SHAP values of each indicator for each sample. We use SHAP values to show the distribution of the impact that each characteristic has, the impact it has on the variables after applying the prediction model. The colors represent the characteristic value: red shows a high impact, and blue shows a low impact. We observe, for example, that many months since the last offer (MonthsO), a significant percentage of minutes received from competing networks (MinR%) or a small period in the network increases the estimated churn per customer, whereas the type of contract: acquisition (Contract_ACQ) or retention (Contract_RET) – which shows the type of customer subscription, has no importance in the churn model (Fig. 8).
Fig. 8: SHAP in churn pattern
Source: Author’s own research
Conclusions
Data analysis and interpretation is a process that creates clarity in chaos. To enable us to understand and solve the problem of churn in telecommunications using data and advanced methods of prediction, we need tools that can interpret the results. These are among the most important elements that support the analytical environment. In the telecom field we are dealing with a lot of data and information, which is why we need a classification of all the indicators according to their importance so that the people in management or marketing know on which channel or driver to focus when they hit a problem, such as churn.
The three tools used in the churn model: Permutation Importance, PDP and SHAP show that the most important decision-making factor is the number of months since the last offer change in the account. Moreover, we could also set the churn risk thresholds of the company, according to the values of this key indicator. The risk area starts from one year and four months after the last offer is activated on the client’s account. Other important factors such as the number of minutes consumed or received outside the network, the value of the invoice, the age and the time in the network are indicators from the database that must be monitored and evaluated periodically in order to prevent and stop the churn action in telecommunications. The risk thresholds detected for each feature represent an alarm signal and then we can guide in generating preventive actions regarding the problem of migrating customers to competing operators. For example, customers with old offers may be contacted for renewal of services, those with small seniority in the network or young customers may be stimulated by various benefits.
Following the study, other data science and feature selection tools will be tested, and the established features will be expanded on historical data.
Discussions
The large number of studies published in the last ten years on the problem of customers migrating from one telecommunications service provider to another competing provider proves that this problem has become a major concern for this industry and beyond. To solve this situation, we must know exactly where we can act: what are the factors that influence this action of the client. We want to find out these answers through a method of classifying the indicators analyzed according to their importance in the churn model. In our study, the main decision-making factor in the customer’s churn action is represented by the supplier’s interaction with the subscriber: the offer; a small number of months since the last bid decreases the chances of the subscriber making churn.
As previously demonstrated in other studies, in the context of churn in telecommunications, besides the usage of minutes, existing indicators and in our study, internet usage and allowance is an important factor in this process. It has been shown that increasing the benefits of the internet can be an anti-churn technique. Other indicators of churn may be related to the quality of video calls, the power of network coverage, but also the lower costs of subscriptions (bill and additional cost).
As a target for a new paper, in the future, we will have the investigation and analysis of the influence of internet usage, the quality of the services provided, as well as others anti-churn indicators presented in the literature.
Altmann, A., Toloşi, L., Sander, O. & Lengauer, T. (2010), ‘Permutation importance: a corrected feature importance measure’, Bioinformatics 26, 10, 1340–1347.
Casalicchio G., Molnar C., Bischl B., ‘Visualizing the Feature Importance for Black Box Models’, Lecture Notes in Computer Science, volume 11051 (2019).
Chen, C., Liaw, A. & Breiman, L. (2004), ‘Using Random Forest to Learn Imbalanced Data’.
Fisher, A., Rudin, C., Dominici, F. (2018), ‘Model class reliance: variable importance measures for any machine learning model class, from the Rashomon perspective’.
Greenwell, B. M. (2017), ‘An R Package for Partial Constructing Dependence Plots’, The R Journal 9/1.
Gregorutti, B., Michel, B., Saint-Pierre, P. (2017), ‘Correlation and variable importance in random forests’. Comput. 27(3), 659–678.
Idris, A., Rizwan, M. & Khan, A. (2012), ‘Churn prediction in telecom using Random Forest and PSO based data balancing in combination with various feature selection strategies’. Computers and Electrical Engineering 38, 1808–1819.
Lundberg, S.M, Lee, S.-I. (2017), ‘A Unified Approach to Interpreting Model Predictions’. Advances in Neural Information Processing Systems 30 (NIPS 2017).
Kobyliński, Ł., Przepiórkowski, A. (2008), ‘Definition Extraction with Balanced Random Forests’. Lecture Notes in Computer Science Springer, Berlin, Heidelberg.
O’Brian, R., Ishwaran, H. (2019), ‘A random forests quantile classifier for class imbalanced data’. Pattern Recognition 90 (2019) 232–249.