Ilona Kwiecień, Patrycja Kowalczyk-Rolczynska and Michal Popielas
Department of Insurance, F aculty of Economics and Finance, Wroclaw University of Economics and Business, Poland
Volume 2020,
Article ID 539912,
Journal of Eastern Europe Research in Business and Economics,
12 pages,
DOI: 10.5171/2020.539912
Received date: 12 November 2019; Accepted date: 5 February 2020; Published date: 4 June 2020
Cite this Article as:
Ilona Kwiecień, Patrycja Kowalczyk-Rolczynska and Michal Popielas (2020)," Are the Generations Ready to Accept the New Technologies in Life Insurance Underwriting? Questionnaire Study in Poland ", Journal of Eastern Europe Research in Business and Economics Vol. 2020 (2020), Article ID 539912, DOI: 10.5171/2020.539912
In the risk assessment of life insurance, demographic trends and behavioural changes compared to the use of new technologies are crucial today. The ability to process ever-increasing amounts of customer data, such as data from search engines, shopping portals, social media activity data or data from devices or mobile applications, enables insurers to receive high quality customer data and provide them with personalized insurance purchase offers. The ‘pay as you live’ concept, where the use of technology allows the collection of current data on key risk parameters in life insurance, such as lifestyle and health, and enables interactive reactions. Market analyses show that the use of new technologies varies according to the characteristics and attitudes of different generations. Attitudes are examined in the area of using new technologies in life insurance. This study hypothesizes that the attitude of buyers will change depending on the generation (age). To test this hypothesis, the results of surveys conducted in Poland are presented. A sample of 304 respondents was analysed, based on a survey conducted in the period June-July 2019. To analyse the results and assess the correlation between certain features, the authors performed a chi-square independence test, Fisher’s exact probability test and a Mann-Whitney U test. Findings show that despite the widespread use of mobile devices, the number of respondents who would agree to monitor their health and share data with an insurance company is small. Only 32% of the people using these mobile applications would provide the insurance company with data on their life parameters, health condition, physical activity and lifestyle in exchange for reducing insurance premiums when purchasing life insurance. In this group, 35% of the respondents would expect to receive a free smartwatch or a free smartband from the insurance company. Most respondents (68%) would not do this, mainly due to concerns about privacy and a fear of raising the insurance premium. Surprisingly, against the background of the analysed characteristics of the generations, it is worth noting that there is no significant difference between the generations. On the other hand, this study found that there is a significant correlation between genders and also between BMI and the acceptance of monitoring.
Keywords: Life Insurance; Underwriting; New Technologies, Generations
Introduction
Underwriting is an important stage in the life insurance process and is concerned with accepting individuals into an insurance fund and the terms on which they are accepted. Underwriting has an impact on the insurance strategies implementation as to the quality of the portfolio, the adequacy of the premium, the profitability of products and consequently, the cost and solvency of the insurance company.
Underwriting refers to the process of selecting and classifying insurance applications (Vaughan, 1982); a process of evaluating and pricing risks proposed for insurance (Benett, 2004). It is one of the key business processes within the operational activities of insurance companies. As a mechanism for supporting financial stability, underwriting contributes to the formation of a well-diversified and profitable insurance portfolio (Mkrtychev & Enik, 2018).
The development of life insurance underwriting and the new approaches are described in (Klein 2012 and Doan 1996). Based on the changes in the life insurance, the underwriting process could be divided into the following stages: The first stage comprised the development of risk assessment systems, which lasted until the end of the 19th century. Preliminary health questionnaires were often completed by the applicant and his family along with a description of his work. The second stage (from the beginning of the 20th century) was medical and statistical and it started when the attention began to be paid to the dependence of individual risk factors on the mortality of insured persons. In the third stage – the case-actuarial stage – the numerical insurance risk assessment system underwent significant development. Insurers became increasingly aware that prospective studies and current disease statistics from hospitals and clinics needed to be used in place of historical data. Examining the scope of data, which are all the time considered as the key risk factors such as age, medical history and perceived current state of health, as well as the life style of an individual (IAA 2014), the authors of this paper change the techniques and seek for new possibilities of how to do that more accurately in a deeper way.
The availability of new electronic tools and the progress of digitisation have given insurers new opportunities to obtain data on their clients, which can now be used in risk underwriting. Applications can be used to collect and transfer data quickly, cheaply and efficiently (Błajda, Barnaś & Pieniążek, 2017). Although digital transformation grants insurance companies exceptional capabilities, it also creates enormous expectations. Mobile applications in electronic devices, smartphones, smartwatches and smartbands enable people to register their lifestyles, analyse physical activity, engage in sports (and they offer the possibility to choose a discipline), measure heart rate at the wrist, analyse sleep, count the number of steps walked, indicate the number of calories burned and so on. All this data can be an important source of information when the insurer makes decisions as to whether a client is accepted for life insurance or not. This information can also be useful in monitoring the lifestyle and health status during the insurance coverage period.
The development of new technologies and use of mobile applications have also led to the creation of a new insurance sales model called: ‘Pay as you live’. This is a relatively new insurance concept aimed at improving controllable behaviours to reduce premiums and reward insured persons. It requires clients to provide ongoing data to the insurance company about their lifestyle through existing and new data sources (e.g. wearable technology). At the same time, insurers encourage their customers to live a healthier lifestyle to reduce the risk of death and chronic or critical illness. Users can also track their own habits through an easily accessible mobile interface, using the data to monitor and alter behaviours such as diet and exercise to improve health outcomes. Insurers can use the behavioural data generated to personalise solutions based on a heightened understanding of a customer’s health status and relevant risk factors. This in turn provides the policy holder with rewards and discounts. Insurers thus try to create products based on applications that proactively encourage and reward healthier ways of life (Ernst &Young, 2015).
In a digital world, insurers need to collect data themselves, which means that their customers must be willing to share this valuable resource. In 2017, the IBM Institute for Business Value in association with the Institute of Insurance Economics University of St. Gallen conducted a survey that explored inclinations to share among consumers (almost 16,000 survey participants). The results showed that 46 percent of the respondents were willing to share their health data with their insurer and 43 percent were willing to share information about their medical history. However, only 21 percent were willing to share information from their social media profiles. Data from this global survey, therefore, indicates that, in the eyes of consumers, insurers need to increase levels of trust, create benefits and make sharing easy (IBM Institute for Business Value, 2017). In 2016, Insurance Nexus published a survey of 50f0 consumers (covering a wide demographic range from North America and the EU) in which 81.5% people stated that they were happy to share data about their age, gender and marital status with insurance companies. The majority were happy to share their employment information (60 %). Amongst the types of data consumers were least willing to share, were their social calendar (71% not willing to disclose that information), their social media information (64% not willing to share) and their purchasing behaviours (63% not willing to share) (Insurance Nexus, 2016).
Studying sociological differences between generations justifies a separate analysis of groups.
Generations – the classification and characteristics
Scholars define the concept of generations in different ways. Available classifications differ in terms of names (nomenclature) and years of birth for representatives of a given generation. The example classifications of generations based on a review of the literature published in 2018 and after can be given – using the years of birth for representatives of a given generation:
Dimock (2019):
Silent – born between 1928 and 1945
Boomers – born between 1946 and 1964
Generation X – born between 1965 and 1980
Millennials – born between 1981 and 1996
Generation Z – born between 1997 and 2012
Chicca & Shellenbarger (2018):
Generation Y – born in the early 1980s through the mid-1990s
Generation Z – born between the mid-1990s and ending around 2012 (Generation Z includes those born from 1995 onwards)
Lakatos et al. (2018):
Generation X – born between 1965 and 1980
Generation Y – born between 1980 and 2000
Generation Z – born after 2000
Goh & Lee (2018):
Baby Boomers – born between 1945 and 1964
Generation X – born between 1965 and 1979
Generation Y – born between 1980 and 1998
Generation Z – born between 1995 and 2009
Cho, Bonn & Han (2018)
Generation Y – born between 1977 and 1994
Generation Z – born in the mid-1990sthrough to 2002
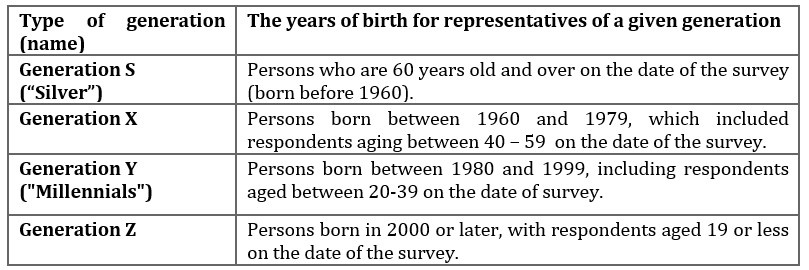
Based on the analysis of the literature, along with the Polish society specificity where the retirement age is 60 for women, the authors adopted the following classifications of generations (see Table 1).
Table 1: The classification of generations in a research
Source: own elaboration
Based on the literature review, the following findings regarding features and attitudes in generations may be relevant to the area of insurance and new technologies, and provide possible directions for future research:
Generation silver (S)
The characteristics of this group are not obvious because the social, economic and demographic changes that are taking place mean that older people can now transform themselves into modern ones. Their values, attitudes and ways of behaviour in the market are all changing, which means that the “traditional senior” is becoming a “modern senior”.
A traditional senior is one who, among others (Jurek, 2012 and Gallagher, 2019):
– Perceives him/herself exactly as shown in their age record,
– Believes that everyone should behave according to his/her age,
– Has poorly developed basic consumer competences and lacks confidence when making purchasing decisions,
– Exhibits high aversion to technological novelties,
– Prefers face-to-face meetings,
– Prefers hard copies of information,
– Is looking for stability and a routine that guarantees a sense of security,
– Is concerned about his/her financial security.
Conversely, a modern senior is one who:
– Perceives him/herself as younger than the metrics indicate,
– Feels that he/she is the “master of the situation”,
– Is an experienced, wise and alert consumer who feels confident when making shopping decisions,
– Is generally open to technological innovations (may not apply to everyone),
– Looks for new experiences and challenges,
– Feels reasonably financially secure.
The difference between “traditional” and “modern” seniors can be crucial in numerous areas when making decisions. Gacka (2017) notes that the number of senior Internet users has significantly increased over the past ten years; their profiles and the way they reach the network have changed, their numbers comprise both “beginners” and “hobbyists” as well as “professional users”. At the same time, Gacka points out that, in terms of demography, the number of senior Internet users belonging to the second and third groups will significantly increase in the coming years.
Generation X
Generation X grew up with both parents in the workforce or in a divorced household, and as a result, many of this generation become independent at a young age. This generation is described as experiencing social insecurity, rapidly changing surroundings and a lack of solid traditions. Generation X tends to lack the social skills of its parents but to have strong technical abilities . Generation X tends to be reluctant when it comes to network and is attracted more by ads and recommitment. It pioneered the free-agent workforce and believes that security comes from keeping skills current. This generation is likely to find a way to get things done smartly, fast and best even if it requires bending the rules. It tends to respond well to a coaching management style that provides prompt feedback and credit for results achieved (Acar, 2014).
Working people of generation X appreciate the stability, and the calm and undemanding work. They are faithful to their work. Representatives of this generation simultaneously care about the quality of private and professional life. They are independent in making decisions, rather professionally and socially active (Hysa, 2016).
Generation Xers supposedly prefer working alone to working in teams; are more technologically oriented and more educated than their counterparts; and they are having fun. Other preferences of the Generation Xers are: flexibility, money and benefits, harmonious work environments, and fulfillment (Rodriguez, Green & Ree, 2003).
Generation Y
In the literature, several terms are used interchangeably to describe generation Y, such as the millennium generation or millennials, the why generation, Echo Boomers, generation Net, the generation of the network, the next generation, the searching generation, the “me” generation and even the generation of flip-flops and iPods.
The general conclusion, based on research relevant to the authors of this papers’ own findings, is that it is a generation characterised by self-confidence, conviction in personal values and knowledge, changing demands, readiness to develop, and excellent knowledge of the Internet and new technologies (Kucsamer-Kłopotowska, 2016).
According to Brown, Thomas and Bosselman (2015), “Generation Y members have high expectations and exhibit traits of being confident, well-educated, self-sufficient, tolerant, team builders and socially/politically conscious.” They are optimistic about the future compared to Baby Boomers and Generation X, and also show greater mobility and openness regarding contact with other cultures (Kucsamer-Kłopotowska, 2016). Jalil et al. (2015) also contended that Generation Y employees are confident, civic-minded, fast learners, and dislike inflexible work schedules and rigid, restrictive policies and procedures.
It is a generation that is characterised by a fast pace of life, where change is treated as a normal state (e.g. by the ability to quickly communicate and perform several activities at the same time). People from generation Y, however, also exhibit impatience and a desire to have everything immediately (Mazur-Wierzbicka, 2015)
Generation Z
Generation Z (also called the “i Generation” or “mobile generation”) is the people who are highly educated, technologically savvy, innovative and creative. This is the first generation born into a digital world and lived their lives online. Generation Z members present a challenge as they appear to behave differently than earlier generations and this can lead to wider changes in consumer behaviours (Priporas, Stylos & Fotiadis, 2017).
Generation Z is also recognised as the first US age group to know nothing about a world without the Internet (Cho, Bonn & Han, 2018). They have grown up with technologies such as the world wide web, mp3 players, text messaging, cell phones, PDAs, YouTube, IPADs and media technologies. They are self-confident and happy, exhibit a team spirit, enjoy social activities, and are also more interested in activities than previous generations (Ozkan & Solmaz, 2015).
Members of this group are avid consumers of technology and crave the digital world. However, their frequent use of technology means that they may exhibit underdeveloped social and relationship skills and are at an increasing risk for isolation, insecurity and mental health issues such as anxiety and depression. Members of Generation Z are also pragmatic. Having grown up in times of social, political and economic uncertainty, this generation is cautious and concerned about their emotional, physical and financial safety (Chicca & Shellenbarger, 2018).
These differences in the characteristics and attitudes of generations provide the basis for examining whether and how they affect the possibility of using new technologies in the underwriting process.
Methodology, Data and Results
The research tool was an anonymous survey questionnaire developed by the authors, conducted in the period June-July 2019. It was conducted online with people in Poland using Google forms and disseminated through social networks. Nevertheless, the authors are aware of the deficiencies of such forms. Overall, 304 completed questionnaires were submitted. The pilot study analyzed the results covering the extreme groups – the youngest and the oldest, as a way of suggesting specific features in the approach to new technologies and digitization (Kowalczyk-Rolczynska, Kwiecien and Popielas 2019). In the present publication, the authors cover the entire group of respondents, including the middle generation, marked in the analysis as X generation, which was the largest group of respondents.
Most responses to the questions were given on a nominal scale. Therefore, to analyse the results and assess the correlation between certain features, the authors performed a chi-square independence test, Fisher’s exact probability test and a Mann-Whitney U test (for the quantitative variable as there was no normal distribution of the data). All calculations were conducted using the Statistica program.
In the respondents group, 45% are from the X generation, 38% are from the Y generation, 2% are from the Z generation and 15% are from the silver group. The group of respondents selected for further analysis comprised 61% women and 39% men. The vast majority of the respondents had received higher education (238 people, 78%), with the remaining respondents receiving secondary education (59 people) or vocational and basic education (7 people, mainly from the Z generation). In addition, 60% of the respondents lived in a large city (over 250,000 inhabitants), 18% lived in the countryside, 13% lived in a city of up to 50,000 residents and 9% lived in cities of 50,000 up to 250,000 residents. Most respondents were either married or had a partner (55% and 13%, respectively), 32% were unmarried (19% single, 9% divorced and 4% widowers). 67% of the respondents had children and 33% had no children. Among the whole group, 84% of the respondents were employed. Those who were not working were pensioners (12% of the respondents), students (3% of the respondents) and 3 persons who were unemployed. Among the respondents, 4% did not have any income, 14% received a monthly gross income of no more than PLN 2,500, 37% received a monthly gross income ranging between PLN 2,501 – PLN 5,000, 23% received a monthly gross income higher than PLN 5,000 but lower than PLN 8,000, 11% received a monthly income higher than PLN 8,000, but lower than PLN 12,000 and 11% received a monthly income in excess of PLN 12,000.
To embed a study in the area of life insurance, it has to be pointed that among all the respondents, 67% had life insurance and 33% did not. Only 5% of the people from the group who had life insurance declared a willingness to buy another life insurance product. By contrast, 35% of the respondents without life insurance were considering buying such a product.
Analysing all generations separately shows that 80% of older people had life insurance, while 55% of people from generation X and less than 57% of people under 40 years old had life insurance. These differences were statistically significant at a level of 0.01 (using the chi-square independence test, the p-values was 0.00372). This suggests that whether respondents have life insurance or not is related to their age.
In order to answer the research question posed about whether acceptance for monitoring is determined by belonging to a particular generation, the analysis on the basis of surveys has been subjected:
– The extent to which generations use mobile devices
– What is the tendency to share data when concluding a life insurance contract, including whether additional incentives, such as a free device or reduced premium, are important, but also what are the possible reasons for not agreeing.
According to the first issue – using mobile devices, it was found that:
Of all the people participating in the survey, 94% use the Internet every day. Among these people, 6% use only landline Internet, 25% use only mobile Internet, while 69% use both landline and mobile. Analyzing the generations separately, it can be seen that 91% of older people used the Internet every day, while 100% of the people belonging to generation X as well as 100% of those belonging to generations Y and Z, use the Internet every day. This difference is statistically significant at a level of 0.01 (using the chi-square test, the p-values were 0.00001).
A total of 94% of the respondents also used a smartphone every day. 80% of the silver generation used a smartphone every day, while 95% of X generation and 98% of Y and Z generations used this device every day. This difference is statistically significant at a level of 0.01 (using the chi-square independence test, the p-values were 0.0004). Therefore, young people were significantly more likely to use both the Internet and a smartphone, which is consistent with the generational characteristics.
Of all the respondents, only 19% use a smartwatch or a smartband every day. Among the group of people using a smartwatch or a smart band, 9% were elderly people, 57% were people belonging to generation X and the rest were under 40 years of age.
Among the 57 persons using a smartphone, a smartwatch or a smartband on a daily basis, 91% used mobile applications that recorded data on physical activity, sports, life parameters (heart rate, respiration rate) and sleep analysis. Among the silver generation respondents using the smartphone on a daily basis, 41% use these mobile applications, while in the group of respondents who use the smartphone from the Y and Z generations on a daily basis, 46% use the above applications. The largest percentage of respondents who use a smartphone and the applications mentioned above is generation X (50%).
Examining the attitudes towards sharing the data and the monitoring during the policy period, it was found that:
Only 32% of the people using these mobile applications would provide the insurance company with data on their life parameters, health condition, physical activity and lifestyle in exchange for reducing insurance premiums when purchasing life insurance. In this group, 35% of the respondents would expect to receive a free smartwatch or a free smartband from the insurance company. Most respondents (68%) would not do this, mainly due to concerns about privacy and a fear of raising the insurance premium.
The spread of results was similar for both the silver generation and the Y and Z generations. For instance, among the older people, 31% declared a willingness to share this information, with 64% expecting to receive a free smartwatch or a free smartband from the insurance company. In the group of people under 40 years of age, 32% of the respondents declared that they would share this data, of which only 49% would expect to receive a free device. However, in the group of people belonging to generation X, only 23% would provide the insurance company with data on their life parameters, health status, physical activity and lifestyle collected in mobile applications in a smartphone/smartwatch/smartband in exchange for the possibility of reducing the insurance premium during purchasing life insurance, of which 50% would expect to receive a free smartwatch or a free smartband from the insurance company.
The chi-square test of independence showed that there was no significant correlation between age and a willingness to share data with the insurance company in exchange for lowering the insurance premium when purchasing life insurance.
This lack of willingness to disclose data to the insurance company is primarily driven by the desire to maintain privacy (65% of the answers by respondents from the Y and Z generations, 78% of the answers by respondents from X generation and 71% of the answers by the silver generation respondents) and a fear of raising the insurance premium (7% of the answers by respondents from generations Y and Z, 5% of the answers by respondents from generation X and 16% of the responses by respondents from the silver generation).
People participating in the study appeared to be rather reluctant to monitor their vital signs for the insurance company. Among all the respondents, only 26% would agree to have the insurance company monitor their life parameters, physical activity, lifestyle and health condition during the period of insurance protection using a mobile application.
In the group of respondents over than 60 years of age, 28% would agree to monitor vital signs by the insurance company. In the group of respondents belonging to generation X, 30% would agree to the monitoring by the insurance company of their vital parameters using mobile applications, while in the group of respondents under 40, only 19% were willing to do that. The chi-square test of independence showed no significant correlation between the generations to which people belonged and the consent to monitor life parameters during the insurance coverage period.
The analysis also examined the dependence between genders and the consent to monitor vital signs by the insurance company. Using the chi-square independence test and Fisher’s exact probability test, it can be stated that at a significance level of 0.01, there is a statistically significant correlation between genders and the consent for monitoring life parameters by the insurance company during the insurance protection period (p-value for the chi square test was 0.00486 and for Fisher’s p-value was 0.00387).
It is noteworthy that among all the respondents who agreed to monitor their vital signs and life style, 47% of the respondents are women and 53% are men
To broaden the analysis, the authors introduced a question into the study to determine the BMI index and further check whether it is a factor determining attitudes in the willingness to share data with life insurance companies. The question was inspired by the common use of the BMI in life insurance underwriting to estimate individual’s health and fitness condition, and it is considered when determining the acceptance of applications and insurance premiums (risk drivers in life insurance practice discussed in detail among others in IAA 2014). BMI is calculated as the mass of an individual (in kilograms) divided by his/her height (in meters) squared.
Respondents were also asked to provide their weight and height, on the basis of which their BMI index was calculated. Overall, 50% of the respondents were classified as having “normal weight” (BMI within the range 18.5-24.9), 36.5% belonged to the “pre-obesity” group (BMI within the range 25 – 29.9), 9% belonged to the “obesity class I” group (BMI within the range 30.0-34.9), 2% belonged to the “underweight” group (BMI below 18.5) and the remaining 2.5% belonged to the groups: “obesity class II” and “obesity class III”. Among the silver generation, 35% of the respondents belonged to the “normal weight” group, 46% to the “pre-obesity” group, 16% to the “obesity class I” group and 3% to the “obesity class II”. In generations Y and Z, 4% of the respondents belonged to the “underweight” group, 61% to the “normal weight” group, 32% to the “pre-obesity” group and only 3% to the “obesity class I” group. Among the generation X, 48% of the respondents belonged to the “normal weight” group, 35% to the “pre-obesity” group, 11.5% to the “obesity class I” group, 4.5% to “obesity class II” and “obesity class III”, and 1% of the respondents belonged to the “underweight” group.
The next step in the analysis involved checking whether a lack of consent to monitor vital signs for the insurance company is related to BMI. Because BMI is a quantitative variable, a Shapiro-Wilk test was used to separately test the normality of the distribution for persons agreeing to give the consent and persons not agreeing.
The results show that the BMI distribution in the group of consenters was not normal, and therefore, a non-parametric Mann-Whitney U test was used to assess variations in average BMI level between those agreeing to monitor vital signs and those not agreeing. The calculated test probability values p (p = 0.027359) indicate that there is a basis for rejecting the null hypothesis, which means that the differentiation of average BMI values in people who agree to monitor their vital parameters and people who do not agree is statistically significant. This means that the consent or lack of the consent is related to the BMI value.
Conclusions
This study was intended to conduct initial observation and verification of the hypotheses, as well as to determine the directions of further research. The authors are aware that the sample size is quite low and that the results cannot be extrapolated to the entire population. For this reason, as indicated, part of the classification of generations was modified, including the specificity of Polish society, in which the retirement age was set at 60 for women, and early retirement is possible, which affects the perception of the group of older people. The manner of conducting the online survey must also be taken into account as a limitation and a factor determining the quality of respondents, although on the other hand this use of the internet is important as a pre-condition for considering the potential consent for sharing data in the process of purchasing services – here insurance. Despite the limitations, conclusions can be drawn that will have implications for developing a broader survey and possible behavioral experiments in small groups, as well as a reference point for other studies, even in a direct form by reaching people who do not use the internet, which can also change habits for insurance purchase purposes.
The following findings deserve special attention in the study:
Despite the widespread use of the Internet and mobile devices, the number of respondents who would agree to monitor their health and share data with an insurance company is small. Compared to the surveys referred to in part, where 46% of people were willing to share their insurance data with an insurance company (IBM, 2017), in this study only 32% of those already using mobile applications respondents would agree (25% total respondents). This discovery is surprising given the structure of the study group in which higher education dominates. It is noteworthy that among all the respondents who agreed to monitor their vital signs and life style, 47% of the respondents are women and 53% are men
The main reason for refusing to share data is the desire to maintain privacy, but also the fear of raising the insurance premium. It is noteworthy that there is no significant difference between generations, although the least marked group is the generation X (40-59 years on the date of the study), and not, for example, the elderly. Older people would more often expect a free device for this, which testifies to the openness of this generation to new technologies. The most important reason, as indicated, is the desire to preserve privacy – this high desire to preserve privacy in the Z generation, which is perceived as “living online”, can be surprising. A fairly large percentage of people worrying about increasing the premium (25%) implies the need to increase the awareness of potential benefits.
The results of the study, taking into account the BMI, are interesting. In the study of (Kowalczyk-Rolczynska, Kwiecien and Popielas, 2019), in which only generations of the so-called extreme – the youngest and oldest, excluding generation X, found that there is no correlation between BMI and a tendency to share data with the insurance company. However, the analysis of the full group of respondents, including the generation designated as X (here aged 40-59) changed this result. The calculated test probability values p (p = 0.027359) indicate that there is a basis for rejecting the null hypothesis, which means that the differentiation of average BMI values in the people who agree to monitor their vital parameters and those who do not agree is statistically significant . This may be due to the fact that in this generation, more people belonged to the pre-obesity or obesity class. This finding is important because obesity, as having harmful consequences for health and as being in the two-way conjunction with lifestyle, is a basic and traditional risk factor in life insurance. On the one hand, it was pointed out that evolution, including the use of new technologies, clearly aims to deepen preferred insurance (Klein 2012). Also, the study indicates that BMI and the overall assessment of a health claim can be significant variables to distinguish between life insurance applicants (Bronsema et al. 2015). For such people, the acceptance of new technologies may be important for protection, which is why their usefulness is also significant as an area of educational activities. This could be an area for in-depth research.
The second plus area is the 60 plus generation. In time of the aging of societies and increasing life expectancy, this study observes the extension of the period in which risk is still accepted by life insurers – as well as in the mortgages and short term loans, which is also the driver for life insurance demand. That means that this group (old age) becomes an important protection entity. In this silver generation, it may be important that a potential inclination to accept monitoring could facilitate obtaining insurance in old age, or continuing existing protection under unchanged conditions, while enabling prevention (in combination with health insurance) or collecting data for future groups.
The small number of respondents in the subject study constituted here a limitation of in-depth analysis, on the other hand, it is an implication for further research (in progress) aimed at in-depth analysis of silver generation, taking into account the differences in the group structure indicated in the analysis of generations, which requires further division for research.
Finally, it is important to note that no issue has been raised by the authors regarding whether it is permissible to adjust the premium in line with monitoring data, other than to state that regulations often prevent this (as they do in Poland).
Acknowledgment
The project is financed by the Ministry of Science and Higher Education in Poland under the programme “Regional Initiative of Excellence” 2019 – 2022, project number 015/RID/2018/19, the total funding amount is10 721 040,00 PLN
Acar A. (2014) ‘Do Intrinsic and Extrinsic Motivation Factors Differ for Generation X and Generation Y?’, International Journal of Business and Social Science, 5, 12-13
Benett C. (2004): Dictionary of Insurance; Pearson Education Lt; FT Prentince Hall, London, 2004, p. 310
Błajda J, Barnaś E., Pieniążek A.(2017) ‘Rola mobilnych aplikacji medycznych w profilaktyce wybranych chorób’. Praca poglądowa. Instytut Położnictwa i Ratownictwa Medycznego, Uniwersytet Rzeszowski, Instytut Ochrony Zdrowia, Państwowa Wyższa Szkoła Zawodowa w Tarnowie.
Bronsema, J., Brouwer, S., de Boer, M. R., &Groothoff, J. W. (2015). The Added Value of Medical Testing in Underwriting Life Insurance. PloS one, 10(12), e0145891. doi:10.1371/journal.pone.0145891
Brown E.A., Thomas N.J., Bosselman R.H.(2015)‘Are they leaving or staying: A qualitative analysis of turnover issues for Generation Y hospitality employees with a hospitality education’, International Journal of Hospitality Management, 46, 130–137.http://dx.doi.org/10.1016/j.ijhm.2015.01.011
Chicca J., Shellenbarger T. (2018)‘Connecting with Generation Z: Approaches in Nursing Education’, Teaching and Learning in Nursing, 13, 180–184. https://doi.org/10.1016/j.teln.2018.03.008
Cho M, Bonn M.A., Han S.J. (2018) ‘Generation Z’s Sustainable Volunteering: Motivations, Attitudes and Job Performance’, Sustainability,10 (5),1-16. https://doi.org/10.3390/su10051400
Chomątowska B., Żarczyńska-Dobiesz A. (2014) ‘Pokolenie ,,Z” na rynku pracy – wyzwania dla zarządzania zasobami ludzkimi’. PraceNaukoweUniwersytetuEkonomicznego we Wrocławiu, 350, 405-415
David S., Kandampully J., Kralj A. (2012)‘Generation Y Employees: An Examination of Work Attitude Differences’, Journal of Applied Management and Entrepreneurship, 17(3), 36-54
Gacka J. (2017)‘Polscy seniorzy w sieci: wirtualna złota jesień? Korzystanie przez osoby dojrzałe z Internetu i nowych technologii’,Konteksty Społeczne, 5 (1), 84-91
Goh E., Lee C. (2018) ‘A workforce to be reckoned with: The emerging pivotal Generation Z hospitality workforce’, International Journal of Hospitality Management, 73, 20–28
Hysa B. (2016) ‘Zarządzanie różnorodnością pokoleniową’. ZeszytyNaukowePolitechnikiŚląskiej, 1964, 388-389
IBM (2007) IBM Institute for Business Value in association with Institute of Insurance Economics University of Gallen, Executive Report: Data: gold or kryptonite? An insurer’s guide to the resource of the future, [Online], [Retrieved September 11, 2019] https://www.ivw.unisg.ch/wp-content/uploads/2017/11/data_gold_or_kryptonite2017.pdf
Jalil S.W., Achan P., Mojolou D.N., Rozaimie A. (2015) ‘Individual Characteristics and Job Performance:Generation Y at SMEs in Malaysia’, Procedia – Social and Behavioral Sciences, 170, 137 – 145
Jurek Ł. (2012) Ekonomia starzejącego się społeczeństwa, Difin, Warszawa
Kowalczyk-Rólczyńska P., Kwiecień I., Popielas M.(2019) Pay as you live and New Technologies in Life Insurance Underwriting in the Context of Generations Characteristic and Attitudes – Evidence from Poland“; Proceedings of the 34th International Business Information Management Association Conference (IBIMA), Vision 2025: Education Excellence and Management of Innovations through Sustainable Economic Competitive Advantage; ISBN 978-0-9998551-3-3
Kuczamer-Kłopotowska S.(2016) ‘Rola mediów społecznościowych w komunikacji pokolenia Y’, Handel Wewnętrzy, 3(362), 216-227
Lakatos E.S., Cioca L., Dan V. et al. (2018) ‘Studies and Investigation about the Attitude towards Sustainable Production, Consumption and Waste Generation in Line with Circular Economy in Romania’, Sustainability,10(3), 865, https://doi.org/10.3390/su10030865
Łańcucki J. (2018) ‘Klient na cyfrowym rynku ubezpieczeniowym’, Prawo Asekuracyjne, 2(95), 3-14
Mazur-Wierzbicka E. (2015) ‘Kompetencje pokolenia Y – wybrane aspekty’, Zeszyty Naukowe Uniwersytetu Szczecińskiego. StudiaiPraceWydziałuNaukEkonomicznychiZarządzania, 39 (3), 307-320
, Enik O. (2018) Automated Underwriting Control in a Regional Insurance Company, Advances in Economics, Business and Management Research, vol. 47, International Scientific Conference “Far East Con”[Online], [Retrieved September 11, 2019] https://www.atlantis-press.com/proceedings/iscfec-18/55912389
Ozkan M., Solmaz B. (2015) ‘The Changing Face Of The Employees- Generation Z And Their Perceptions Of Work (A Study Applied To University Students)’, Procedia Economics and Finance Elsevier, 26, 476-483, https://doi.org/10.1016/S2212-5671(15)00876-X
Priporas C., StylosN., Fotiadis A. (2017)‘Generation Z consumers’ expectations of interactions in smart retailing: a future agenda’,Computers in Human Behavior, 77, 374-381, https://doi.org/10.1016/j.chb.2017.01.058
Rejda G.J. (2008)Principles of risk management and insurance, Boston.
Rodriguez R., Green M. &Ree R. (2003) ‘Leading Generation X: Do the Old Rules Apply?’, The Journal of Leadership and Organisational Studies, 9, 68-69
Vaughan J. (1982) Fundamental of Risk and Insurance, New York.