Volume 2021,
Article ID 492695,
Journal of Eastern Europe Research in Business and Economics,
17 pages,
DOI: 10.5171/2021.492695
Received date: 30 November 2020; Accepted date: 3 February 2021; Published date: 27 May 2021
Cite this Article as:
Bogumila MUCHA-LESZKO and Magdalena K. KAKOL (2021)," Does Poland’s Economy Meet the Criteria of Real Convergence with the Euro Area?", Journal of Eastern Europe Research in Business and Economics Vol. 2021 (2021), Article ID 492695, DOI: 10.5171/2021.492695
EU catching up countries, which operate in a monetary union with highly developed countries, recorded good economic results until the 2008+ crisis. However, their resistance to the economic recession turned out to be much lower than that of the economically stronger countries (except Poland). The discussion on deepening monetary integration, which has been going on for several years, will make countries outside the euro area face a difficult decision – to maintain the current status quo or adopt the common currency. The authors recognized that the basis for the decision in this matter should be the level of economic convergence with the more developed countries of the EMU. That is why the aim of the paper is to assess the level of economic convergence of Poland with selected countries – with the highest level of development (Austria, Germany, France, the Netherlands) and catching up ones (Spain, Portugal and Slovakia). The time range of the analysis covers the years 2002-2019. The following economic indicators and measures of convergence were used: GDP and GDP per capita, labor productivity, employment, investments, unit labor costs, TFP, unemployment, exports and inflation, as well as indicators illustrating the situation in public finances and external equilibrium. The empirical analysis was based on the OCA theory. The main result of this analysis is that Poland has made great progress in meeting the criteria of economic convergence, but there is still a risk of economic shocks, which may lead to a decline in the competitive advantage and exports, and consequently GDP dynamics.
Keywords: Monetary Union, The OCA Theory, Poland’s Catching Up Effects, Risks of Limiting the Benefits from The Common Currency.
Introduction
By joining the European Union, Poland and other Central and Eastern European countries committed themselves to the introduction of the euro in the Accession
Treaties. However, due to the lag in the economic development in relation to the countries operating in the common currency area, the new member states from CEE obtained a special status allowing them to postpone the euro adoption date. The official EU documentation terminology uses the name of countries with a derogation, which are obliged to pursue a policy accelerating the reduction of the economic distance in relation to more developed countries and a policy of structural changes driven by technological progress.
The adjustment of the economy to the effective functioning in the common currency area consists in reducing the economic and technological gap and catching up with countries with a higher level of development. As a result, the new member states have greater opportunities to permanently meet the treaty criteria of the monetary union. Even more important from the point of view of effective participation in the euro area, i.e. the possibility of achieving not only economic, but also social and political benefits, is the fulfillment of the conditions for participating in the monetary union defined by the authors of the Optimum Currency Area (OCA) theory. In the conditions of high economic openness and the increased interdependence of development processes in the global dimension, as well as the rising impact of the foreign exchange and financial market on the real economy, the interest of countries in a more advanced monetary integration is growing. The free movement of capital and speculative transactions contribute to the destabilization of exchange rates and financial markets. In the conditions of growing risks and uncertainty in doing business, as well as recurring financial and economic crises, countries without currencies of recognized international credibility are increasingly interested in joining monetary unions. For these reasons, some of the CEE countries adopted the euro (Slovenia, Slovakia, Estonia, Latvia, Lithuania), and Poland, the Czech Republic, Hungary, Bulgaria and Romania have retained their national currencies. On the one hand, these new premises support the introduction of the euro throughout the European Union, but on the other hand, the effects of the 2008+ crisis contributed to a decline in the interest of Poland, the Czech Republic and Hungary in implementing the euro.
In 2008-2009, there was a significant drop in investment and consumption demand; capital flowing away to home countries, the inability to pursue a national monetary policy and the lack of a mechanism of the nominal exchange rate limited the possibilities of intensifying adjustment processes and mitigating the effects of the crisis. Such a situation was interpreted as a weakness of the monetary union resulting from the incapability to adjust the countercyclical policy to the course of the business cycle in individual countries, and the greater possibilities of smoothing the business cycle in countries with their own currency were emphasized.
Another argument undermining the benefits of catching up countries, resulting from joining the monetary union, were the consequences of the 2008+ crisis in Greece, Spain and Portugal. They incurred high costs of the structural maladjustment of economies to the common currency area created by more developed countries. The effects of the crisis seriously damaged the image of the euro area as a group of countries in which the game of economic and political interests of countries prevail over the pursuit of greater economic and social cohesion as well as the improvement of the governance model of the common currency area. A noticeable change in the public perception of this situation was a significant drop in support for the introduction of the common currency in Poland. As a result, the interest of the national authorities in conducting a consistent policy aimed at abrogating the derogation concerning the accession to the third stage of EMU also decreased. There was also a polarization of positions on this issue among politicians and economists from academia and business. Taking into account the problems with maintaining the macroeconomic equilibrium in the euro area, the problems that have occurred in the global dimension and the growing economic and political uncertainty, as well as the EU strategy leading to the strengthening of the position of the common currency in the grouping’s territory, it is worth asking two questions: Has Poland already reached such a stage in economic development that ensures the realization of the benefits of belonging to the monetary union and has the 16-year membership in the EU favored the adjustment of the economy to the conditions of functioning in the monetary union? What are the biggest threats that may increase the costs of adopting the common currency? Such questions are justified by the economic outcomes of Poland: high and sustained long-term economic growth and increase in labor productivity, TFP and exports.
Purpose and Research Method
The aim of the paper is to assess the adjustment process of the Polish economy in terms of the pace of reducing the development and technological gap with regard to ensuring the benefits of adopting the euro. The starting point for the implementation of the research objective is the assessment of Poland’s economic position in relation to the euro area and its selected countries. A more detailed approach to the research goal is expressed in research questions: What are the strengths of the Polish economy? In what areas is there the greatest risk of negative effects of giving up the national currency? The analysis of the process of adjustment of Poland’s economy to the euro adoption and the level of convergence achieved within the EU is confronted with the experiences of Spain and Portugal. More broadly, the analysis of Poland’s economic performance covers two groups of countries: catching up and highly developed. The first group includes: Poland, Slovakia, Spain and Portugal, while the second are the hard core countries: Austria, Germany, France and the Netherlands.
In the assessment of Poland’s adjustment process to the adoption of the euro and its economic position in relation to the euro area and selected countries, the following average periodic indicators were used: growth/decline of GDP, labor productivity, employment, investment, unit labor costs, TFP, unemployment, exports, inflation and changes in general government net lending, balances on current accounts, public debt in relation to GDP and measures of convergence (GDP per capita according to purchasing power parity EA = 100). The analysis of the indicators was carried out with the distinction of three 6-year periods: 2002-2007 (relatively good economic situation), 2008-2013 (recession-stagnant), and 2014-2019 (post-crisis recovery). The analysis is based on data obtained from the following databases: Ameco, Eurostat, OECD, The Conference Board and UNCTAD.
Preconditions of potential benefits of participating in the monetary union – theoretical introduction
The significance of exchange rates as the price of money and an adjustment mechanism in the process of restoring current account equilibrium gained importance with the development of international trade and the growing trade openness of countries. In the 19th century, customs unions and monetary unions were aimed at eliminating trade barriers and reducing the risk of exchange rate volatility. The theory of market and monetary integration began to develop intensively from the 1960s, when the creation of the European Economic Community was a confirmation of the commitment of France, Germany, Italy, Belgium, the Netherlands and Luxembourg in building a common Europe. Initially, theorists of the economic integration focused their attention on the benefits of market integration. Pioneering contributions to the development of the integration theory were made at that time by B. Balassa (1962) and R. A. Mundell. The first of them presented the differences between the countries of the premises and the goals of integration, but above all defined the stages of the gradual advancement of integration, emphasizing the legitimacy of sequentially achieving higher and higher stages. In 1973, in the conference materials, B. Balassa presented his position on the monetary union, claiming that in the common European market, the appropriate exchange rates should be crawling pegs, but the ultimate goal – the monetary union (Balassa 1973).
The author who initiated the most important discussion to date on the monetary union, known as the Optimum Currency Area (OCA) concept, was R. A. Mundell. He considered the optimum currency area to be a region whose borders are determined by the internal mobility of production factors (labor and capital) and the lack of external mobility (Mundell, 1961). The second pioneer of the OCA concept was P. B. Kenen and he did not agree with the criteria defining the limits of OCA presented by R. A. Mundell. He recognized that the optimal currency area can be created by countries diversified in terms of production and exports, but at the same time similar in terms of economic structures (Kenen, 1969). Diversification of production and exports mitigates asymmetric shocks, as the fall in demand also varies depending on the spheres of the economy and product groups. Small countries with specialized economies are most exposed to asymmetric shocks. In contrast, the similarity of the structures of the monetary union’s economies is important from the point of view of the possibility of unifying economic policies, but it is also treated as a criterion of the achieved level of economic development.
The third pioneer of the traditional OCA concept is R. I. McKinnon (1963). He considered trade openness to be the most important criterion for creating an optimal currency area due to the large impact of world prices on domestic prices, also as a result of changes in exchange rates. He argued that the monetary union and fixed exchange rates had the potential to stabilize prices. However, in conditions of low openness, floating rates are a more effective mechanism for achieving equilibrium.
In conclusion, it is worth noting that: 1) the traditional concept of OCA was created in the 1960s and originated from the Keynesian economy, 2) its authors focused on defining such OCA criteria that would reduce the costs of abandoning the economic policy instrument and the external equilibrium mechanism, which is the exchange rate, 3) the OCA concept was developed during the functioning of the monetary system established in Bretton Woods, that was based on fixed exchange rates and the dollar – losing its purchasing power since the beginning of the 1960s, which resulted in an increased interest in the discussion on methods of limiting currency risk in international transactions, 4) traditional OCA concepts remained theoretical assumptions without the possibility of empirical verification.
The evolution of the monetary union theory, including the OCA concept, was influenced by: 1) changes in the situation in the world economy, 2) changes in the rules of the international monetary system, 3) destabilization of currency relations in the world, and 4) the acceleration of monetary integration in the EEC after the presentation and adoption for the implementation of the Werner plan (economic and monetary union, 1970/71). In 1971-1973, the dollar-gold system collapsed. The transition of most countries to floating exchange rates (1973) brought about a fundamental change in the conditions of international trade due to the increased exchange rate risk and price competitive advantage. The destabilization of monetary relations was deepened by energy crises and rising inflation. After the abolition of the golden dollar parity, the EEC established its own European Unit of Account (1975) based on a basket of the currencies of nine member countries. Changing the rules of functioning of the international monetary system, the effects of introducing floating exchange rates, high inflation and manipulation of exchange rates in order to increase the competitiveness of exports by the Member States of the Community threatened the development of mutual trade (Mucha-Leszko, 2007, p. 49). In the ensuing situation, the priority was to stabilize monetary relations of the Community. The plan to establish its own zone of currency stability was negotiated and prepared in the second half of the 70s. It was justified by three basic factors (Swann, 2000, p. 209): 1) The general lack of acceptance of floating exchange rates after the collapse of the Breton Woods system, 2) The favorable impact of fixed exchange rates on cross-border business activity, allowing for real calculation of costs and income from exports in the national currency, 3) The destabilizing impact of fluctuations in exchange rates, including, especially, the US dollar, on the real economy. As a result of decisive actions inspired by France, in agreement with Germany, in 1979, the European Monetary System (European Bretton Woods) was introduced in the EEC. In addition to the above-mentioned factors, the evolution of the concept of optimum currency area was influenced by the decline in the importance of Keynesian economics in favor of neoclassical economics.
P. Mongelli calls the 70s the period of reconciliation in the development of the OCA concept (Mongelli, 2002, p. 11-14). The benefits and costs of joining the monetary union continued to be analyzed and assessed. The number of OCA criteria increased, the scope and degree of trade and investment ties between countries were taken into account, as well as the comparability of inflation. The research was deepened by estimating the benefits and costs of joining the monetary union as a whole and for individual countries. The largest contributions to the scientific achievements regarding the OCA concept were made in the 1970s by: Corden, Mundell, Ishiyama, and Tower and Willet. In 1973, R. A. Mundell revised his views on the monetary union, treating it as a way to limit the manipulation of exchange rates in trade policy and as an opportunity to create a currency reserve pooling that could absorb asymmetric external shocks (Verde, 2009, p. 113). W. M. Corden (1972) considered the possibilities of absorbing demand shocks which countries may experience after joining the monetary union, when the real exchange rate rises and causes a decrease in export competitiveness. He came to the conclusion that the most effective mechanism for restoring external equilibrium is price and wage flexibility (Mongelli, 2002, p. 12). I. Ishiyama (1975) argued that every country interested in functioning in a monetary union should estimate the benefits and costs from the point of view of its economic goals, taking into account the consequences resulting from conducting the welfare state policy. He also pointed out that optimum currency areas are at risk if one criterion is used as the justification for their creation. I. Ishiyama, like W. M. Corden, attached great importance to the comparability of inflation rates between countries aspiring to OCA. This was understandable because after the price-stable 1960s, inflation in many countries was double-digit and geographically diverse. The development of the OCA theory in the 1960s and 1970s did not increase the interest in empirical research in this field, and the need for it was noticed by E. Tower and T. Willet (1976) (Mongelli, 2002, p. 12).
After the second energy and economic crisis (1979-1982), monetary relations in Europe began to stabilize. The anti-inflation policy imposed by Germany within the European Monetary System contributed to the decline in inflation and the stabilization of exchange rates (from the mid-1980s). Currency stabilization in the world was much slower. The international monetary system, based on floating exchange rates and key currencies, did not ensure the effectiveness of the foreign exchange market adjustment mechanism. The expanding international financial market and the US monetary policy had an increasing influence on exchange rate movements. Current account imbalances required the coordination of monetary policies to prevent the growing diversification of benefits from international trade (Mucha-Leszko and Twarowska, 2016). Despite problems with stabilizing currency relations in the global dimension, fluctuations in the exchange rates of the largest economies in the 1980s were smaller than in the previous decade. Due to the reduction of currency risk, the interest of economic theorists in the OCA concept decreased.
A decisive revival of discussions and research on the monetary union took place together with the presentation of an alternative approach to the OCA concept in the publication of the European Commission (Commission of the European Communities, 1990). It was fundamentally different from the real OCA criteria. The authors of the new concept of the monetary union considered the nominal economic criteria determining the stability thresholds of prices, public finances and exchange rates for the EMU candidate countries as sufficient to create a common currency area. The countries’ qualification for Stage III of the EMU took place under the conditions of sharp discussions between France and Germany regarding the introduction of the single currency in the economically weaker southern EU countries, which clearly formed a separate area, peripheral in relation to the countries constituting a coherent economic group of the EMU’s hard core (Germany, Belgium, the Netherlands, France and Luxembourg). Political considerations prevailed and the euro area, established on 1 January 1999, included 11 countries. Theoretical achievements concerning the criteria which should be met in order to reap the benefits of the common currency, including higher economic efficiency, were not of great importance. Moreover, the authors of the OCA concept formulated warnings that there is a risk of asymmetric shocks and economic problems in a monetary union that does not meet the OCA criteria (e.g. Mundell, 1961, Haberler, 1970, Fleming, 1971). Examples of countries that did not meet the OCA criteria and adopted the euro were, among others, Portugal and Greece. Their economies were the most structurally unadjusted to the economies of core countries. Portugal joined the EMU with a large development gap expressed in low labor productivity (about 1/3 of that in Germany), a large share of traditional industries in the economy, and low competitiveness of exports based on labor-intensive products. Moreover, as late as 1995, Portugal did not meet any of the EMU criteria laid down in the Maastricht Treaty. This goal was achieved as a result of an intensive anti-inflationary policy and budget savings, and thanks to general government revenues from the privatization of state-owned enterprises (Mucha-Leszko and Kąkol, 2011).
In connection with the arrangements made on the implementation of the EMU at the meetings of the European Council in Strasbourg (December 8-9, 1989) and in Rome (October 27-29, 1990), nominal criteria were agreed upon to define the boundaries of the common currency area. They have been narrowed down to the stability of prices, exchange rates and public finances. These findings sparked an increased interest in research into potential countries that could create an EMU in light of the OCA criteria. The authors of this type of empirical analyses examined the degree of homogeneity of the potential currency area and identified groups of countries within the EMU in terms of similarities in the characteristics of economies. T. Bayoumi and B. Eichengreen (1992, pp. 34-36) investigated the correlation of demand and supply shocks between EU countries and compared the level of shock correlation between EU countries and US regions in 1963-1988. The obtained results showed: 1) greater idiosyncratic nature of demand shocks, 2) higher degree of correlation of demand shocks in the group of core EU countries, 3) larger fluctuations in demand and greater idiosyncratic nature of shocks in peripheral countries than in the EU’s hard core. In addition, the authors of these studies found a significant convergence in the scale and coherence of the demand shocks of Germany, France, Belgium, the Netherlands, Luxembourg and Denmark with the US regions. T. Bayoumi and B. Eichengreen (1996, 1997) and many other authors tested the economies of the EU countries in terms of meeting the OCA criteria (Artis, 2002; Jager and Hafner, 2013). The examination of the economic homogeneity of the common currency area and OCA properties, which accelerates adjustment processes in the event of asymmetric shocks (price and wage flexibility, labor mobility, financial market integration and financial transfers), was and is of fundamental importance in the conducted analyses. Whereas, from the point of view of the risk level of asymmetric shocks, the following are essential: GDP per capita, GDP growth rate, level of labor productivity, unit labor costs, similar economic structures, trade openness, degree of specialization, and intraregional trade. All studies conducted to assess the fulfillment of the OCA criteria by candidate countries to the EMU, and those already operating in the euro area, showed: 1) The differentiation of countries in terms of GDP per capita, labor productivity and economic structures, 2) The impact of this differentiation of economies on reducing the effectiveness of adjustment mechanisms and on increasing the sensitivity to asymmetric shocks.
There is a conviction that the idea of European economic integration is still based on the endogeneity hypothesis, which was a real breakthrough in the discussion on the OCA criteria after it was presented by J. Frankel and A. Rose (1998). According to their position, the single currency contributes to the rise in the intensity of trade, and the growing economic interdependence results in an increasing synchronization of business cycles. As a consequence of these processes, the pace of convergence within the common currency area is enhancing and the OCA criteria can be met ex post. The 2008-2009 financial and economic crisis, the prolonged economic stagnation (until 2014) and the scale of the crisis of public finances led to deepening the divergence processes in the euro area (Mucha-Leszko, 2016). The hypothesis about the endogeneity of the OCA criteria did not defend itself, but contributed to the revival of the discussion on strengthening the governance of the euro area by means of monetary, fiscal and budgetary policy instruments. It is about strengthening the macroeconomic stabilization function. Symmetric shocks also destabilize the economies of the monetary union, so a common euro area budget could be used to mitigate cyclical fluctuations (Rosati, 2020). Moreover, symmetric shocks may cause asymmetric effects resulting from the structural maladjustment of economies. For many years, P. De Grauwe has been among the advocates of the common budget of the euro area and the political union. He lists three basic elements of a political union (De Grauwe, 2009, pp. 24-26): 1) the federal budget, 2) institutionalization of the coordination of policy instruments influencing the macroeconomic situation, 3) increasing the responsibility of the EU institutions for macroeconomic decisions, including the ECB. R. Baldwin and Ch. Wyplosz are also supporters of fiscal transfers, i.e. mutual compensation of the effects of asymmetric shocks in the EMU. They believe that the only solution is to accept the community and eliminate nationalist attitudes (Baldwin and Wyplosz, 2009, pp. 337-340). The existing controversies in the literature regarding the OCA theory in the context of the functioning of the EMU focus on the problems of the scope of the institutionalization of macroeconomic policy at the EU level (banking union and fiscal union) (Kąkol, 2017), which may ensure higher efficiency of adjustment mechanisms and acceleration of real convergence.
Does Poland meet the criterion of real economic convergence with the euro area?
Long-term economic growth in Poland continued for almost three decades (1992-2019). As a result, the development gap in relation to the countries of Western Europe, which increased in the 1980s, narrowed significantly. The pace of the economic convergence process significantly accelerated with the accession of Poland to the European Union. At that time, the following factors had the greatest impact on the growth rate of the Polish economy: an increase in capital expenditure, labor productivity, investment in industry and infrastructure investment financed from aid funds. Domestic demand was also stimulated by cheap loans. The rise in GDP was also influenced by foreign direct investment, which in 2004-2019, ranged from 4.8% to 1.7% of GDP, except for 2013, when it amounted to 0.5% of GDP (Table 6). In order to evaluate the results of Poland’s economic convergence process, tables 1-5 present the most important economic indicators with the division into three six-year periods (2002-2007), (2008-2013) and (2014-2019). This division is expected to show different convergence outcomes and their sources. In the case of Poland, such a division is of particular importance because the effects of the convergence process measured by the increase in GDP per capita in relation to the EA-19 average were the highest in the recession-stagnation period and reached 11 pp. But in the six years before the crisis, Poland’s economic gap narrowed only by 6 pp (and by the same amount of 6 pp in 2014-2019). This means that in the period of crises and weak economic situation in Europe and in the world, the Polish economy not only remained on the path of the economic growth, but also achieved a 3% increase in GDP (annual average), while in the euro area, there was a decline of 0.2% of GDP.
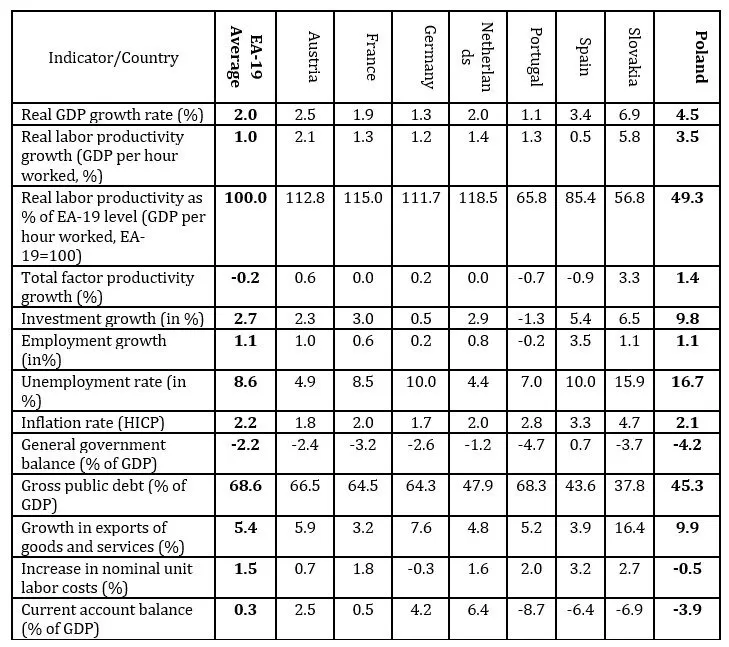
Table 1: Main economic indicators of Poland and selected Euro Area countries, annual averages in 2002-2007
Source: Own elaboration and calculations based on: Ameco (2020), Eurostat (2020), OECD (2020), and The Conference Board (2020).
The pace of the convergence process was lower in 2002-2007, as the GDP growth rate in all surveyed countries was positive, but varied considerably; the highest was in Slovakia (6.9%), and Poland was second with an average annual result of 4.5%. The average annual GDP growth rates in Portugal (1.1%) and Germany (1.3%) were significantly below the average for EA-19 (2.0%). The main sources of Poland’s economic growth in 2002-2007 were: an increase in investment (9.8%), labor productivity (3.5%) and exports of goods and services (9.9%). It is also worth paying attention to the increase in TFP, i.e. the total factor productivity (1.4%), which proved the reduction of the technological gap in Poland. Nevertheless, Slovakia achieved a higher pace of convergence; its GDP per capita increased by 13 pp against the EA-19 average, while Poland’s result was 7 pp (Table 4). Among the remaining countries, the rise in GDP per capita compared to the EA-19 average was obtained by: Spain (6 pp), the Netherlands (2 pp), Austria (1 pp), Portugal (1 pp). Germany did not change its position, but France lost 4 pp. In summary, regarding the effects of the process of Poland’s convergence within the European Union and the adjustment of the economy to functioning in the common currency area, it should be noted that in comparison to Slovakia, Poland’s results in 2002-2007 were modest. The main sources of the high dynamics of the Slovak economy were: foreign direct investment (in relation to GDP) which was much greater than in Poland, and the exceptionally high growth of exports (16.4% on average annually), as well as a greater increase in labor productivity and TFP (5.8% and 3.3%) (Table 1). Slovakia decided to introduce the euro as early as 2009, i.e. in conditions of a deep recession. The advantage of Slovakia over Poland also consisted in a greater reduction of the gap in terms of the level of labor productivity in relation to the EA=100, which in 2007, accounted for 63.3% of the euro area average, while in the case of Poland, it was 51.4% (Table 5). Labor productivity is the basis of competitive advantage in trade and its low level increases the risk of violating the external balance after adopting the common currency. This was especially experienced by the peripheral countries, although their imports declined in the recessionary period and, consequently, the current account deficit decreased.
As was emphasized, Poland’s great success in the crisis years 2008-2013 was due to the sustained economic growth and high dynamics of convergence. Poland’s GDP per capita in 2013 increased to 62% of the average GDP in EA-19, i.e. by 11 pp. In Slovakia, the dynamics of economic convergence decreased and amounted to 6 pp, but the GDP per capita level achieved indicated an improvement in Slovakia’s economic position in the euro area. It was already 72% of EA-19’s GDP. In other countries, the losses of GDP varied in individual years, and overall, their economic positions in the euro area shifted throughout the six-year period. Austria and Germany were characterized by an increase in positions measured in GDP per capita. Both countries enlarged their advantage in relation to the average GDP per capita in EA-19 by 8 pp, and France by 3 pp (Table 4). The Netherlands suffered major losses during the crises and its economic advantage weakened by 4 pp. But the greatest losses in the analyzed group of countries, as well as a significant weakening of the economic position and destabilization of public finances, affected Spain. The divergence process in terms of GDP per capita in 2008-2013 was as much as 10 pp, and in Portugal, 2 pp.
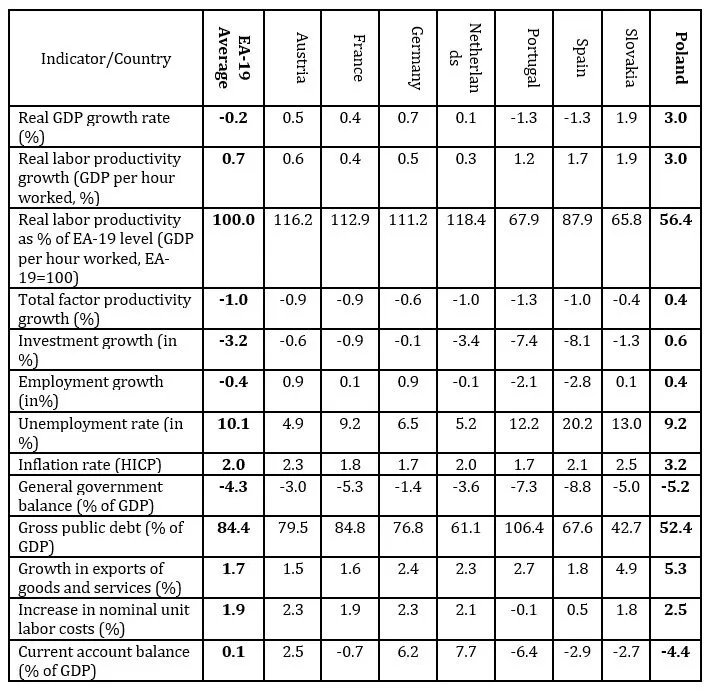
Table 2: Main economic indicators of Poland and selected Euro Area countries, annual averages in 2008 – 2013
Source: Own elaboration and calculations based on: Ameco (2020), Eurostat (2020), OECD (2020), and The Conference Board (2020).
The high resilience of the Polish economy to shocks in the conditions of the global recession and the decline in GDP across the EU in 2009 by over 4% increase the weight of its 3% (average annual) GDP growth in 2008-2013 as compared to a decline of 0.2% in EA-19. Compared to Poland, the GDP growth was significantly lower in Slovakia (1.9%). The several factors had a positive effect on the economic growth in Poland: an increase in labor productivity, investment, TFP, employment and exports. When developing the issue of the sources of the economic growth, it is worth emphasizing that the main factor creating domestic demand in Poland was public investment related to the need to use EU funds. Unemployment dropped significantly compared to the previous period, and the remaining macroeconomic indicators did not signal any serious imbalances (Table 2). Apart from the above-mentioned factors, the positive impact on the dynamics of the Polish economy had a low real exchange rate and low unit labor costs, which increased the competitiveness of exports and, consequently, the GDP growth rate (OECD 2014, p. 18). The inflow of FDI in relation to GDP (annual average) decreased from 3.35% to 2.17%, but it was stable, except for 2013 (0.5%) (Table 6). Foreign direct investment (annual average) in Slovakia decreased from 10.55% in 2002-2007 to 2.18% of GDP in 2008-2013 and ranged from 5.5% to – 0.6% of GDP. The data show that the reduced FDI could have caused a slight decline in the GDP growth rate in Poland. However, it had a major impact on the decrease in the GDP growth rate in Slovakia. Summing up, Poland’s macroeconomic results in 2008-2013 provided positive evidence of potential opportunities to reduce the development gap. Nevertheless, the positive assessment of the adjustment process should also take into account the level of labor productivity in relation to the EA-19 average, and in this respect, Poland did not catch up with Slovakia. In 2013, these indicators were as follows: labor productivity in Poland accounted for 59.1% of EA level (EA-19 = 100), and in Slovakia 67.8% (Table 5). Considering all the analyzed indicators, it can be stated that in 2008-2013, Poland reached the contact level of economic homogeneity with the euro area.
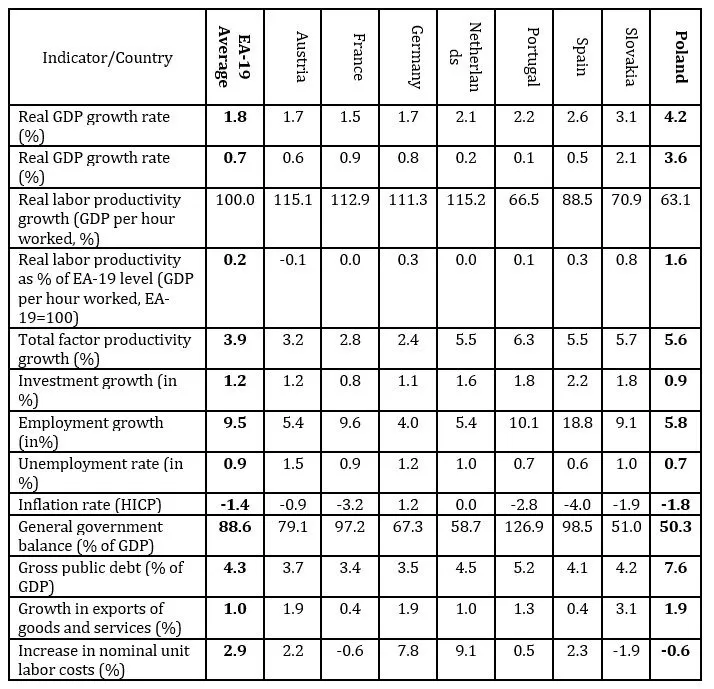
Table 3: Main economic indicators of Poland and selected Euro Area countries, annual averages in 2014-2019
Source: Own elaboration and calculations based on: Ameco (2020), Eurostat (2020), OECD (2020), and The Conference Board (2020).
The third stage of the analysis of the process of convergence of the Polish economy with the euro area was marked by a fundamental change in the EU’s economic situation. From 2014, a sustained recovery began, spreading to all EU countries. Until 2019, in the group of countries studied, Poland maintained the highest average annual GDP growth rate, which was more than twice as high as the SE-19 average and amounted to 4.2%. The main factors of economic growth in Poland included: labor productivity, TFP, investment and especially exports of goods and services. It is also worth emphasizing
the increase in the inflow of FDI, which on annual average, amounted to 2.5% of GDP and proved stable. In Slovakia, the FDI inflow continued to decline and in 2014-2019, it decreased to 1.35% of GDP on average annually. Thus, Poland was a greater beneficiary of the inward FDI than Slovakia. The aforementioned factors made Poland the best result in the process of economic convergence. GDP per capita increased in relation to the average EA-19 from 63% to 69%, in Spain from 84% to 86%, and in Portugal from 72% to 74%. In the Netherlands, Austria, Germany and Slovakia, divergence was recorded, while France’s GDP per capita remained at the level of the average GDP per capita of EA-19. The efficiency convergence, measured by the increase in labor productivity in relation to EA-19 = 100, can also be considered a great achievement of Poland – a rise from 59.4% to 68.6%. In Slovakia, the increase in the level of labor productivity in relation to the average SE-19 was 4.7 pp (from 68.6% to 73.3%). In the other countries surveyed, changes in this respect were slight or almost none. To sum up, in a subsequent period, Poland significantly narrowed the economic gap in relation to the average macroeconomic indicators which characterize the entire euro area.
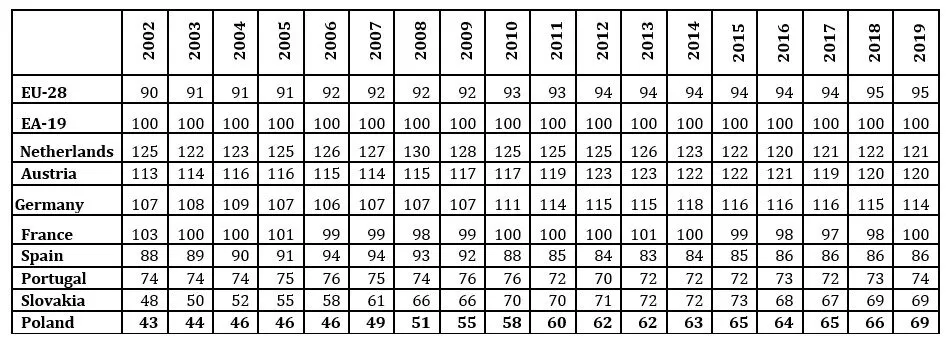
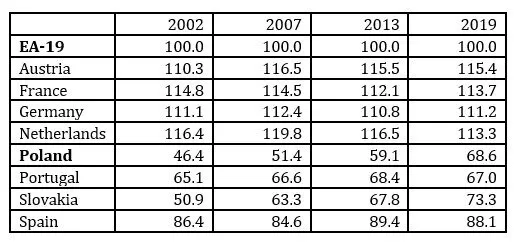
Table 4: The convergence process: GDP per capita in purchasing power parity (EA-19 = 100) in 2002-2019
(countries ordered by value in 2019)
Source: Own calculations based on: Eurostat (2020).
Table 5: Real labor productivity as % of EA-19 level (GDP per hour worked, EA-19=100)* in 2002, 2007, 2013 and 2019
Note:*GDP per hour worked in US dollars, constatnt prices, 2015 PPS.
Source: Own elaboration and calculations based on: OECD (2020).
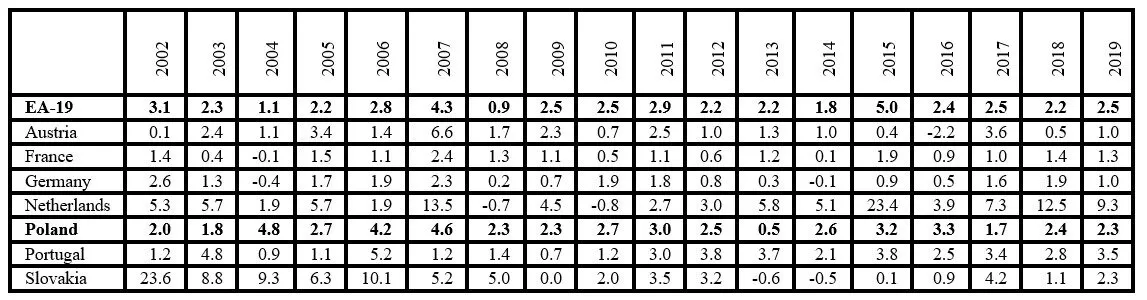
Table 6: Inward foreign direct investment as % of GDP
Source: Own elaboration based on: UNCTAD (2020).
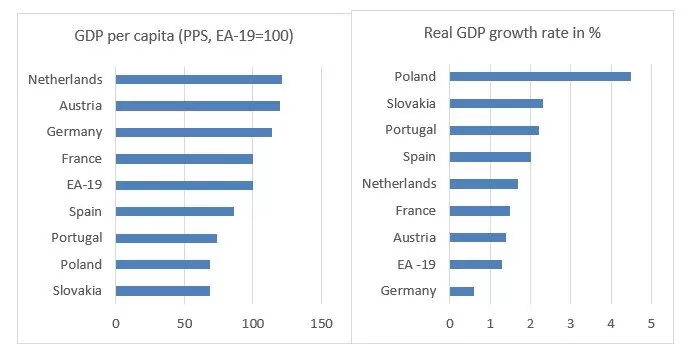
The analysis conducted is supplemented with a graphic presentation of macroeconomic indicators illustrating the level and dynamics of GDP growth and labor productivity in the surveyed countries in 2019 (fig. 1 and 2). These figures facilitate the assessment of the position and economic effectiveness of peripheral countries, including Poland, vis-à-vis the selected, most important countries of the group that forms the hard core of the EMU. But most of all, they illustrate the dimension of economic heterogeneity in the euro area – income (GDP per capita) and productivity gaps. From the point of view of the OCA theory, this is a major barrier limiting the benefits of introducing the common currency.
Fig. 1: GDP per capita (as % of EA-19 level) and real GDP growth rate (in %) in 2019
Source: Own elaboration based on: Table 4 and Eurostat (2020).
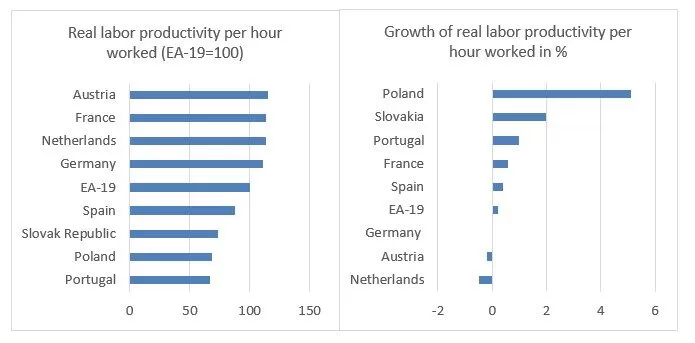
Fig. 2: Real labor productivity per hour worked (as % of EA-19 level) and growth of real labor productivity
per hour worked (in %) in 2019
Source: Own elaboration based on: Eurostat (2020) and OECD (2020).
When assessing the studied group of countries in terms of the homogeneity criterion, it should be stated that there is a large spread of GDP per capita from 69% of the EA-19 average in Slovakia and Poland to 121-120% in Netherlands and Austria. The dispersion of GDP growth rates is at first glance high, if they are evaluated on
the basis of the spread of the rates between Poland (4.5%) and Germany (0.6%). After eliminating the extreme values, the differentiation of the growth rates is only 1 pp. The scale of differentiation in labor productivity is close to GDP per capita: from 67.0% of the EA-19 average in Portugal to 115.4 in Austria. Labor productivity growth rates indicate a great potential for narrowing the gap between the core area and peripheral countries, especially in Poland (5.1%). The analysis of the level and rates of growth in labor productivity is important as it determines the competitive advantage in the monetary union and, as a result, the distribution of benefits from mutual trade, and it also affects the current account balance and economic growth.
Conclusion
The study sought answers to research questions concerning: 1) The appraisal of the results of the adjustment process conditioning the achievement of benefits from the adoption of the common currency; 2) The assessment of a 16-year membership in the EU in terms of creating favorable conditions for dynamizing the process of economic convergence; 3) The indication of the greatest threats that may result from the introduction of the euro; 4) The identification of the strengths of the Polish economy and the areas of the greatest risk of the consequences of giving up the national currency. Responding to the questions, it should be emphasized that the euro area does not meet the OCA criteria to a greater extent after the 2008+ crises than in the first years of its functioning. The effects of financial-economic and public finance crises were greater in the peripheral countries, and they deepened the economic divergence. The experiences of Spain, Portugal and especially Greece constitute a serious warning of how risky the introduction of the common currency can be in economies that are characterized by a development gap: low GDP per capita, low labor productivity and trade competitiveness, and a large share in the economies of traditional sectors. The results of the analysis, the purpose of which was to assess the process of convergence of the Polish economy against the background of selected countries, indicate that Poland has achieved the catching up effect. Its GDP per capita as a percentage of the EA-19 average increased in the period considered from 43% to 69%, and in Slovakia from 48% to 69%.
Considering the high economic dynamics of Poland and the fundamental reduction of the gap in terms of labor productivity, it should be noted that in 2002-2007, the possibilities of catching up were not fully used. The advantage of the Polish economy is its high dynamics, large internal market and export growth, as well as the ability to adapt in conditions of deterioration of the economic situation. Having macroeconomic policy instruments at the national level and the mechanism of a nominal exchange rate facilitate the achievement of economic goals. Despite the undoubted achievements in the process of catching up with the economically developed countries, Poland does not yet meet the criterion of real convergence with the euro area. Therefore, by resigning from its own currency, it could experience economic shocks, the greatest risk of which is the decline in competitive advantage and exports, and consequently in economic dynamics. Observing the economic problems of Spain, Portugal and Slovakia since the 2008+ crisis, one should be concerned.
Artis, M. J. (2002), ‘Reflections on the Optimal Currency Area (OCA) Criteria in the Light of EMU,’Central Bank of Chile Working Papers, 193, Diciembre.
Balassa, B. (1973), Monetary Integration in the European Common Market, Europe and the Evolution of the International Monetary System, Svoboda, A. K. (ed), W. Sijthoff, Leiden.
Balassa, B. (1962) The Theory of Economic Integration,George Allen & Urwin LTD, London.
Baldwin, R. and Wyplosz, Ch. (2009) The Economics of European Integration, The McGraw-Hill Education, London.
Bayoumi, T. and Eichengreen, B. (1996), ‘Operationalizing the theory of Optimal Currency Areas,’CEPR Discussion Papers, 1484.
Bayoumi, T. and Eichengreen, B. (1997), ‘Ever closer to heaven? An Optimum-currency-area index for European countries,’European Economic Review, 41,761-770, https://doi.org/10.1016/S0014-2921(97)00035-4.
Bayoumi, T. and Eichengreen, B. (1992),‘Shocking Aspects of European Monetary Unification,’NBER Working Paper Series, 3949.
Commission of the European Communities (1990), ‘One Market One Money. An Evolution of the Potential Benefits and Costs of Forming Economic and Monetary Union,’European Economy, 44.
De Grauwe, P. (2009), Some Thoughts on Monetary and Political Union, The Future of EMU, Talani, L.S. (ed), Palgrave Macmillan, London, 9-28.
Eurostat (2020), Eurostat database. [Online], [Retrieved November 3, 2020], http://ec.europa.eu/eurostat/data/database.
Frankel, J. and Rose, A. (1998), ‘The endogeneity of the optimum currency area criteria,’Economic Journal, 108 (449),1009-1025.
Haberler, G. (1970), The International Monetary System and Discussion, Approaches to Greater Flexbility Rates, Halm G. N. (ed), Princeton University Press, Princeton.
Fleming,J. M. (1971), ‘On Exchange Rate Unification,’Economic Journal, 81(323), 467-488.
Ishiyama, I. (1975), ‘The Theory of Optimum Currency Areas: A Survey,’Staff Papers International Monetary Fund,22, 344-383.
Jager, J. and Hafner, K. A. (2013), ‘The Optimum Currency Area Theory and the EMU,’Intereconomics: Review of European Economic Policy, 48 (5), 315-322, https://doi.org/10.1007/s10272-013-0474-7.
Kąkol, M. (2017), ‘Designing a Fiscal Union for the Euro Area,’ Ekonomia i Prawo. Economics and Law, 16 (4). 413-432, http://dx.doi.org/10.12775/EiP.2017.029.
Kenen, P.B. (1969),The Optimum Currency Area: An Eclectic View, Monetary Problems of the International Economy, Mundell, R.A. and Svoboda, A.K. (eds),University of Chicago Press, Chicago, 41-60.
McKinnon, R. I. (1963), ‘Optimum Currency Areas,’American Economic Review, 53 (4), 717-725.
Mongelli, F. P. (2002), ‘”New” Views on the Optimum Currency Area Theory: What is EMU Telling Us?’ European Central Bank Working Paper,138, April.
Mucha-Leszko, B. and Kąkol, M. (2011), ‘Portugalia w unii walutowej – problemy gospodarcze i kryzys finansów publicznych,’ Ekonomista, 4, 601-624.
Mucha-Leszko, B. (2016), ‘Przyczyny słabego ożywienia koniunktury gospodarczej w strefie euro w świetle hipotezy o nowej sekularnej stagnacji,’Prace Naukowe Uniwersytetu Ekonomicznego we Wrocławiu, 449, 437-449, DOI: 15611/pn.2016.449.39.
Mucha-Leszko, B. and Twarowska, K. (2016),‘Czynniki i skutki destabilizacji kursów walutowych po upadku systemu walutowego z Bretton Woods,’Studia Ekonomiczne. Zeszyty Naukowe Uniwersytetu Ekonomicznego w Katowicach, 266, 49-60.
Mundell, R. A. (1961), ‘A Theory of Optimum Currency Areas,’ The American Economic Review, 51 (4), September, 657-665.
OECD (2020), Productivity Database. [Online], [Retrieved November 10, 2020], http://stats.oecd.org.
Rosati, D. (2020), Wspólny budżet dla strefy euro, Polska w Unii Europejskiej – od stowarzyszenia do piętnastolecia członkostwa. Monografia jubileuszowa dedykowana profesor Elżbiecie Kaweckiej-Wyrzykowskiej, Ambroziak, A.A. and Szypulewska, A.D. (eds), SGH Oficyna Wydawnicza, pp. 353-364.
Swann, D. (2000) The Economics of Europe. From Common Market to European Union, Ninth Edition, Penguin Books.
The Conference Board (2020), The Conference Board Total Economy Database™ (Original version), July 2020. [Online], [Retrieved November 5, 2020], https://conference-board.org.
UNCTAD (2020), UnctadStat database. [Online], [Retrieved November 12, 2020], https://unctadstat.unctad.org/en/Exploration.html.
Verde, A. (2009), In and out of monetary unions: lessons from and risk for the EMU. An alternative approach to monetary unions, The Future of EMU,Talani, L.S. (ed.), Palgrave Macmillan, London, 110-143.