The Bucharest University of Economic Studies, The Bucharest University of Economic Studies, Bucharest, Romania
Volume 2021,
Article ID 743573,
Journal of Eastern Europe Research in Business and Economics,
13 pages,
DOI: 10.5171/2021.743573
Received date: 2 November 2020; Accepted date: 10 February 2021; Published date: 8 July 2021
Academic Editor: Carmen-Elena Dobrotă
Cite this Article as:
Andreea MURARU (2021)," Emigration and Tolerance: Does Preserving Connections Help Enhance Social Tolerance in Romania?", Journal of Eastern Europe Research in Business and Economics Vol. 2021 (2021), Article ID 743573, DOI: 10.5171/2021.743573
By using World Value Survey data, I investigated whether emigration contributed to raising the level of social tolerance in Romania. In investigating this hypothesis, I used two waves of survey data for building a social tolerance index and analyzing it in relation to country specific questions on migration (having or not friends or relatives who live abroad and the frequency of communicating with them). I also took into account the influence of specific demographic variables (age, education, residence – urban vs. rural) and thus investigated the incremental effect of migration variables beyond that of the traditional factors. The results from multinomial logistic regressions show that there is an increased probability of having a higher tolerance level for persons who have friends or relatives living abroad with whom they talk, the reverse being also valid – higher chances of being less tolerant for individuals who do not have friends or relatives who have emigrated. Furthermore, rare communication increases the probability of lower tolerance levels, while average frequency communication significantly increases the probability of high tolerance levels. The impact of frequent contact is not clear-cut, as high frequency communication does not seem to be always significant in the multinomial logistic regression. Nevertheless, when significant it offers an interesting view on the importance of strong connectivity on 2018 data, suggesting that it supports average levels of tolerance. Association analysis confirms the results of logistic regression.
Keywords: Migration, Social Tolerance, Multinomial Logistic Regression, Association Analysis
Introduction and Literature Review
Migration has produced profound social, demographic and economic change in Romania. The massive migration flows, which led to an increase in emigration by more than 200 percent in the past 15 years, adding up to 3.4 million Romanians residing abroad, made Romania have the fifth largest emigrant population in all OECD countries. According to the same OECD report, 75 percent in the decrease of Romania’s population in the period 2000-2018 can be attributable to migration (OECD, 2019).
Besides the financial connections, visible through monetary remittances (impressive sums at global level, $689 billion USD in 2018, according to World Bank data), there is a complex system of other transfers that illustrate the fact that migrants remain connected to their native countries: communication and life plans (Sandu, 2010). Migrants are also involved in what is called social remittances. Peggy Levitt coined the concept of social remittances in 1998 as representing “ideas, behaviors, identities, and social capital that flow from receiving- to sending-country communities” (Levitt, 1998). The scholarship on social migration focuses either on the phenomenon in general (e.g., Levitt, 2001, Levitt & Lamba-Nieves, 2011, Levitt & Merry, 2009, for Romania see for e.g., Anghel & Coșciug, 2017, Anghel, 2009, Horváth, 2009) or on different sides of it – political remittances (e.g., Jaulin, 2016, Chauvet & Mercier 2014), gender roles, human rights and so on. There are also studies that show that there is a strong connection between economic and social remittances (for e.g., Vari-Lavoisier, 2016).
This study, as it tries to identify the importance of migration in promoting social tolerance, is subsumed to the literature on social remittances. The starting hypothesis is that migrants, by exposure to a different society, with different culture and social norms, go through a process of modeling their initial set of values. Afterwards, through a complex mechanism, the newly acquired set of values might be transferred to their home country (the sending society). Starting from a finding of White (2016), I would say that especially in the Eastern Bloc, remittances in their social form might also shape the way towards “normality” – a feature that for the former communist countries was only to be found in the foreign western countries –, in terms of values, tolerance and openness.
Even though the literature on the socioeconomic impact of migration in Romania is relatively abundant from an anthropological and sociological point of view (see for e.g., Anghel & Coșciug (2017), Horvat (2009), Anglet et al. (2016), Sandu (2010)), there is a very limited number of papers that use a quantitative approach to social remittances in Romania. One quantitative study is that of Nikolova et al. (2015), in which the authors investigate if civic engagement of the staying population of Bulgaria and Romania is different, whether they have or not relatives and friends living abroad. They use Gallup World Poll data and through regression analysis, logit and propensity score matching, find that having family and friends abroad is positively associated with pro-social behavior (donating, volunteering, and helping strangers). Another study is that mentioned in Sandu (2010), who uses data from a survey on temporary migration taken in 2006 and also tests for the change in tolerance towards ethnic and religious minorities.
Nevertheless, the picture of Romanian migration changed drastically in the last decade and this study, by using a different survey-based quantitative approach, comes to enrich the picture on the social (tolerance) remittances in Romania. Furthermore, this study centers on social tolerance as an indicator built from the World Value Survey. Building social tolerance from this kind of data can also be found in Kirchner et al. (2011) and Dunn et al. (2009). In these two studies, the authors define tolerance as: “non-negative orientation toward groups outside of one’s own” (Dunn et al. 2009) and “the willingness to tolerate or accept persons or certain groups as well as their underlying values and behavior by means of co-existence (even if they are completely different from one’s own)” (Kirchner et al. 2011). However, there are also studies that argue that this kind of approach, because of the way in which the questions in the survey are formulated, includes prejudice in the definition of tolerance (Hjerm et al., 2019).
The paper is structured as follows: the next section describes the data and the methodological approach; section 3 presents the main findings and the last section concludes the paper.
Data Sources and Methodology
The data sources for this article are the last two waves of the World Values Survey (WVS-7 which was completed in Romania in 2018, and WVS- 6 which was applied in Romania in 2012). For Romania, the survey is organized by the Research Institute for Quality of Life and the results are made public by the Romanian Group for The Study of Social Values on their website.
The main questionnaire of The World Value Survey includes a question, common for all countries, referring to social tolerance: “On this list are various groups of people. Could you please mention any that you would not like to have as neighbors?”. The groups mentioned are: drug addicts, people of a different race, people who have AIDS, immigrants/foreign workers, homosexuals, people of different religion, heavy drinkers, unmarried couples living together, people who speak a different language. Following Kirchner et al. (2011), I built the social tolerance index for Romania as an additive index on only 7 of the 9 categories as drug addicts and heavy drinkers are generally less tolerated groups and would have affected the results.
Besides this section of the WVS, I also used the country specific items referring to migration, specifically whether the respondent has relatives or friends living abroad (“Among the friends and relatives with whom you talk, are there persons who live or have lived abroad for at least one month?”) and also the section referring to how frequently people communicate with their acquaintances from abroad (“How often do you get in contact with friends/relatives from that country? 1. Daily; 2. Weekly; 3. 2-3 times a month; 4. Monthly; 5. 2-3 times a month; 6. 1-2 times a year; 7. Even rarer). To my knowledge, the World Value Survey is a unique source for this kind of migration data for Romania.
For studying the influence of migration on tolerance levels, I used multinomial regression analysis and association analysis. For applying these methods, I had to recode both the social tolerance variable and the communication frequency variable. I have transformed them in 3-level variables for the ease of interpretation. For the social tolerance the three levels are:
(i) low degree of tolerance, people who had a maximum score of 2 from the total of 7 tolerance elements,
(ii) medium tolerance – a score between 3 and 5, and
(iii) high tolerance – individuals with a score of 6 and 7 on the social tolerance scale.
For some analyses, I also needed a binary form of the tolerance variable, therefore I have recoded it in more likely to be more tolerant (values 5, 6 and 7 form the social tolerance index), and more likely to be less tolerant (values 0,1,2,3 and 4 form the social tolerance index).
As concerns the communication frequency variable, the three levels that I have built are:
(i) frequently – for the persons who discussed at least 2-3 times per month;
(ii) average – for the persons who communicate on a monthly basis or at least once at 2-3 months, and
(iii) rarely – for individuals who only communicate once or twice a year or even less.
In the last category I also included the persons who did not have friends or relatives living abroad so as not to lose their impact on the low tolerance level.
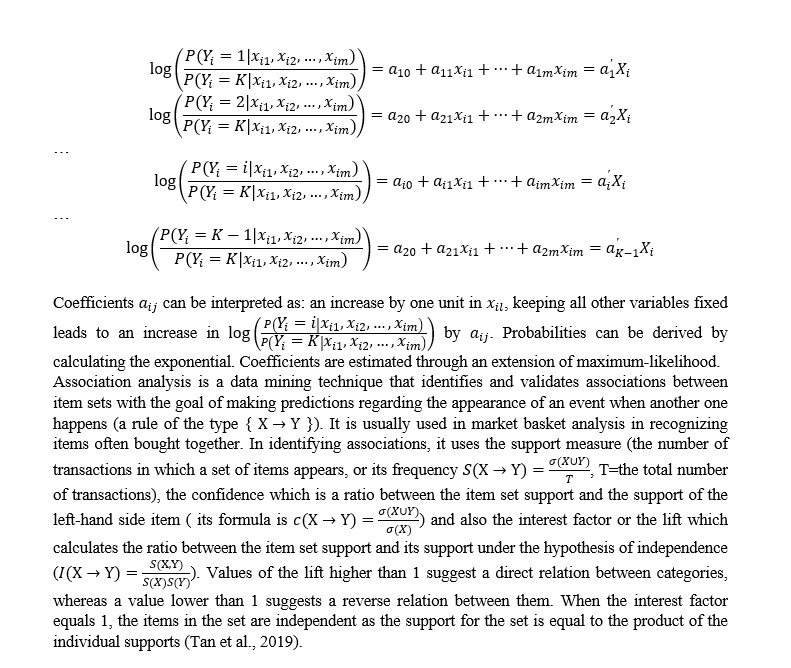
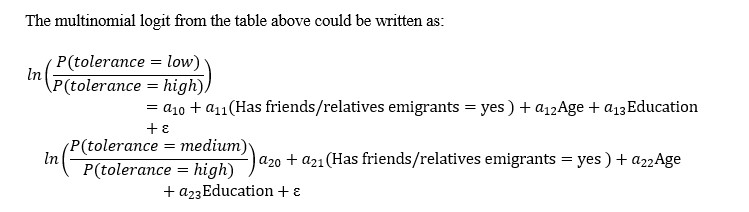
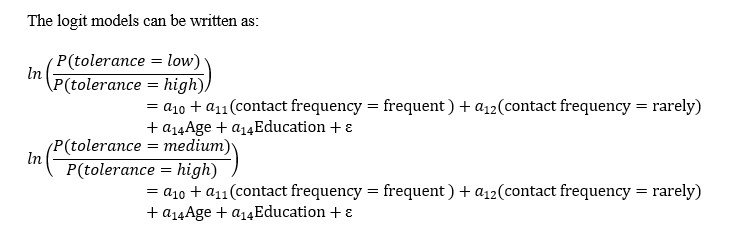
Multinomial logistic regression is an extension of the binary logistic regression for a multiclass dependent variable. Given K classes of the Y variable, the multinomial logistic regression can be written as K-1 logits of the form:
Results
The importance of variables for classification
In order to establish a ranking of variables in terms of their relevance in classifying a person as rather more tolerant than intolerant, I used decision trees, a tool highly versatile in classification analysis and perfectly fit for categorical and ordered variables.
In order to perform this analysis, I used the binary recoded social tolerance variable presented in the data section above (with value “yes” for tolerance index higher or equal to 5, out of the maximum 7, and value “no” for tolerance below or equal to 4). I have tested the importance of traditional demographic variables (education, age, gender, residence area- urban vs. rural)) together with the migration variables in classifying individuals as rather more tolerant or rather more intolerant. Therefore, I estimated two models: one with the binary migration variable – having or not friends or relatives abroad – and one with the three-level communication frequency variable (built as specified in the data section).
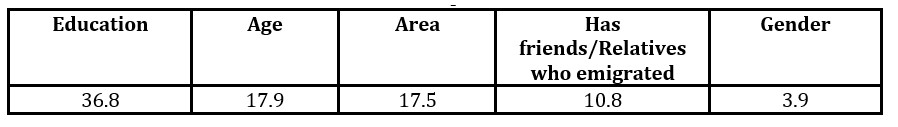
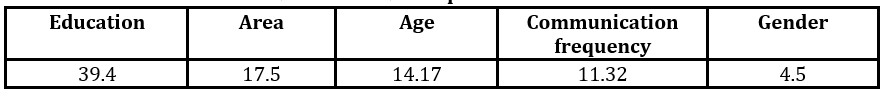
As can be seen below, the importance of the gender variable was very low (Table 1 and Table 2 below), not being a very relevant variable in discriminating between the two classes of tolerance, therefore its inclusion in the multinomial logistic regression as explanatory variable would be unnecessary.
Table 1: Variable importance – model 1
Table 2: Variable importance – model 2
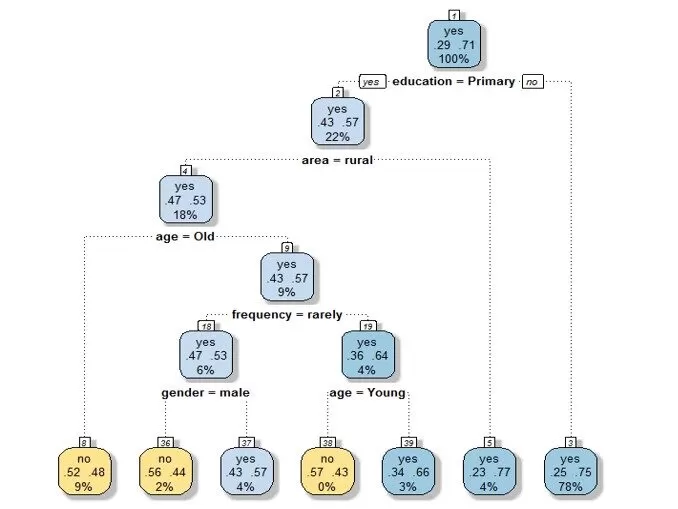
The decision tree for the second model can be seen in Fig. 1 below. In interpreting the tree, going to the left means the yes answer to the category mentioned in the node, and the right is the no answer (e.g., if education is not primary, take right and reach the blue node corresponding to tolerance=yes, meaning more likely to be tolerant than intolerant; 78% of cases are in this node, with a probability of being assigned to this class of 0.75).
Fig.1: Decision tree
The most important variables among the selected demographic characteristics are, as expected, education, age and whether respondents live in urban or rural area. Young, above average educated individuals living in urban areas are usually associated with a higher openness, tolerance and trust in democratic values.
Results Form the Multinomial Logistic Regression
The next step was to build a multinomial logistic regression model, in which the dependent variable was the three-scale social tolerance index (low degree of tolerance, people with minimum score of 2 out of the 7 tolerance elements, medium tolerance, people with a score between 3 and 5, and high tolerance – individuals with a score of 6 and 7).
I estimated the multinomial logistic regression model on both waves of the survey 2012 and 2018 to compare results. As explanatory variables, I used: education, age, area (for the place of residence) and alternatively the two variables for identifying the potential impact of migration (the binary variable showing whether the individual has or not a friend or relative living abroad and the three-level variable, quantifying the frequency of contact, built as shown in the data section).
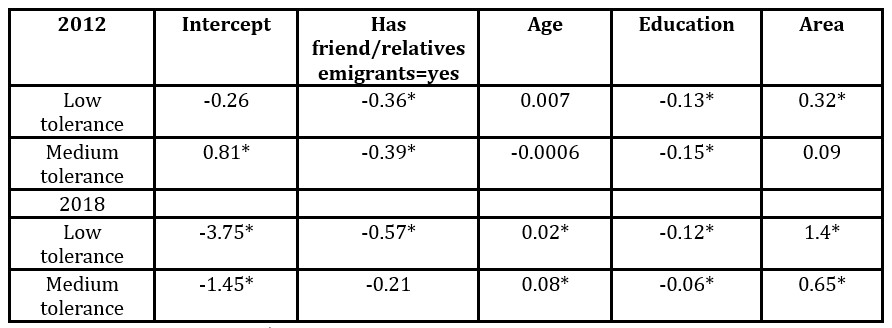
Table 3: Results from multinomial logistic regression – model 1
*=statistical significance at 0.05; **=statistical significance at 0.10.
The coefficients show the contribution of the variables to the log-probabilities, or log-odds for having low tolerance vs. high tolerance.
Therefore, as can be seen from Table 3 above, in 2012, the coefficient means that switching from the pivot category (the one not mentioned in the table) has friends/relatives emigrants=no to category has friends/relatives emigrants=yes (the category mentioned in the table) decreases the log-odds of having low tolerance versus high tolerance by 0.36 (increasing therefore the probability for the high tolerance group).
At the same time, when looking at the second logit, for the category tolerance=medium, the coefficient shows that when switching from not having relatives or friends living abroad to having, the log odds of being moderately tolerant vs. highly tolerant decreases by 0.39. The age coefficient is not statistically significant, showing that an increase by one year in the age of the respondent does not necessarily modify its level of social tolerance. As age is significant in terms of classification, I would say the explanation for this is that the impact of age, at least for this survey year, is seeable from the perspective of age groups (young vs. middle-aged vs. senior).
In 2018, there is a change in the magnitude of coefficients. The log-odds of having a low tolerance level vs. high tolerance, when switching between the group of people who do not have friends or relatives who live abroad to the group that has, decreases to -0.57. Nevertheless, the log-odds of having medium tolerance vs. high tolerance when moving between the two categories of the binary migration variable becomes insignificant. Moreover, age becomes significant, showing maybe that the young generation in the six years between the two surveys is more likely to be highly tolerant because of globalization and cosmopolitanism.
The education coefficient is at all times negative, showing that the higher the education level, the most likely it is for the respondent to have higher tolerance (an increase by one in the education level, reduces the log-odds of belonging to a less tolerant group vs. the highest tolerant group). Also, the area coefficient is positive at all times and therefore shows that moving from rural to urban area increases the log-odds of having a high level of tolerance comparative with low and medium.
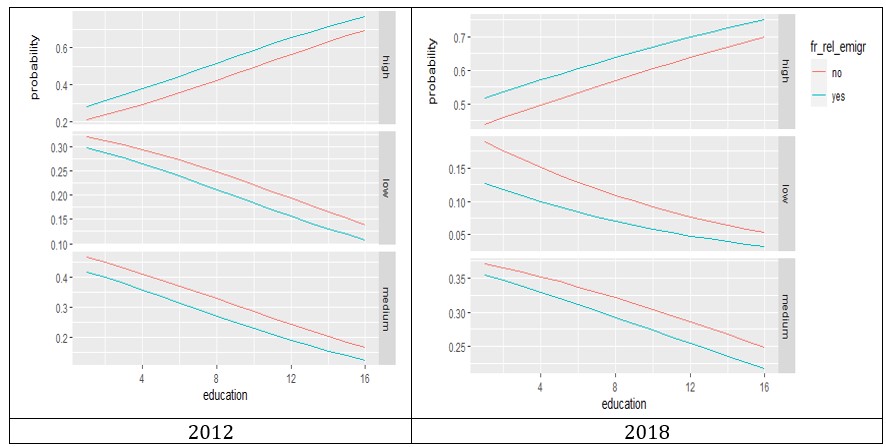
The results from the table above are more easily interpreted in terms of exponential of coefficient and are more visually appealing when represented graphically. The figures below graphically synthesize the results of the multinomial logistic regression in two instances: the impact of having or not friends and relatives living abroad relative to education (when holding age equal to its sample average) and relative to age (when holding education equal to its sample average). In both scenarios, the area was also considered fixed.
As can be seen from Fig. 2, having friends or relatives who emigrated increases the probability of being highly tolerant by about 10 percentage points, while not having these kinds of acquaintances increases the odds of being less tolerant (by about 5 percent in 2012, and decreasing from 5 to about 2.5 percent for the low tolerance class in 2018). Therefore, the direction of the impact is similar in both 2012 and 2018, but there are some differences regarding the level of probability associated to low and medium tolerance classes, which could show that during the 6 years between the two surveys there was a natural change towards higher tolerance.
Fig. 2: Impact of binary migration variable relative to education
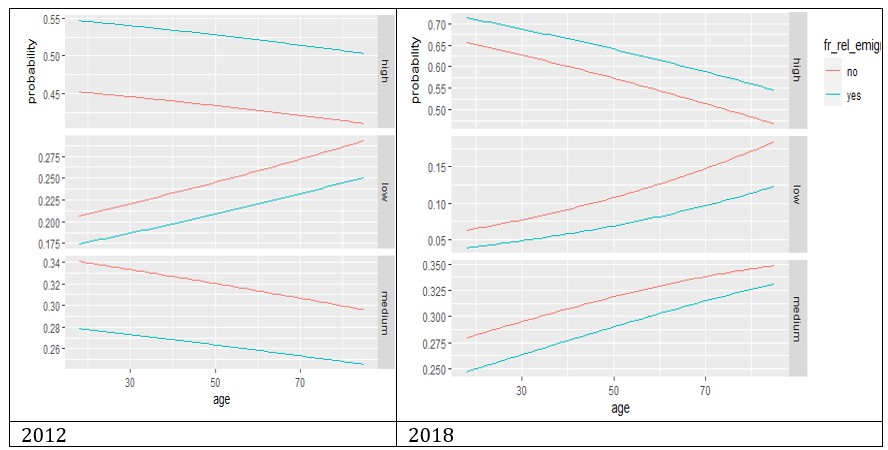
Similar conclusion regarding the impact of having or not friends and relatives living abroad can be drawn from Fig 3 below. We can see from the graph that there is a higher likelihood of being highly tolerant for individuals who have acquaintances abroad and increased chances of being more intolerant if these connections with emigrants are absent. As in the graph before, there are also some differences between the two survey years, more pronounced on the age reference graph because, as it was seen from the analysis of the logit coefficients, the coefficient for age was not statistically significant in 2012.
Fig. 3: Impact of binary migration variable relative to age
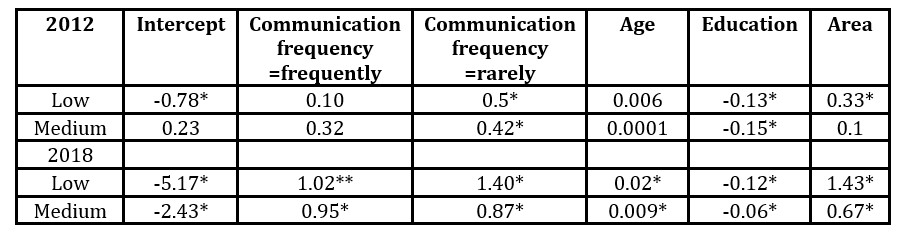
The second model I investigated used the three-scale variable for communication frequency. The results of the model can be seen in Table 4 below
Table 4: Results from multinomial logistic regression – model 2
Analyzing the coefficients in Table 4 above, we can see that we lose significance in the variables of interest. The coefficients for contact frequency=frequent are not statistically significant, for the year 2012, while for 2018, they show that when passing from average connectivity to frequent, there is a higher log-probability of having a lower tolerance level. This is a hypothesis that might suggest that higher contact with the home country acts as an enforcer of the tolerance level specific to the sending society, and thus leads to a lower level of tolerance acquisition by the migrant, and consequently no potential for high tolerance diffusion. The coefficients for contact frequency=rarely are significant all the time, showing that when passing from average contact frequency (the pivot category not mentioned in the table) to rare contact, there is an increase in the log-probability of having a low level of tolerance relative to high tolerance. The same is valid for the log-probability of belonging to the medium tolerance class relative to high when moving from average contact to rare contact (in 2012, in 2018 this coefficient is no longer significant). Like in the previous specification frame, age is not statistically significant in 2012 and becomes significant in 2018, showing an increase in log-probability of belonging to the lesser tolerant groups relative to the high tolerance ones when age increases by one year, and education is significant at all times showing a direct connection between education and tolerance. Significant are also the coefficients for the area and, as in the previous case, show a direct connection between living in the urban area a higher degree of social tolerance.
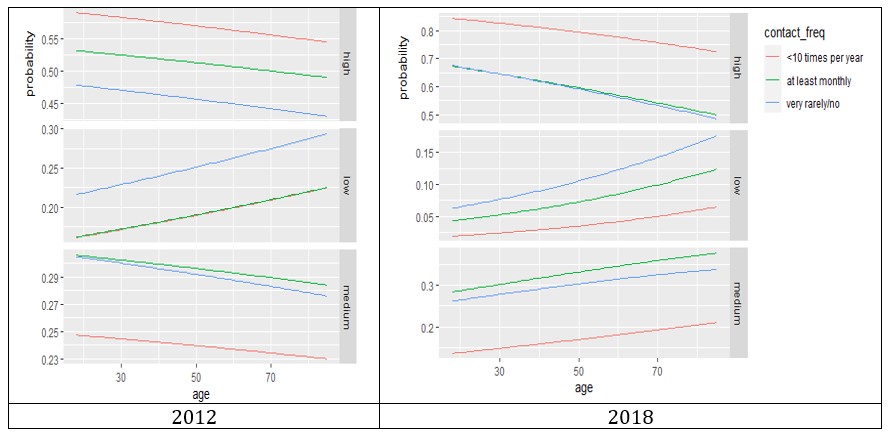
Graphically, we can see that the contact of average frequency with friends and relatives living abroad leads to an increase in the probability of being highly tolerant, while a rare contact increases the odds of having a medium and low tolerance level. The influence of frequent contact in those graphs must be interpreted with caution, as in 2012 the variable proved not to be statistically significant.
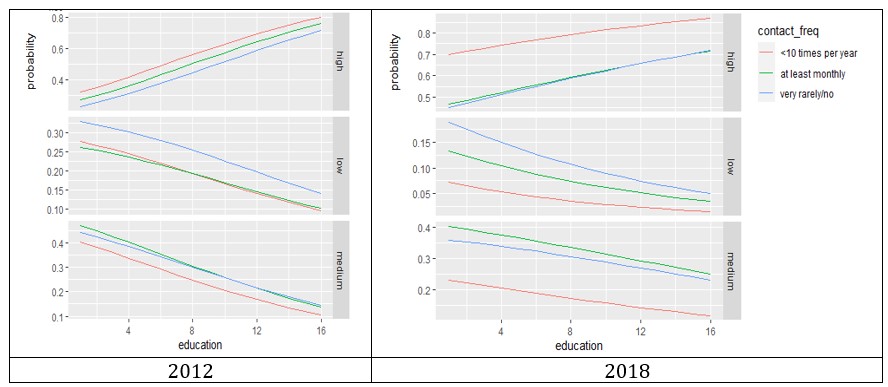
Fig. 4: Impact of communication frequency relative to education
The same conclusions can be drawn from the figure below, which shows the impact of the frequency of contact with the friends and relatives who live abroad while holding education to its average level. As in the previous case, the average frequency contact increases the probability of belonging to the high tolerance group and decreases the odds for the medium and low tolerance groups.
Fig. 5: Impact of communication frequency relative to age
Results form Association analysis
For building association rules, I used the social tolerance index in binary form (coded as Yes for more likely to be tolerant, and the value No for less likely to be tolerant, as described in the data section).
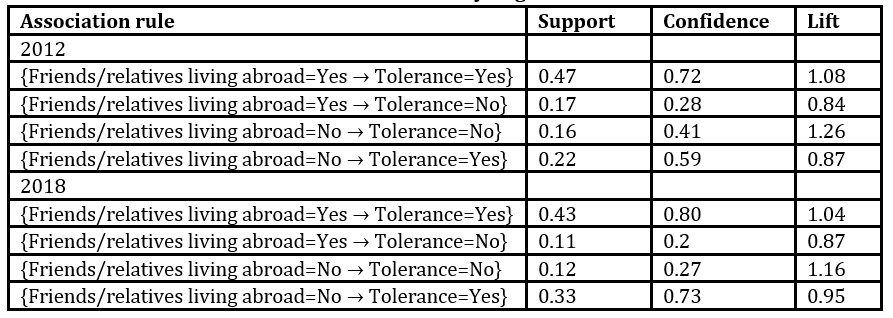
In investigating the association between having or not friends and relatives who live abroad and being more or less tolerant, I extracted all the 4 yes-yes, yes-no, no-yes and no-no rules. The analysis of the association rules offers similar results for both survey waves.
As can be seen from Table 5 below, the yes-yes, and no-no rules have a positive level for the lift, showing a direct association between the categories: individuals who have friends and relatives living abroad usually are more tolerant (a confidence level of 0.72, showing that 72 percent of the persons who have emigrants as acquaintances have an above average tolerance level). In the no-no case, the confidence level is much lower but it is compensated by a much larger lift, showing a somewhat more important direct connection between the two. In the case of no-yes, yes-no rules, the lift is smaller than unit, showing that there is an important inverse connection between the categories.
Table 5: Association rules between binary migration variable and tolerance
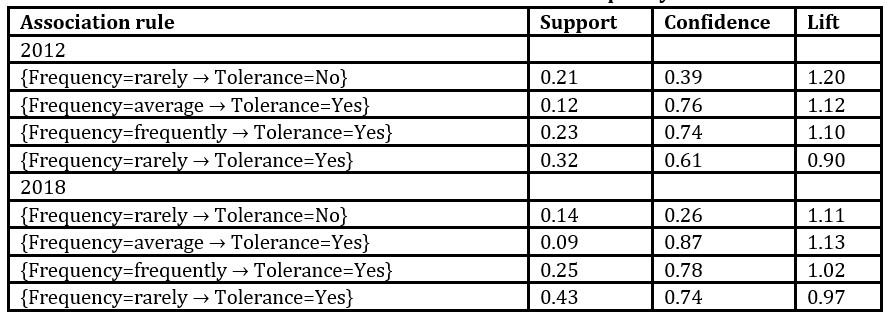
When looking at the association rules between the communication frequency and the binary tolerance index (Table 6 below), we can see that the rules between average communication frequency and tolerance=yes as well as between frequent communication and tolerance=yes have high confidence levels (above 0.7 in all cases) and lift values higher than one which confirms, in almost all cases, the positive relation between the two (with exception of the lift very close to 1 in 2018 for the association rule {Frequency=frequently → Tolerance=Yes}, sign of independence). Also, the association between the rare frequency of communication and the below average level of tolerance is sustained by a 1.2/1.1 lift level in 2012/2018. As its confidence value was low, I also investigated the association rule between {Frequency=rarely → Tolerance=Yes}, and as can be seen from the table below, even though its confidence level is high, the lift is below unit showing a reverse relation between the two.
Table 6. Association rules between communication frequency and tolerance
Conclusions
In this study, I investigated whether preserving connections with the sending community (the origin population of migrants) leads to enhancing social tolerance in the home country. In doing this, I used survey data form two waves of the World Value Survey for Romania and applied quantitative analysis techniques.
As the analyses showed, migration has an incremental effect on tolerance level, beyond that of the traditional factors (out of which the most important impact comes from education). The multinomial logistic regression illustrated that there is a significant increase in the probability of having a higher level of social tolerance for persons who have friends and relatives who live or have lived abroad for at least one month and with whom they speak. The results also indicate that the lack of such connections leads to an increase in the probability of being less tolerant, beyond the influence of education, age and place of residence.
The frequency of communication proves to be an important potentiating factor of tolerance especially when it comes to average vs. rare communication: average communication leading to higher chances of being highly tolerant. At the same time, rare or absent communication with migrants undoubtedly acts towards increasing the probability of having low levels of tolerance. The coefficient for frequent communication in the multinomial logistic regression framework did not prove to be significant in 2012. In 2018, these coefficients suggest that frequent communication acts towards increasing the probability of medium tolerance levels, and towards degreasing the probability of high tolerance levels. This seems to suggest the interesting hypothesis that the higher contact with the home community might enforce the level of migrants’ tolerance existent prior to the migratory act, and therefore the acquisition or development of higher levels of tolerance is somewhat impeded, thus the impossibility of diffusing tolerance levels beyond average in the sending communities. Nevertheless, the results show that frequent communication also acts towards decreasing the probability of having low tolerance levels.
Results from the association analysis confirm the existence of a direct connection between migration and tolerance: persons who know and are in contact with emigrants are associated with a higher level of tolerance.
This study can be enhanced by adding supplementary variables regarding the recipient countries for the migrants, as they can influence their value system, and through a regional analysis on the social tolerance level for the staying population as well as further details regarding the importance of frequent contact.
Acknowledgment
This paper was written during my Ameropa Fellowship at the New Europe College Institute for Advanced Study, Romania.
Anghel, R. G., Coșciug A. (2017), Socioeconomic effects of migration: Patterns, mechanisms and effects of return migration to Romania,RCCMS Working Paper Series.
Anghel, R., G. (2009), Schimbare socială sau dezvoltare? Studiu de caz într-un oras din România [Social change or development? Case study on a Romanian town], in Sociologia migrației. Teorii și studii de caz românești [The sociology of migration. Theories and Romanian case studies], Remus Gabriel Anghel, István Horváth (eds.), Polirom, Iași, pp.249-267.
Anghel, R., G., Botezat, A. Coșciug, A., Manafi, I., Roman, M., (2016), International Migration, Return Migration, and their Effects: A Comprehensive Review on the Romanian Case, IZA Discussion Papers, 2016.
Chauvet, L., and Mercier, M. (2014), Do return migrants transfer political norms to their origin country? Evidence from Mali, Paris: Dauphine University.
Dunn, K. P., and Singh, S. P. (2011), The surprising non-impact of radical right-wing populist party representation on public tolerance of minorities, Journal of Elections, Public Opinion and Parties,21(3), 313–331.
Hjerm, M., Eger, M.A., Bohman, A., Connolly F. F., (2019), A new approach to the study of tolerance: conceptualizing and measuring acceptance, respect and appreciation of difference, Social Indicatiors Research 147, 897–919, https://doi.org/10.1007/s11205-019-02176-y
Horváth, I. (2009), Aspecte ale culturii migrației în România [Aspects of migration culture in Romania], in Sociologia migrației. Teorii și studii de caz românești [The sociology of migration. Theories and Romanian case studies], Remus Gabriel Anghel, István Horváth (eds.), Polirom, Iași, pp.156-175.
Kirchner, A., Freitag, M., and Rapp, C. (2011), Crafting tolerance: The role of political institutions in a comparative perspective, European Political Science Review,3(2), 201–227.
Levitt, P. (1998), Social Remittances: Migration Driven Local-Level Forms of Cultural Diffusion, International Migration Review, 32(4), 926–948.
Levitt, P. (2001), The Transnational Villagers, Berkeley: University of California Press.
Levitt, P., & Lamba-Nieves, D. (2011), Social Remittances Revisited, Journal of Ethnic and Migration Studies, 37(1), pp. 1–22.
Levitt, P., & Merry, S. (2009), “Vernacularization on the ground: local uses of global women’s rights in Peru, China, India and the United States”, Global Networks, 9(4), pp. 441–461.
Nikolova, M., Roman, M., Zimmermann, K., F. (2016), Left Behind but Doing Good? Civic Engagement in Two Post-Socialist Countries, “Left Behind but Doing Good? Civic Engagement in Two Post-Socialist Countries”, Journal of Comparative Economics, 2016.
OECD (2019), Talent Abroad: A Review of Romanian Emigrants.
Sandu, D. (2010), Lumile sociale ale migrației românești în strainătate, Iași: Polirom.
Tan, P.-N., Steinbach, M., Karpatne, A., Kumar,V., (2019), Introduction to Data Mining, 2nd Edition, Pearson Publishing.
Vari-Lavoisier, I., (2016),“The economic side of social remittances: how money and ideas circulate between Paris, Dakar, and New York”, Comparative Migration Studies, December 2106.
Vlase, I. (2013), ‘My Husband Is a Patriot!’: Gender and Romanian Family Return Migration from Italy, Journal of Ethnic and Migration Studies 39:5, pp. 741-758.
White, A., (2016), “An Inside-Out Approach to Social Remittances: Linking Migration and Social Change in Poland” in Migration and social remittances in a global Europe Nowicka M., Šerbedžij, V. (esd.), Palgrave Macmillan, pp. 49-70.