Volume 2021,
Article ID 806834,
Journal of Eastern Europe Research in Business and Economics,
16 pages,
DOI: 10.5171/2021.806834
Received date: 4 September 2020; Accepted date: 21 January 2021; Published date: 26 February 2021
Academic Editor: Ingrid Majerova
Cite this Article as:
Bogumila MUCHA-LESZKO and Magdalena K. KAKOL (2021)," Poland's Catching-up Process in the European Union against the Background of Other Visegrad Countries", Journal of Eastern Europe Research in Business and Economics Vol. 2021 (2021), Article ID 806834, DOI: 10.5171/2021.806834
The aim of the assessment in the paper is to verify a hypothesis, constructed by theorists of international economics, that regional integration is an opportunity for the caching-up countries to accelerate growth as well as diminish the economic and technological gap.
Poland’s macroeconomic outcomes in terms of the dynamics of convergence were assessed on the basis of quantitative and efficiency indicators, such as: GDP growth rate, GDP per capita, changes in the level of labor productivity (in relation to the EU average), as well as on the basis of supply and demand factors contributing to GDP growth. Results of the empirical analysis, which encompassed both the pre-accession period and the European Union membership period of the V4 countries, confirmed that they had higher GDP growth rates compared with the EU-28 averages, however, the rates varied within the analysed group. The largest economic gap pertained to Poland and the dynamics of closing it was the highest in 2008-2019. The opportunities for Poland’s economic growth in the first half of the 1990s and in 2002-2007 were not fully exploited. Nevertheless, Poland had the highest capacity for economic growth during the recession – stagnation years (2008-2013) out of all EU members and was able to maintain high growth rates in 2014-2019. The major factors of Poland’s economic growth in the entire period of 2002-2019 included non-ICT capital contribution and increase in consumption demand. Only in Czechia a higher contribution of ICT capital to GDP growth allowed for a decrease in the technological gap. In the remaining V4 countries, non-ICT capital contribution to the GDP growth was also not conducive towards a significant technological modernisation of the economies.
Keywords: benefits from economic integration, economic convergence, GDP growth and its sources
Introduction
The Visegrad Group (Visegrád Four or simply V4) consists of Czechia, Poland, Slovakia and Hungary. During the post-war development of Central and Eastern Europe dominated by the Soviet Union, these four countries had the strongest economic ties. At the turn of the 1980s and 1990s, the institutional base of the system controlled by the USSR fell apart and the CEE countries turned towards closer cooperation with the Western European countries, which were undergoing final stages of liberalising the flow of merchandise, services, and factors of production. As a consequence, a disintegrated space was created in Europe which became in the centre of political interest of both the European Union and the United States. They expected that Western Europe would undertake steps encouraging closer economic ties with the CEE countries, which were already undergoing reforms leading to democratisation of their political systems and pro-market changes in the functioning of their economies.
The European Union authorities were uncertain about formulating a strategy that would define the rules and timeframe of integrating the post-socialist countries with the EU economy that reached an advanced stage of regional interdependence. For the first time, the Community was faced with a need to prepare a model of integration with a large group of countries (12) with a clear development gap even towards the economically weakest members (Spain, Portugal, Greece). There were more factors against another territorial enlargement of the European Communities.
Firstly, there was a considerable acceleration of the integration process within the 12 members of the European Community as a result of the Delors plan adoption (1989) and initiation of its realisation (introduction of the Economic and Monetary Union). The basis for the next, higher stage of integration was The Maastricht Treaty (1992). Coincidence in time between the introduction of the EMU and preparation of the EU for another enlargement was particularly difficult to reconcile even more since in the late 1980s the EFTA countries (European Free Trade Agreement)1 started negotiations to join the European Communities. Since 1990s, leaders of the EU were focused on overcoming challenges connected to the adoption of the common currency and were not ready to discuss institutional reforms required to significantly increase the number of member countries – by a dozen of new CEE members.
Secondly, intensification of globalization processes began in the 1990s, followed by a new wave of technological progress known as the ICT revolution. These phenomena impacted the acceleration of structural changes both in domestic economies as well as the world economy and led to the new international distribution of economic potential enhancing the global competition. Therefore, the European Union began tightening economic cooperation with CEE countries with extreme caution, focusing on trade liberalisation within the framework of association agreements known as Europe Agreements. First deals of this kind were signed with Czechoslovakia, Poland and Hungary on the 15th December 19912.
Aim And Research Method
The aim of the paper is to indicate the formal grounds and decisions of the European Union leading to Poland’s accession, to assess the effectiveness of the adjustment process determining the fulfillment of membership criteria, and to evaluate the process of reducing the development gap at the pre-accession stage and under the conditions of functioning in the EU in 2004-2019. Poland’s macroeconomic outcomes in terms of the dynamics of convergence were assessed on the basis of quantitative and efficiency indicators, such as: GDP growth rate, GDP per capita, changes in the level of labor productivity (in relation to the EU average), as well as on the basis of supply and demand factors contributing to GDP growth. The method of separate appraisal of supply and demand sources of GDP growth becomes increasingly useful in the conditions of low and declining economic growth in the EU. It is designed to better understand the reasons behind the diversity of countries in terms of their capacity to economic growth and tendency to weaken the convergence process.
The assessment of Poland’s economic dynamics in 2002-2019 was carried out with the distinction of three 6-year periods in order to obtain an answer regarding the diversity of Poland and other V4 countries (Czechia, Hungary, Slovakia) in terms of economic dynamics depending on the phase of business cycle and the results of economic convergence. In the long-term analysis, the following years were distinguished: 2002-2007 (relatively good economic conditions), 2008-2013 (recessive-stagnant), 2014-2019 (post-crisis recovery). Contribution of supply factors to the GDP growth includes: quantity of working hours, quality of labour, non-ICT capital, capital in the ICT sector and TFP growth. Demand factors illustrate the contribution of private and public consumption, investment and net exports. The aim of the empirical analysis is to answer the question: Does Poland properly use the opportunities of more dynamic growth arising from the accession to the EU and are the effects in reducing the economic gap satisfactory? The answer to this research question is formulated by confronting Poland’s economic growth and its sources with the results of other V4 countries. The analysis was based on the use of primary statistical data obtained from the databases of the European Commission (Ameco, Eurostat) and The Conference Board, as well as the results of research by other authors.
Benefits from Regional Economic Integration – Theoretical Introduction
Countries are interested in creating regional integration blocs in order to dynamise economic development and improve the efficiency of allocation and use of production factors. Various approaches and criteria are applied to assess the potential and real benefits that can be derived from integration. One can consider short-term, long-term, macroeconomic, sectoral, structural, microeconomic, social, civilization, political, cultural benefits etc. From the economic point of view, the most important are the sources of benefits leading to higher economic growth and improved efficiency of the use of production factors.
Contemporary theorists of international economic integration take advantage of the vast achievements, that were created in this field in the second half of the 20th century, and still remain the basis for assessing the effects of integration depending on the degree of its advancement. The starting point is the concept of B. Balassa (1961), who adopted – as the determining criterion – the following stages of integration: free trade zone, customs union, common market, economic union and full economic integration. The theoretical foundations of international integration developed in close connection with the advancement of economic ties within groups of countries. The greatest influence on the growing importance of the theory of regional integration in international economics resulted from reaching higher stages and pioneering experience in the field of integration in Europe.
In the beginning, theorists focused on the benefits of market integration, inter alia: J. Pekmans (2001), R. Baldwin and Ch. Wyplosz (2009), W. Molle (2006), B. Rosamond (2000), D. Swann (2000), P. Bożyk and J. Misala (2003), J. Ładyka (2001). The benefits of market integration are primarily analysed and assessed in two aspects: 1) sources of origin, 2) the effects of liberalisation of trade (goods and services) and flows of production factors (capital and labor). In the first case, the benefits are derived from the market size and the scale of production, the deepening division of labor, including the fragmentation of technological processes and specialization in economic activity, but also the increase in competition, its effects and competition protection policy. In the second case, the assessment encompasses: the effects of trade liberalisation, and liberalisation of capital and labor flows. The greatest threat to the participants of the internal market of integrated group of countries is the low competitive ability of economic entities from catching-up countries.
Protection of competition is an essential condition for achieving the goals of market integration, it is intended to eliminate less efficient producers and limit the expansion of national monopolies. Research in this area is focused on (Mucha-Leszko 2017, p. 77): 1) the functioning of market mechanism, with particular emphasis on changes in its structure, the behavior of market participants and the impact of market situation on economic efficiency at the micro- and macroeconomic levels, 2) the analysis of market-state relations justifying the desired scope of interference and state activity in order to remove the imperfections of the market mechanism and optimise the competition policy aimed at increasing economic efficiency. An advocate of controlling the “invisible hand of the market” was the influential Italian professor of economics T. Padoa-Schioppa, who participated in the preparation and implementation of integration plans (Ross 1995, p. 42).
The acceleration of market integration in the second half of the 1980s resulted in an increased interest and discussion on the benefits of monetary integration. This was justified by the desire to obtain greater benefits of the common market due to the introduction of the common currency. Liberalisation of capital flow contributed to the growth of its mobility. Sudden outflows and inflows of capital and changes in demand for currencies led to an increase in the frequency and extent of fluctuations in exchange rates. The destabilisation of the global foreign exchange market was an important argument for the supporters of the monetary union in convincing that the benefits of introducing the single currency would be even greater than those predicted by the authors of the optimum currency area theory (Commission of the European Communities 1990).
Representatives of neoclassical economics believe that a diversified economic development and income per capita result from differentiation of the accumulation rates of production factors and their declining productivity. An important addition to their method of proof stemmed from breaking down investment into real capital and human capital. Previously, the analysis was limited to investment in physical capital (Ben-David and Loewy 2003; Lucas Jr. 1988, p. 39). The usefulness of analyses of economic growth increased as a consequence of adding another important element, which is the productivity of production factors resulting from knowledge (human capital) and research and development activities accelerating technological progress (Romer 1990; Grossman and Helpman 1991; Siwiński 2005, p. 734–738). The works of R. Barro and X. Sala-i-Martin published in 1990–1992 constituted a breakthrough in the development of research on the processes of economic convergence, which inspired the introduction of new research methods based on econometric models and the development of concepts to better assess the results of convergence (Barro and Sala-i-Martin 1990, 1991, 1992). There were also proposals to measure different types of convergence. The most common subjects of research are beta and sigma convergence. The first (beta) is defined as the ability of countries at lower stages of development to achieve a higher rate of economic growth than highly developed countries. The dynamics of reducing the economic gap (catching-up) in relation to the more developed countries depends on the GDP growth rates. Sigma convergence is the result of beta convergence and occurs when the variation in GDP per capita between countries decreases and is measured by the standard deviation (Mucha-Leszko 2014, p. 18–19).
Diminishing the development gap depends on the strength of the influence of economic growth factors – labor input and labor productivity. Capital expenditure and the Total Factor Productivity (TFP) contribute to the increase in labor productivity. Potential abilities of achieving and maintaining a high pace of economic growth depend to a large extent on the economic policy of a country which influences the shaping of more or less favorable conditions for the inflow and use of foreign capital and technology in order to increase economic activity, create new demand and structural changes. The impact of foreign direct investment on GDP growth is multilateral and therefore their economic effects may accumulate as a result of a higher investment rate, economies of scale of production, the use of modern technologies and methods of work organisation and management, through spill-over effects derived from developing cooperation with local companies which under the pressure of competition become more innovative, and employees improve their qualifications (Mucha-Leszko 2014, p. 20).
The Polish “road” to the European Union – the formal grounds
Analysis of the contractual relations between Poland and the European Union points to the following documents and facts:
Europe Agreement establishing an association between the European Economic Communities and their Member States, of the one part, and Poland of the other part signed on the 16th of December 1991. The document entered into force in two stages. In order to accelerate the liberalisation of trade the part pertaining to that (Interim Agreement) entered into force on the 1st of March 1992, and the full application commenced on the 1st of February 1994.
Poland made a formal request for membership in the European Union on the 8th of April 1994.
European Council Summit in Copenhagen (June 1993) – for the first time the European Union officially confirmed that membership was the common goal for the countries that signed the association agreements as well as the EU. However, the statement in Copenhagen was much too general to satisfy the association countries which expected much more binding declaration from the EU.
European Commission began working on an integration strategy for the associated CEE countries in 1994. The first part was presented in July 1994 and contained details on the Copenhagen Summit final conclusions, and the second, in September, pertained to the institutional cooperation, harmonisation of law, competition policy and trade, macroeconomic and structural policy, policy in the major areas of the economy, regional and social policy including EU aid for integration and reforms (URM 1995, p. 34-48). Looking back, the European Council meeting in Essen in 1994 had the crucial impact on the process of Poland’s integration with the EU. The Council issued a report describing the strategy of preparations for the CEE countries to become members of the EU. The report was accepted by the European Council and included in the final documents of the Summit as Annex IV.
Other documents containing tasks for Poland and the other CEE countries in order to adjust their economies to the fulfillment of the EU membership criteria were created in 1995. During the Cannes European Council meeting in June, the EU leaders adopted the European Commission’s White Paper on the preparation of the associated CEE countries to integration with the Single Market of the European Union. In December 1995, during the Madrid Summit, the European Council tasked the European Commission with issuing an opinion on the membership applications. Thus, the formal process of the CEE countries accession to the EU was initiated.
In July 1995, the European Commission presented a positive assessment of Poland’s membership application (avis) and recommended initiation of the accession negotiations to the EU Ministerial Council. Apart from Poland, the first group qualified by the Commission for EU membership, meaning the readiest to fulfill EU membership criteria, included Cyprus, Czechia, Estonia, Hungary and Slovenia. In the Conclusion, Commission recommended initiating negotiations with Poland and the other countries in order to accept them as members of the Union (Komitet Integracji Europejskiej 1997a, p.102).
As a result of undertaking political and economic reforms as well as the process of negotiations, Czechia, Hungary, Poland and Slovakia together with Estonia, Latvia, Lithuania, Slovenia, Cyprus and Malta became members of the EU on the 1st of May 2004.
Assessment of the adjustment process and economic growth of Poland, Czechia, Hungary and Slovakia in the pre-accession period
Fulfillment of membership criteria by Poland and the other CEE countries required economic adjustments in three areas: 1) in respect of economic indicators, 2) structure of the economy, 3) rules of macroeconomic policy. Nevertheless, from the point of view of closing the development gap towards the EU countries and getting a positive evaluation of the economic adjustments, rather than the level of GDP, the more important factor was an upward trend in GDP growth, including GDP per capita. Hence, the National Strategy of Integration emphasised that “one of the most important factors contributing to the appraisal of Poland’s readiness for membership will be economic trends (capacity to balanced growth in the conditions of declining inflation and simultaneous liberalisation of access to the domestic market)” (Komitet Integracji Europejskiej 1997a, p.13).
Analyses of growth trends pointed to the losses in development suffered by Poland in 1978-1994, when the average annual per capita GDP growth was negative (-0.97%), while the rate in Western Europe ranged from 0.79% in Sweden to 2.06% in Spain. In Denmark, per capita GDP growth was 1.99% and in other European countries it ranged from 1.56% to 1.84% (in Belgium, Italy, Austria, Portugal, Germany and the UK), (Felbur 1996, p. 429). Hence, Poland’s economic gap towards the more developed European Union countries increased significantly.
Improvement of economic conditions in Poland followed suit with the systemic transformation and increasing role of the market mechanism as a regulator of economic activity. However, in the early 1990s, Polish economy did not regain the full capacity for economic growth after the shock therapy reforms of Balcerowicz, production capacity was not fully used. According to the calculations of P. Białowolski (2005, p. 46) the highest negative deviation of real to potential product occurred in October 1993 and equaled 4%, but during the period of 1993-1994 it gradually declined from 2% to 0. A more profound change happened in 1995 when the degree of production power utilisation increased noticeably and real product was higher than potential product by 1% to 2% until October 1998 (Białowolski 2005, p. 46). In the late 1990s, the negative factors affecting economic activity in Poland sourced from the Asian crisis (1997) and the Russian crisis (1998), but the latter one had a bigger impact due to stronger economic ties. Once again, the real product was below the potential product in January 1999, and the most extreme deviation occurred in the second quarter of 2002 and equaled 4% (Białowolski 2005, p. 47).
Figure 1: GDP per capita in PPS as percentage of EU-28 average in selected CEE countries
in 2000 and 2019
Source: Authors’ own elaboration based on: Eurostat (2020).
In the early 2000s, Poland’s GDP per capita was only 47% of the EU-28 average, and significantly lower than in Czechia (71.6%) and Slovenia (79.5%). On the other hand, worse results pertained to Romania, Bulgaria and the Baltics. In the Visegrad Group, Poland was last (in 2000). Nevertheless, the difference from Hungary and Slovakia was slight – respectively 5.3 pp and 3.1 pp (fig. 1).
During the pre-accession period, after the signature of the Europe Agreements, the GDP growth rate rose in the Visegrad countries as a result of increased trade and inflow of foreign direct investment. In 1995-1999, the annual averages of GDP growth were: in Czechia 2.3%, Poland 5.9%, Slovakia 4.3% and Hungary 2.7% (European Commission 2014, p. 145). During the period directly before accession (2000-2004), economic growth in Poland decreased noticeably to 3.2% (annual average), only slightly in Slovakia – to 4.0%, while Hungary and Czechia had growth rates of 4.5% and 3.7% respectively (European Commission 2014, p. 145).
According to research by R. Dobrinsky and P. Havlik (2014, p. 4), in 1995-2000, the average annual GDP growth in the EU-27 was 2.84% and in CEE-10 3.38% so the convergence factor was 0.54 pp, that included 2.57 pp in Poland, 0.56 pp in Slovakia and 0.10 pp in Hungary. In Czechia the economic gap towards the EU-27 continued to increase by an average of 1.00 pp per year. According to these calculations, in the second half of 1990s, Poland had the highest GDP growth among the Visegrad countries thus having achieved a high dynamism of the convergence process. During the final years before the EU accession, the average annual growth rate in Poland decreased to 3.08% (2000-2005), whereas in Czechia and Hungary it was above 4.0% and in Slovakia it reached 4.91%. As a consequence, the Visegrad Group significantly improved its economic position in the EU – by 2.51 pp, and the convergence indicator for Poland was 1.28 pp (per annum) (Dobrinsky and Havlik 2014, p. 4).
In total, in 1995 – 2005, after the coming into force of the Europe Agreements, the adjustment process, which encompassed the decrease of the economic gap measured by the level of GDP per capita and GDP growth rates, was effective in Poland, Slovakia and Hungary. While Czechia was not up to par with the three mentioned countries, its economic gap was still significantly lower since Poland, Slovakia and Hungary reached Czech GDP per capita from the year 2000 as late as 2019 (fig. 1). Basically, Poland’s economic gap, just as Hungary’s and Slovakia’s towards Czechia, slightly declined. Much better results in the convergence process pertained to the Baltics (fig. 1).
Economic growth and contribution to the increase in GDP of supply and demand factors in 2002-2019
Table 1 contains the real GDP dynamics in 2002-2019 divided into three 6-year cyclically differentiated periods. The period of 2002-2007 includes the economic slowdown of 2002-2003 following the demand shock in 2001 in the United States and the economic prosperity of 2004-2007. The years 2008-2013 are considered as recessive-stagnant, while in 2014-2019 the post-crisis recovery pertained to all the European Union member countries. The distinguished periods allow for the evaluation of the capacity for economic growth of individual countries during economic prosperity, crisis or revival, and the ability to regain lasting recovery after a deep recession.
GDP growth indicators in the years directly preceding accession as well as post-accession (2002-2007) reveal that all the Visegrad countries had growth rates almost double or more than the EU-28 average (2.4%). A clear leader in terms of GDP growth was Slovakia (annual average of 6.6%). GDP growth in Poland and Czechia ranged from 4.5% to 4.7%. Hungary was a “catching-up” country with the lowest growth rates (3.6%) which, nevertheless, still allowed to continue closing the economic gap towards EU-15 (tab. 1). In 2008-2013, Poland, Czechia, Slovakia and Hungary were characterised by more varied GDP growth rates. Poland had an exceptional capacity for economic growth during the two recessions and a period of stagnation – annual average GDP growth rate was 3.1%. Slovakia also achieved good results in terms of economic growth with the average of 1.8%. Czechia diminished the economic gap only slightly with the convergence factor of 0.1 pp. The only Visegrad Group country where the divergence process took place (the average annual decline in GDP of 0.5%) was Hungary. This result was worse than the average growth rate for EU-28 (0.0%) (tab. 1).
Table 1: Growth of real GDP in the EU-28 and V4 countries in 2002-2019 (percentage change, periodic averages)
Source: Authors’ own calculations based on: The Conference Board (2020).
After the 2008-2009 crisis, Hungary dropped from third to sixth rank in the analysed group of CEE countries in terms of per capita GDP (fig. 1). Sizeable losses to Hungarian GDP were caused by deep recessions in 2009 and 2012. A decline in economic activity was a consequence of a large domestic demand shock (in the case of both investment and consumption). In 2008-2012, average annual decrease in investment in Hungary was 4.3% and private consumption 2.4% (European Commission 2018, p. 7; Mucha-Leszko 2019). Post-crisis recovery in 2014-2019 was the strongest in Poland (4.0% per year) and Hungary (4.0%) with growth rates double of those for EU-28. The weakest results in the Visegrad Group pertained to Slovakia – by 0.9 pp lower growth rates than in Poland and Hungary (tab. 1).
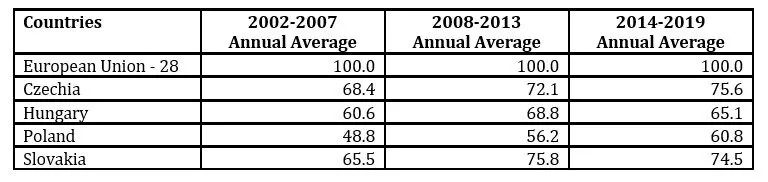
The process of convergence as well as comparative advantage in trade depend on the increase in labour productivity. Table 2 contains an increase in the level of labour productivity per hour worked in relation to the EU28=100. According to the data, in 2002-2007 Poland had the lowest labour productivity which was below 50% of the EU-28 levels. On the other side of the spectrum were Czechia and Slovakia with productivity around 2/3 of the EU level (tab. 2).
Table 2: Labour Productivity per hour worked in the EU-28 and V4 countries in 2002-2019 (EU28 = 100, periodic averages)
Note: Percentage of EU28 total (based on million purchasing power standards), current prices.
Source: Authors’ own calculations based on: Eurostat (2020).
During the recession and stagnation years, all the analysed countries increased their levels of labour productivity, but the highest increase pertained to Slovakia – by 10.3 pp, Hungary – by 8.2 pp , Poland – 7.4 pp and Czechia – 3.7 pp. During the economic downturn all the countries improved their economic effectiveness indicators measured by the level of labour productivity in relation to the EU average. Nevertheless, these positive tendencies occurring in all the Visegrad Group countries – which encompassed improvements of this basic measure of effectiveness which is labour productivity – reversed during the post-crisis recovery. In Slovakia and Hungary, the indicators of labour productivity declined (in relation to EU-28). An increase persisted in Poland and Czechia (4.6 pp and 3.5 pp) (tab. 2).
Concluding, changes in the levels of labour productivity in Czechia, Poland, Slovakia and Hungary point to a significant advancement in the convergence of effectiveness. The largest improvement in relation to the average labour productivity in 2000-2007 pertained to Poland (in 2014-2019) – by 12.0 pp, which was followed by Slovakia (9.0 pp), Czechia (7.2 pp), Hungary (4.5 pp) (tab. 2). Despite a sizeable increase in labour productivity in Poland, it still remains the lowest within the Visegrad Group, and in particular in comparison with Czechia and Slovakia (by about 15.0 pp).
Table 3: Contribution of labour, capital and TFP to GDP growth in Czechia, Hungary, Poland and Slovakia
in 2002–2019 (in percentage points, periodic averages)
Source: Authors’ own elaboration and calculations based on: The Conference Board (2020).
Table 3 contains data on the input to the GDP growth of various factors of production in the analysed countries. As emphasised, high economic growth in 2002-2007 occurred in Czechia, Poland and Slovakia. The lowest dynamics pertained to Hungary, where a slowdown in economic activity started sooner. By 2007, its growth rate was close to zero which affected the annual average for the entire period of 2002-2007. Considering the impact on the decline in economic growth of the supply factors it appears that, different from the other countries, a decrease in the contribution of labour quantity occurred (-0.6 pp). On the other hand, contribution of labour quality was comparable to Poland and higher than in Czechia or Slovakia. Capital contribution to the GDP growth in Slovakia, Hungary and Poland was focused mainly on the non-ICT areas of the economy. Czechia was exceptional in this respect with lower contribution of non-ICT capital compared with the ICT sectors. The structure of supply sources of economic growth in Slovakia is also worth mentioning. The basis for a high GDP growth in Slovakia (6.6% per year) stemmed from non-ICT capital, ICT capital and increase in TFP. Similarly to Slovakia, Czechia had a favourable structure of supply growth factors in 2002-2007 – the highest contribution of ICT capital, the lowest in terms of non-ICT capital and a high input of TFP growth. ICT capital contribution created technological progress, and high growth of TFP contribution impacted the increase in labour productivity. Czechia and Slovakia’s structure of supply sources of economic growth in 2002-2007 proves that they achieved good results in closing the technological gap. Within the Visegrad Group, Poland did not stand out in terms of economic growth and had the lowest contributions to GDP growth of both ICT capital and TFP growth as well as generally low capital contribution (non-ICT and ICT).
To sum up, in 2002-2007 Polish economic growth was mainly based on labour contribution and the opportunities of technological adjustment to the EU levels were not seized (tab. 3; Kąkol 2018).
A phenomenon of Poland’s economic growth during the EU membership was a relatively high economic growth during the recession and stagnation of 2008-2013. Poland was the only European Union member that did not experience recession in 2009, only an economic slowdown. Polish macroeconomic results were also impressive within the Visegrad group during the entire period of 2008-2013. Average annual GDP growth was at a high level with 3.1%. During the same time in Slovakia it was 1.8%, in Czechia 0.1% and Hungary suffered from a decrease of 0.5% per year. It is worth noticing that despite unchanged labour input (no deterioration in the labour market), an increase in the contribution of the quality of labour occurred in Poland. The major change, compared to 2002-2007, was a sizeable increase in the contribution of capital and TFP to GDP growth. However, capital was mostly invested in the non-ICT sector which was not conducive to the creation of technological progress in Poland. ICT capital contribution remained low (0.4 pp). Capacity to economic growth during the two waves of recession in the EU and lack of sustained recovery until 2014 in the other Visegrad countries was lower compared to Poland and in particular in Hungary and Czechia.
Assessing the supply factors’ contribution to economic growth in the post-crisis period of 2014-2019, it is worth noticing the increase in labour contribution in all four countries, particularly Hungary, since in 2008-2013 it experienced a sizeable decrease in employment (Białowąs et al. 2019, p. 17-18). Return to work resulted in the decrease in the contribution of the quality of labour to GDP growth in all the V4 countries, since workers with lower qualifications who lost their jobs during recession were rehired. The most important factor of economic growth in 2014-2019 in all the analysed countries was non-ICT capital contribution, with the exception of Czechia where the contributions of both ICT and non-ICT capital were proportionate which allowed Czechia to speed up the technological adjustment of the economy to the EU level.
In conclusion, one needs to answer a question – whether supply sources of high economic growth in 2002-2019 were favourable for technological progress, increase in labour productivity and TFP. Within the Visegrad Group, Poland had the highest economic dynamics, but the supply sources of economic growth did not ensure the creation of technological progress. Capital contribution to GDP growth was relatively high, but it was not concentrated in the ICT sector, which affects the increase in labour productivity and allows for a higher growth of labour productivity in services developed due to the utilisation of ICT technologies which are carriers of technological progress. In the Visegrad Four, capital contribution led to the decline of technological gap only in Czechia. In Poland, Slovakia, and Hungary, non-ICT capital contribution to GDP growth was not conducive towards significant changes in technological bases of the economy and structural changes.
In table 4, the indicators of contribution to economic growth in terms of demand factors have been compiled. Domestic demand includes private and public consumption and investment, while external demand represents net exports of goods and services. In general, consumption has been an important factor in maintaining economic activity in the EU countries for many years.
At the beginning of the period 2002-2007, there was a slowdown in GDP growth and influencing the increase in demand became an essential condition for economic recovery. The indicators illustrating the contribution of private consumption to GDP growth in Slovakia, Poland and Hungary in 2002-2007 prove its great importance in achieving high economic dynamics of the analysed countries. Public consumption was a significant source of economic growth in Poland, but also in Slovakia, Czechia and Hungary. In total, private and public consumption in Poland accounted for 2.99 pp contribution to GDP growth, which was 4.5%.
Table 4: Contribution to the GDP growth of demand factors in Czechia, Hungary, Poland and Slovakia in 2002–2019 (in percentage points, periodic averages)
Note: GDP at constant prices.
Source: Authors’ own elaboration and calculations based on: Ameco, 2020.
The level of private consumption depends on employment and wages, tax policy, social transfers and access to cheap loans. In Poland, the main sources of private consumption growth were (Mucha-Leszko 2020, p. 19): 1) high (with the exception of 2002) growth of GDP and population income, 2) increase in propensity to consume resulting from improved living conditions and well-assessed economic growth prospects, 3) easy access to credit, especially housing loans. The increase in the level and quality of consumption of the Polish society led to a decline in the propensity to save. This process proceeded very quickly and from January 2002 to January 2006 the savings rate in Poland dropped from 10% to 0% (NBP 2016, p. 43).
The most sustainable demand sources of GDP growth occurred in Czechia in 2002-2007, and their contribution was as follows: private consumption 1.83 pp, investment 1.59 pp, net exports 0.63 pp and public consumption 0.49 pp. The demand sources of GDP growth in Slovakia and Poland were dominated by consumption (private and public). Consumer demand was significantly supported by investment, which constitutes the basis for long-term economic growth (Mucha-Leszko and Twarowska 2018). Czechia, Poland and Slovakia had a comparable contribution of investment to GDP growth, and Hungary had a lower contribution.
In the case of Slovakia, there was a large contribution of external demand to GDP growth as an effect of export competitiveness (tab. 4). Czechia was second in this respect. In 2002-2007, Poland imported more than it exported, so external demand was not a source of economic growth. During the recession-stagnation period (2008-2013), the most considerable factor of economic growth in all Visegrad countries was foreign demand, and its largest contribution to GDP growth pertained to Slovakia and Hungary. It was also of great importance in Poland and Czechia. Private consumption was the major source of economic growth in Poland. Slovakia and Czechia stood out with low rates of private consumption contribution to GDP growth, and its significant decline was recorded in Hungary. Public consumption played a minor role as a factor of GDP growth in all four countries. However, the decline in investment had the most regressive impact on the economic situation in 2008-2013. Its largest fall was recorded in Czechia and Hungary, slightly lower in Slovakia. Only in Poland the contribution of investment to economic growth was moderately positive. In conclusion, it is worth recalling that in the period of two recessions and post-crisis economic stagnation in the EU, Poland achieved an average annual growth rate of 3.1%, and the most important demand sources of GDP growth were: private consumption, investment and net exports.
After two waves of recession (2009, 2012), the economies of the EU countries could not achieve a stable recovery for a long time. It was only in 2014 that they recorded an increase in GDP, which in 2014-2019 amounted to an average of 2.1% (EU-28). The economic dynamics of Poland and Hungary was almost twice as high as the EU average (4.0%), and the growth rate of Czechia and Slovakia was 3.3% and 3.1% respectively. The lower average annual GDP growth rate (2014-2019) in Slovakia as compared to Poland was the result of the deep recession in 2009 (-5.5%) as well as the stronger, and longer than in Poland, economic downturn after 2010, which persisted in the period of 2011-2014 (Mucha-Leszko 2017, p. 84-85). In Czechia, the lower periodic average of GDP growth rate in 2014-2019 was a consequence of the two-fold slowdown in economic activity in 2016 and 2018 (Mucha-Leszko 2019, p. 70).
Concentrating on the demand factors of economic growth in the Visegrad countries, it should be emphasised that private consumption, supported by public consumption, had the greatest share in GDP growth in all of them. The contribution of investment was comparable in Czechia, Poland and Slovakia, but relatively low after their large decline in 2008-2013. While investments in Hungary played a significant role in reviving the economy. The impact of external demand on the strength of economic recovery in the surveyed countries varied, from moderately positive in Poland and Czechia to negative in Slovakia and Hungary (tab. 4). It should be pointed out, however, that the decline in foreign demand was a consequence of regressive trends in international trade (Wojtas 2017).
Conclusion
When assessing the results of Poland’s economic growth and the pace of the convergence process against the background of the V4 countries, it should be emphasised that Poland suffered significant development losses, measured by the negative GDP growth rate in 1978-1994 (-0.97% annual average). The fundamental change in development trends took place in 1995. The exceptionally high economic growth was maintained in 1995-1999 – an annual average of 5.9%, while in Slovakia it was 4.3%, Hungary 2.7%, and Czechia 2.3%. In 2000-2004, Poland’s economic growth rate decreased to 3.2% per year, and in the remaining V4 countries it increased and amounted to: 3.7% in Czechia, 4.0% in Slovakia and 4.5% in Hungary. To sum up, in the pre-accession period, the possibilities of reducing the economic gap were not fully used, especially in the first half of the 1990s and in the years 2000-2004.
Poland’s economic growth under the conditions of EU membership was more dynamic and stable. In 2002-2007, Poland’s convergence coefficient with the EU-28 amounted to 2.1 pp, in Czechia 2.3 pp, Slovakia 4.2 pp and Hungary 1.2 pp, i.e., in the V4 group at a level close to the average. Poland’s success was the high dynamics of reducing the economic gap in 2008-2013 and 2014-2019. In the recessive-stagnant period, the convergence ratio in relation to the average EU-28 GDP growth reached the level of 3.1 pp in Poland, in Slovakia 1.8 pp, Czechia 0.1 pp, and Hungary increased the economic gap by 0.5 pp annually. During the post-crisis recovery period, all the V4 countries achieved a higher growth rate than the EU-28 and the convergence coefficients were varied, Poland 1.9 pp, Slovakia 1.9 pp, Czechia 1.2 pp, and Hungary 1.0 pp. The highest dynamics of economic growth and convergence under the conditions of EU membership was achieved by Slovakia and Poland.
As emphasised, an important aspect of the analysis of economic growth results is the appraisal of the contribution of supply and demand factors. When assessing the contribution of supply factors to GDP growth, it is necessary to answer the question whether the structure of supply sources of growth was favorable from the point of view of influencing technological progress, increase in labor productivity and TFP. The contribution of capital to GDP growth was relatively high, but it was invested outside the ICT sector, while the contribution of ICT capital remained low, and it is the carrier of technological progress. Only Czechia had a proportional contribution of ICT and non-ICT capital. Thus, the structure of supply sources of GDP growth did not ensure Poland, Slovakia and Hungary reducing the technological gap, but ensured achievement of this goal for Czechia. The structure of demand sources of GDP growth was also unfavorable for Poland. Consumption was the dominant factor throughout the period considered. In summary, the weakness of economic growth in all the V4 countries were low investment and concentration of capital expenditures outside the ICT sector (in the latter case, with the exception of the Czechia).
To conclude the evaluation of Poland’s economic dynamics during the EU membership, it is worth pointing to the forecasts of Poland’s diminishing the economic gap published in the 1995 report “The Polish Economy in 1995” (1996, p. 3). The authors of the report predicted that Poland would have achieved a GDP per capita level of 75% in relation to the EU by the year 2022 or 2025 (the second scenario). The analysis carried out in the paper confirmed the nearly 100% accuracy of these forecasts (fig. 1).
Endnotes
1Austria, Finland, Norway and Sweden. They became members in January 1995 (with the exception of Norway where the accession treaty was rejected in a national referendum).
2Czechoslovakia was divided into two sovereign states – Czechia and Slovakia in 1993.
References
Ameco (2020), Ameco database. [Online], [Retrieved August 25, 2020], https://ec.europa.eu/economy_finance/ameco/user/serie/SelectSerie.cfm.
B. (1961) The Theory of Economic Integration, III Urwin, Homewood.
Baldwin, R. and Wyplosz, Ch. (2009), The Economics of European Integration, Third Edition, McGraw-Hill Education,
Barro, R. and Sala-i-Martin, X. (1990), ‘Economic Growth and Convergence across United States,’ NBER Working Paper, 3419, https://doi.org/10.3386/w3419.
Barro, R. and Sala-i-Martin, X. (1991), ‘Convergence across States and Regions,’ Brookings Papers on Economic Activity, 1, http://dx.doi.org/10.2307/2534639.
Barro, R. and Sala-i-Martin, X. (1992), ‘Convergence,’ The Journal of Political Economy, 100, http://dx.doi.org/10.1086/261816.
Ben-David, D. and Loewy, M.B. (2003), ‘Trade and the Neoclassical Growth Model,’ Journal of Economic Integration, 18, http://dx.doi.org/10.11130/jei.2003.18.1.1.
Białowąs, T., Pasierbiak, P. and Wojtas, M. (2019), ‘Structural changes and technological progress as factors of labour market developments in the V4 countries in 2004-2018,’Problemy Zarządzania, 17 (6), 11-30, https://doi.org/10.7172/1644-9584.86.1.
Białowolski P. (2005) ‘Produkt potencjalny w Polsce w latach 1993-2004 na podstawie funkcji produkcji,’ Gospodarka Narodowa, 5-6, 37-48, https://doi.org/10.33119/GN/101517.
Bożyk, P. and Misala, J. (2003), Integracja ekonomiczna, PWE, Warszawa.
Commission of the European Communities (1990) ‘One Market One Money. Evaluation of the Potential Benefits and Costs of Forming an Economic and Monetary Union,’ European Economy, 44.
Dobrinsky, R. and Havlik, P. (2014), ‘Economic Convergence and Structural Change: the Role of Transition and EU Accession,’ The Vienna Institute for International Economic Studies Research Report, 395.
European Commission (2014) ‘European Economic Forecast,’ European Economy, 7.
European Commission (2018) Country Report Hungary 2018, Brussels, 7.3.2018, SDW (2018) 215 final.
Eurostat (2020), Eurostat database. [Online], [Retrieved August 23, 2020], http://ec.europa.eu/eurostat/data/database.
Felbur, S. (1996) ‘Struktura gospodarki Polski i jej dostosowanie do integracji z Unią Europejską,’ Ekonomista, 4, 425-451.
Grossman, G. and Helpman, E. (1991), Innovation and Growth in the Global Economy, MIT Press, Cambridge, Mass.
Kąkol, M. (2018) ‘Poland’s Competitiveness in Services Trade on the European Union Internal Market’ Proceedings of the 4th International Conference on European Integration, ISBN: 978-80-248-4169-4, ISSN: 2571-029X, 17-18 May 2018, Ostrava: VŠB-TU Ostrava, Faculty of Economics, Czech Republic, 627-641.
Komitet Integracji Europejskiej (1997a) ‘Agenda 2000, Opinia Komisji Europejskiej o wniosku Polski o członkostwo w Unii Europejskiej,’ Monitor Integracji Europejskiej, wydanie specjalne.
Komitet Integracji Europejskiej (1997b) Narodowa Strategia Integracji, Warszawa.
Ładyka, S. (2001) Z teorii integracji gospodarczej, Katedra Integracji Europejskiej im. J. Monneta, Kolegium Gospodarki Światowej SGH, Warszawa.
Lucas Jr., R.E. (1988) ‘On the Mechanics of Economic Development,’ Journal of Monetary Economics, 22 (1), http://dx.doi.org/10.1016/0304-3932(88)90168-7.
Molle, W. (2006) The Economics of European Integration: Theory, Practice, Policy, 5th Edition,
Mucha-Leszko, B. (2014), Wzrost gospodarczy i proces konwergencji oraz średnio i długoterminowe perspektywy zmniejszania luki rozwojowej, Pozycja gospodarcza Polski w Unii Europejskiej, Mucha-Leszko, B. (ed.), UMCS, Lublin.
Mucha-Leszko, B. and Twarowska, K. (2018), ‘Investment as Determinant of the Sustained Economic Growth in the European Union after Crisis 2008-2009’ Proceedings of the 4th International Conference on European Integration, ISBN: 978-80-248-4169-4, ISSN: 2571-029X, 17-18 May 2018, Ostrava: VŠB-TU Ostrava, Faculty of Economics, Czech Republic, 1054-1067.
Mucha-Leszko, B. (2017) ‘Wzrost gospodarczy i proces konwergencji Polski i Słowacji w warunkach członkostwa w Unii Europejskiej,’ Nierówności Społeczne a Wzrost Gospodarczy, 50 (2), 74-88, https://doi.org/10.15584/nsawg.2017.2.4.
Mucha-Leszko, B. (2019) ‘Catching-up process and public finances of Czechia and Hungary compared with Austria and the Netherlands in 2000-2018,’ Research Papers of Wroclaw University of Economics and Business, 63 (10), 57-73, https://doi.org/10.15611/pn.2019.10.05.
Mucha-Leszko, B. (2020) ‘Podażowe i popytowe źródła wzrostu gospodarczego w Polsce i największych krajach Unii Europejskiej w latach 2000-2018,’ Nierówności Społeczne a Wzrost Gospodarczy, 61 (1), 7-25, https://doi.org/10.15584/nsawg.2020.1.1
NBP (2016) Raport o stanie równowagi polskiej gospodarki, Materiał dla KSF-M, Instytut Ekonomiczny, Warszawa.
Pelkmans, J. (2001) European Integration: Methods and Economic Analysis, Second Edition, Financial Times/Prentice Hall, Pearson Education Ltd., Harlow, England.
Romer, P. (1990) ‘Endogenous Technological Change,’ Journal of Political Economy, 98 (5), http://dx.doi.org/10.1086/261725.
Rosamond, B. (2000) Theories of European integration, Macmillan Press Ltd., London and New York.
Ross, G. (1995) Jacques Delors and European Integration, Polity Press, Cambridge.
Siwiński, W. (2005) ‘Międzynarodowe zróżnicowanie rozwoju gospodarczego: fakty i teoria,’ Ekonomista, 6, 723-747.
Swann, D. (2000) The Economics Of Europe: From Common Market To European Union, 9th Revised Edition, Penguin UK.
The Conference Board (2020), The Conference Board Total Economy Database™ (Original version), July 2020. [Online], [Retrieved August 21, 2020], https://conference-board.org.
The Polish Economy in 1995 (1996), Annual Economic Report, with developments 1989-1995 and prospects for 1996, European Union, Delegation of European Commission, Warsaw.
Urząd Rady Ministrów, Biuro Pełnomocnika Rządu ds. Integracji Europejskiej oraz Pomocy Zagranicznej [URM] (1995), Monitor Integracji Europejskiej, 1.
Wojtas, M. (2017) ‘Przyczyny spowolnienia światowego handlu,’ Studia i Prace Wydziału Nauk Ekonomicznych i Zarządzania, 49 (2), 75-87, http://dx.doi.org/10.18276/sip.2017.49/2-0.