Structural Changes in the Energy Sector versus Economic Growth, Energy Consumption and CO2 Emissions in 2000-2018 – the Global and Regional Perspective
Bogumiła MUCHA-LESZKO1, Magdalena KĄKOL2 and Aneta JAROSZ-ANGOWSKA3
1Vincent Pol University in Lublin, Lublin, Poland
2Maria Curie-Sklodowska University in Lublin, Lublin, Poland
3University of Life Sciences in Lublin, Lublin, Poland
Volume 2022,
Article ID 540561,
Journal of Eastern Europe Research in Business and Economics,
17 pages,
DOI: 10.5171/2022.540561
Received date: 16 November 2021; Accepted date: 31 January 2022; Published date: 1 March 2022
Cite this Article as:
Bogumiła MUCHA-LESZKO, Magdalena KĄKOL and Aneta JAROSZ-ANGOWSKA (2022)," Structural Changes in the Energy Sector versus Economic Growth, Energy Consumption and CO2 Emissions in 2000-2018 – the Global and Regional Perspective", Journal of Eastern Europe Research in Business and Economics Vol. 2022 (2022), Article ID 540561, DOI: 10.5171/2022.540561
The paper covers a conceptualisation of the meaning of energy and energy policy as well as an empirical analysis of economic growth, energy consumption and CO2 emissions. The empirical research aims at evaluating the advancement of the transformation of the energy sector. It was carried out on the basis of numerical statistics and with the use of percentage indicators to present the changes in energy consumption and CO2 emissions in highly developed and emerging economies. The indicators of the share of traditional and renewable energy resources in the group of largest consumers were employed to display structural changes in the energy sector as well as the simple correlation coefficients to test the intensity of the relationship between the pairs of the following variables: GDP, energy consumption and CO2 emissions. The empirical analysis revealed: 1) in the field of the transformation of the energy sector: a decrease in energy consumption in highly developed countries (mainly in Japan and the EU) and its rise in developing countries with high GDP dynamics (China, Iran and India), 2) a fall in shares of global CO2 emissions in the USA and the EU (by 10.0 pp and 6.9 pp) and a surge in analogous indicators in China and India (15.1 pp and 3.1 pp), 3) the biggest increase in the share of renewables in energy consumption was attained by Brazil and the EU (by 5.3 pp, 4.1 pp), whereas India, Indonesia and China had a considerably greater share of renewables in 2000 compared to 2018 (by 20-23.7 pp).
Keywords: Keywords: leading energy consumers and emitters of CO2, relationships between GDP growth, energy consumption and CO2 emissions, traditional and renewable energy sources
Introduction
Access to energy resources and energy production have a decisive impact on economic activity, GDP dynamics and civilization development. Each technological revolution has resulted in structural changes in the energy sector.
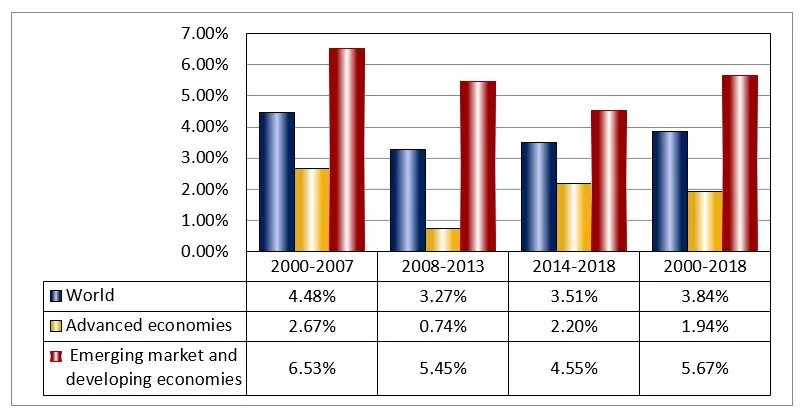
However, the greatest changes in the energy sector began in the last decade of the last century, and new technologies have a decisive impact on the fundamental diversification of energy sources, and thus a gradual decrease in the importance of fossil resources (especially coal). They make it possible to use natural and renewable energy resources to mitigate the negative effects of climate change caused by the accumulation of greenhouse gas emissions, especially CO2. Dangerous climate changes, defined as the greenhouse effect, are largely the result of increasing energy demand caused by the high dynamics of economic growth in a group of countries in the stage of intensive industrialization (China, India and other countries in Southeast Asia, Eurasia, Africa, Central and South America and in the Middle East) (Kuzemko, Lawrence and Watson 2019). An important feature of development processes from the beginning of the new century is the large spread of GDP growth rates between the group of highly developed countries and the so-called emerging economies (Figure 1). As a result, countries at the stage of intensive industrialization contribute to an increase in energy demand. On the other hand, relatively low GDP growth and the introduction of energy-efficient technologies have caused a decline in demand for it in the United States, Europe and Japan.
The demand for electricity is growing the fastest. As anticipated by the International Energy Agency (IEA), it will continue rising twice as fast as overall energy demand (Kuzemko, Lawrence and Watson 2019). The increased consumption of energy commodities, especially coal, seriously compromised balance in the natural environment and led to dangerous climate change. This is a serious global problem where adequate measures should be taken both on the energy demand and energy supply side. The changes in demand consist in shifting it from highly developed countries (OECD) to countries outside the OECD – emerging economies. The structure of the demand for energy resources is also evolving, and the demand for clean and renewable energy resources is growing. From the mid-2020s, India will achieve the highest dynamics in demand for energy resources. The main drivers of increasing energy demand in non-OECD countries are: population growth (by around 1.7 billion by 2040) (BP 2019), high dynamics of GDP and income, and urbanization. CO2 emissions from energy consumption are supposed to increase by almost 10% by 2040 (BP 2019). To achieve more sustainable development, economic growth cannot be a target in itself but should be combined with energy security and transformation of the energy sector. Only collaboration between the largest energy consumers can mitigate the effects of a high share of fossil fuels, especially coal. Demand-side measures, more efficient energy use and investment, in decreasing energy intensity are the most effective means of reducing greenhouse gas emissions.
The main objective of global energy policy comprises changes on the supply side of energy resources – eliminating conventional fuels and replacing them with their clean renewable equivalents. Ensuring the supply and accessibility of energy to all countries and decarbonisation of economies lead to substantial changes in energy markets, from global and regional to domestic ones. They are radical enough to require a new conceptualisation that will determine the framework of theoretical analysis and form the basis for empirical analysis.
The conceptualisation of the significance of energy and energy policy is presented with reference to the latest theoretical developments of international political economy (IPE) (Goldthau and Sitter 2020; Keohane 2009; Kuzemko 2019; Kuzemko, Lawrence and Watson 2019; Newell 2019; Romanowa 2016).
Our analysis covers changes in energy consumption and CO2 emissions as well as structural transformations in the energy sector occurring in 2000-2018. They shape a new reality in economic relations in the global, regional and national dimensions. According to the contemporary discussion of IPE representatives, this is an area that requires filling gaps in existing knowledge. The authors believe that the conceptual apparatus and the conceptualisation of research problems require supplementing and reformulating in order to better understand the effects of the technological revolution in the field of energy, so that the actions in the energy policy anticipate the consequences of technological changes and the effects of imperfections of the market mechanism as well as the resistance of the established monopolistic capital structures.
However, so far energy policy has been treated as a task of the national policy and an instrument of the game on energy markets. In the regional dimension, the European Union can boast of the greatest achievements in energy policy. Regional integration in the conditions of advanced globalization creates opportunities for more effective resolution of global problems, as the policy rules set out in EU law oblige member states to use energy more efficiently, decarbonise economies and switch to renewable energy resources. The strength of the EU internal market, the concept of a wider Europe and the EU energy law open up new possibilities in the implementation of global energy policy.
The framework of the theoretical analysis includes: 1) conceptualisation of the economic and political role of energy – an answer to the question of what energy is, 2) conceptualisation of the EU energy policy. The aim of empirical research is to assess the advancement of transformation of the energy sector on the basis of numerical statistics. We present the percentage indicators of changes in energy consumption and CO2 emissions in highly developed countries and emerging economies. For the purpose of displaying structural changes in the energy sector, the indicators of the share of traditional and renewable energy resources in the group of the largest consumers in 2000 and 2018 were used. The simple correlation method was employed to test the intensity of the relationship between the pairs of the following variables: GDP, energy consumption and CO2 emissions. In the correlation analysis, the Pearson’s linear correlation coefficient was applied, and the significance of the correlation was tested by the r-test (α = 0.05).
The authors formulate two hypotheses: 1. An increase in energy consumption and CO2 emissions is connected with rising GDP in emerging economies. 2. The transformation of the energy sector aimed at reducing energy consumption and CO2 emissions is carried out mainly by highly developed countries, especially the EU.
The empirical analysis was based on IEA, IMF, OECD and BP data. It covers the period 2000-2018 – before the consequences of the COVID-19 crises appeared.
Conceptualisation of the significance of energy and energy policy according to representatives of International Political Economy – literature review
A new subdiscipline of science – international political economy – emerged in response to the internationalisation of business, and especially a new organisation of production processes (its dispersion around the world) by transnational corporations. A prerequisite for the development of the global economic space is an increase in the degree of openness of national economies, accompanied by technological progress. Such opportunities arose in the 1960s and 70s. According to B. Cohen (2008), IPE was created by the so-called ‘Magnificent Seven’ (R. Keohane, R. Gilpin, S. Krasner, P. Katzenstein, R. Cox, Ch. Kindelberger and S. Strange). R. Keohane distinguishes between the old IPE and the new after 1970. At the initial stage of development of IPE, the authors focused on investigating the political implications of economic interdependence using an approach in a creative but analytically free manner, whereas the new IPE is derived from a political approach favouring an open economy and brings together comparative and international political economy within a common framework (Keohane 2009). The IPE studies are designed to assess the effects of competition on the distribution of benefits from participation in global trade and the results of diversification of income and shifts in the economic position of countries (Oatley 2008). If distribution remains uneven in the long term, some participants become wealthy and others grow poor. R. Keohane emphasises that representatives of the present-day IPE are not sufficiently dedicated to dealing with key problems of the global economy: the role of China, volatility in financial and energy markets, and the role of market participants other than states (Keohane 2009). Transnational corporations have the largest influence on the distribution of benefits from international transactions and their cooperation at the intergovernmental level becomes an important condition for solving global problems and for global governance. The achieved high interdependence of global market participants, the emerging global society, a strong position of multinationals, the increasing activity of non-governmental organisations and other participants of global interactions and interdependence gives rise to a growing need for creating global rules of cooperation, and international political economy is transformed into global political economy.
One of the most burning issues in the last two decades – which can only be solved at a global level – has been global warming and its effects that are closely linked to the growing consumption of fossil-based energy, including especially coal-based energy. The traditional IPE did not deal with energy security as a priority global problem and its conceptualisation requires indicating the necessity to transform the energy sector in order to radically shift to a low-carbon economy. The origins of conceptualisation of energy date back to the series of crises in the 1970s (currency, energy and economic) and its important element was the definition of energy security. Its understanding was different, depending on the situation of the countries and the degree of their dependence on imports of energy commodities. However, countries that were rich in such raw materials and were their exporters interpreted energy security dissimilarly. In the first case, a common definition provides for ensuring supplies of energy commodities at acceptable (reasonable) prices, and in the latter, it concerns ensuring the selling markets and an adequate source of income from exports. But remarkable structural changes in the energy sector in the1970s were shaped mainly by three factors: energy and economic crises, high inflation and currency risk caused by floating exchange rates (Mucha-Leszko, Kąkol 2012). For Russia – a world power rich in energy commodities – the objective is to establish state control over strategic resources and the transmission infrastructure network (Yergin 2006).
A region that is highly dependent on the imports of primary energy sources is Europe, including the European Union, and more than 1/3 of oil, gas and coal supplies comes from Russia. It is possible to reduce the degree of dependence on Russia through diversification of suppliers, investing in modern, energy efficient technologies and increasing the volume of energy generated from renewable sources. The European Union is changing its approach towards the energy policy objectives in connection with the impact of the growing consumption of fossil-based energy on the climate and due to the lack of environmental sustainability for the first time, the Treaty of Lisbon included a separate article relating to energy policy and defined its new goals (Art. 194 of TFEU). Apart from ensuring the security of energy fuels supply, sustainable competitiveness and protection of the environmental balance were also taken into account (CVTFEU 2012). However, the major problem is that the scope of responsibility for the implementation of the security of energy resources supply has not been established between the EU and its member states (Herranz-Surralles 2015). The countries are vastly autonomous so reaching a common position at a supranational level is a difficult task. Economies of the member states of the European Union feature highly differentiated levels of dependence on oil and gas imports from Russia – from several per cent (in Ireland and Slovenia) to 80% (in Slovakia and Lithuania) for oil and from zero (in Spain and Portugal) to 100% (in Estonia and Finland) for gas imports (Simola 2018). As a result – the diversification of economic and political priorities of the member states, the dependence on Russian oil and gas, and in particular the competition between European energy companies impede the development of a uniform policy towards Russia. These factors are sources of severe conflicts in the European Union. The companies prefer to negotiate and conclude commercial transactions with the support of national authorities on a bilateral basis, which also corresponds to Russia. The Nord Stream II project – undermining the EU solidarity principle (Wojcieszak 2017) – gives rise to the most controversy.
Returning to the conceptualisation of the economic and political role of energy, the question arises of how to define energy – what energy is. Considering its application, concentration of natural energy resources in certain parts of the world and in few countries and their environmental impact, in seeking to conceptualise this issue as a whole, the following should be emphasised (Herranz-Surralles 2015): 1) the significance of energy in the technological aspect as a factor conditioning the development of production, and in the commercial aspect as a normal commodity; 2) in view of the limited availability of the resources as a strategic product; and 3) given a wide range of its uses in households – as personal services. On the other hand, the negative effects of the growing consumption of energy make it a factor that degrades the natural environment and causes severe climate change, thereby complicating the development and living standards for future generations.
The presented multi-aspect approach to the issue of energy opens the discussion on conceptualisation of the EU external energy policy. A. Herranz-Suarralles considers factors affecting the development of this policy. In her opinion, the EU aims to create a common energy regulatory space with third countries. Therefore, it liberalises and de-monopolises the energy sector believing the market mechanism and its transparent rules to be the best basis for the security of energy commodities supplies and reasonable prices (Herranz-Surralles 2015). This point of view is confirmed in the literature.
According to A. Goldthau and N. Sitter the large and liberalised EU internal market with clearly defined competition rules oblige external participants of this market to respect these rules (Goldthau, Sitter 2014). Non-compliance with the EU competition law leads to proceedings before the European Commission and sometimes the WTO and as a consequence to sanctions including elimination from the market. The European Union’s ability to form international market rules in line with its preferences is increasing owing to the strength of its market and the European Commission’s competence in enforcing antitrust law (Bach, D.; Newman 2007). The “wider Europe” concept provides for extending influences by offering institutional partnership to neighbouring countries which opens up new possibilities for shaping a global policy (Lavenex 2004). Secondly, the activities of European institutions supporting projects aiming to diversify energy sources and rescue projects in crisis situations have a material impact on energy security and external energy policy. Thirdly, the EU’s external energy policy must reconcile the intersecting objectives from three policy areas: energy policy objectives seen from a group perspective and other objectives of external policy, and achieve compliance of objectives at a global level, to ensure that the provisions of the agreement signed in Paris (2015) can be put into effect. It is about reducing global warming by 2-1.5º C and maintaining energy security in the face of a high dependence on conventional energy sources.
Economic Growth, Energy Consumption and CO2 Emission – the Largest Energy Consumers and CO2 Emitters in 2000-2018
The time interval covered by the study was divided into three periods according to the economic cycle. During the first period – 2000-2007 – the world economic growth was relatively high, except for the slowdown in 2001-2003. The crisis in the banking sector along with destabilisation of the financial market (2007/2008) brought about a severe economic breakdown. Starting from a deep recession in 2009 and, following a brief revival in 2010, the rate of economic growth decreased, especially in Europe, and in 2012-2013 most EU countries were affected by a second (mild) wave of recession. A distinguishing feature of the third period is recovery that extended over all EU member states. The United States did not suffer a second wave of recession (Mucha-Leszko 2016). During the financial and economic crisis in 2008/2009+, most emerging economies maintained a high GDP growth rate, although with a tendency to decrease.
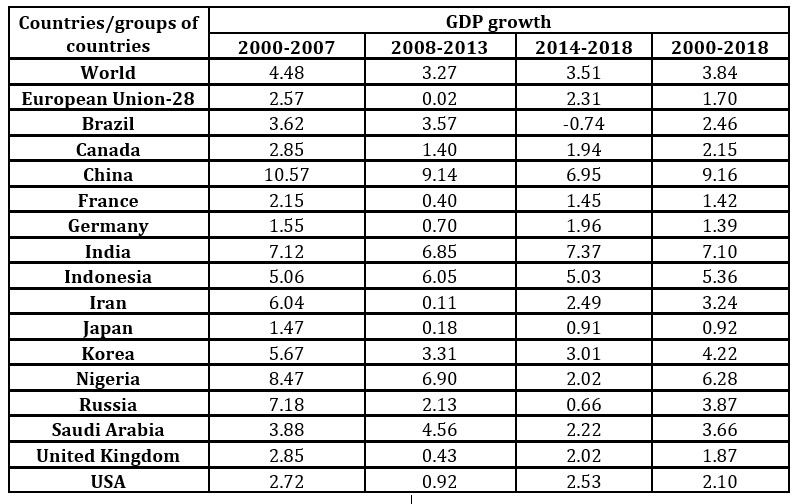
Table 1 presents average annual rates of real GDP growth in the periods of time adopted for respective countries – major energy consumers – and for the world and the EU. The average annual rate of growth of GDP on a global scale was stable throughout the period 2000-2018, except when it was 1 percentage point higher during good economic situation in 2000-2007. GDP growth rates differed strongly between countries. In the times of good business activity in 2000-2007 the GDP growth rates ranged from 1.5% in Germany and Japan to 10.6% in China. The group of countries with the lowest economic growth comprised: Germany, Japan, the USA, the UK, Canada, Brazil, Saudi Arabia and the EU as a group of countries. Meanwhile, the highest economic growth levels were recorded in: China, Nigeria, Russia, India and Iran.
Table 1: Annual average growth of real GDP of major energy consumers in 2000-2007, 2008-2013, 2014-2018 and 2000-2018 (in %).
Note: the table includes the largest energy consumers – countries are ranked according to the size of their energy consumption in 2018. Source: own elaboration and calculations based on (IMF 2020).
According to GDP growth rates, the analysed countries can be classified into two groups: developing countries with high economic dynamics and highly developed countries with low economic dynamics. In the years of crisis and economic stagnation (2008-2013), the average annual rates of economic growth decreased, in the first place, in highly developed countries by 1.2 pp on a global scale, to 0.0% in the EU, to 0.1% in Iran, to 0.2% in Japan, to 0.4% in France and the UK, to 0.7% in Germany, to 0.9% in the USA and to 1.4% in Canada. A small decline in economic dynamics was observed in India, China and Nigeria. An increase occurred in Saudi Arabia and Indonesia, and in Brazil the growth remained at 3.6%. The spread of GDP growth rates was still large – from 0.0% in the EU to 9.1% in China. In the third period – 2014-2018 – the EU restored its economic growth capacity to a level approximately equal to that in 2000-2007. The improvement in economic growth rates in the USA, Germany and the UK can be evaluated in similar terms. However, the greatest change was a large decrease in the dynamics of GDP in emerging economies and a big difference between the countries in that respect. In Brazil the average GDP growth rate had a negative value (-0.7%), and the lowest growth rates were recorded in: Russia, Japan, France, Canada, Nigeria, the UK and Germany. The highest economic growth was maintained in India (7.4%), China (6.9%) and Indonesia (5.0%). The spread of economic growth rates in the analysed group of countries was still large – from (-0.7%) to (7.4%). Throughout the study period (2000-2018), countries with the highest growth in the GDP were: China, India, Nigeria and South Korea. The lowest economic growth was recorded in: Japan, Germany, France, the EU average, the USA and Canada. Despite a persisting big advantage of emerging market and developing countries over highly developed ones in terms of economic dynamics, Figure 1 shows a clear downward trend in the spread of GDP growth rates between these groups of countries in 2014-2018.
Fig. 1: Comparison of real GDP growth in advanced economies, emerging market and developing economies and in the world in: 2000-2007, 2008-2013, 2014-2018 and 2000-2018, annual averages in %.
Source: own elaboration and calculations based on (IMF 2020).
During the times of good business activity, highly developed countries, in creating demand, set up favourable conditions for economic growth for other countries of the world. China and India were the countries that developed – to the highest extent – thanks to external demand and the inflow of foreign direct investment. In 2008-2013 – two waves of recession and prolonged economic stagnation led to a large decrease in demand on the part of highly developed countries and this was a factor limiting the possibilities of economic growth in the countries of Asia, Central and South America, Africa and Arab countries. A low propensity to invest in the EU, the USA and Japan reduced their demand and imports. In 2015, there was a clear slowdown in international trade, which – except for the demand factor on the part of the USA, the EU and Japan – was affected by: reduced income elasticity of trade, decrease in the rate of liberalisation and increase in protectionism, change in China’s policy towards economic growth and nearly exhausted possibilities for the development of global value chains (Wojtas 2017).
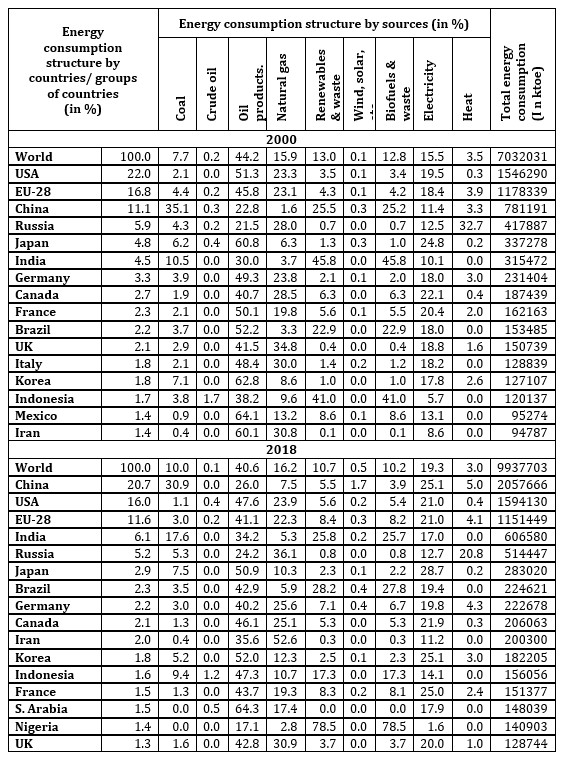
Due to differences in GDP growth dynamics, the requirement for energy and its consumption rose mostly in countries with the highest GDP growth rates. As underlined previously, the emerging economies contributed to a big surge in the consumption of energy and emission of gases into the atmosphere. Cheap technologies used in those countries additionally increase the consumption of energy and the harmful impact on the environment and climate. In assessing the harmful effects of consumption on the environment and climate, one should take into account the actual amount of energy consumption in volume terms, its growth and the share of energy sources. In 2000, the largest energy consumers were the USA (21.99%), EU-28 (16.76%) and China (11.11%), their share in world energy consumption accounted for 49.86%. There were major changes in the period considered (2000-2018). While these three centers remained the largest energy consumers in 2018 with a slightly reduced total share to 48.34%, China’s share grew to 20.71%, the USA decreased its share to 16.04%, and the EU-28 to 11.59 %. The rise in China’s share in global energy consumption was caused by the high growth of GDP, while the decline in the share of the USA and the EU-28 was due to low economic growth and increased efficiency in the use of energy resources. The group of the largest energy consumers from emerging economies (China, Iran, India, Brazil, Indonesia, including Korea), whose share in world energy consumption in 2000 accounted for 22.65%, augmented it in 2018 to 34.49%.
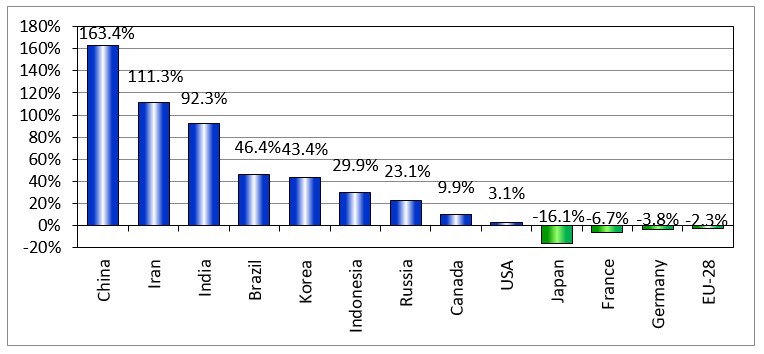
The presented indicators of consumption growth confirm partly the hypothesis that developing countries are responsible for the increase in energy consumption, but not all of them, mainly China, India, Iran, Brazil and Indonesia. Among the highly developed countries, Canada did not record significant achievements leading to an increase in energy efficiency (Table 2 and Figure 2).
Table 2: Largest energy consumers in 2000 and 2018: energy consumption structure by countries and by sources.
Note: Nuclear and hydro in consumption = 0.
Source: own elaboration and calculations based on (OECDb 2021; IEA 2021).
Fig. 2: Indicators of changes in energy consumption in the group of the largest global consumers in the period 2000-2018 in %.
Source: based on data from Table 2 and own calculations.
Table 2 presents the share of sources used in the consumption of energy globally, in the EU and in 15 countries being the major consumers of energy in 2000 and 2018. The most important goals of energy policy are: reducing the use of coal as a source of energy (decarbonisation) and increasing the utilisation of renewable resources. In the analysed period, the world share of coal as a source of energy increased by 2.3 pp. Generally, the problem of decarbonisation in the global dimension is apparently not large because the main sources of energy are: oil products, natural gas, electricity, renewables and waste. The centre of carbonised energy consumption is Asia. In 2000, among major consumers of energy, Asian countries had the highest share of coal-based energy – 63.1% – which increased to 71% in 2018. The contributors to this increase were India and Indonesia and – to a small extent – Japan. China made some progress in decarbonising energy consumption by diminishing the share of coal from 35.1% to 30.9%. In the USA and the EU, coal is generally not a very significant source of energy. Russia occupies the highest position in the use of coal as an energy resource among European countries. At a global and national level energy policy aims at transforming the energy sector to mitigate the effects of climate change, diversify the sources of energy, reduce the dependency on import and augment the supply of domestic energy resources and access to cheaper energy raw materials through increasing the options of their storage. In this context, the most interesting sources are renewables. Table 2 shows their share in the global consumption of energy in the EU and in 15 countries – the major consumers of energy. The fundamental question concerns the transformation of energy sources towards mounting the share of renewables. The data indicate that on a global scale the share decreased from 13% in 2000 to 10.67% in 2018. In highly developed countries it is generally low (below the global average), but is differentiated and in most cases its trend is upward. In the EU the share of renewables and waste increased almost twofold – from 4.3% to 8.4%, in Germany from 2.1% to 7.1%, and in France from 5.6% to 8.3%. In the USA technologies for generating energy from renewables are insignificant in connection with new discoveries of unconventional oil and gas reserves. Emerging economies are definitely outstanding in terms of the share of renewables and waste in the consumption of energy. In 2000, in a group of 15 countries the highest share of renewables and waste in the consumption of energy was recorded for: India 45.8%, Indonesia 41%, China 25.5% and Brazil 22.9%. This energy was almost completely derived from biofuels and waste. The wind and solar power use ratios were residual. On the other hand, attention should be paid to the high and growing significance of electricity as a secondary source of energy.
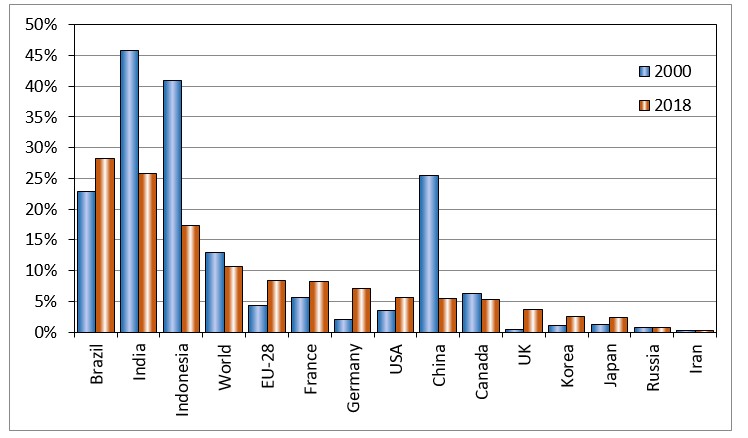
In 2018, there were regressive trends in the use of clean energy sources in China, India and Indonesia (Figure 3). The share of renewables and waste in China decreased to 5.5%, and that of natural gas, oil products and electricity increased. Similar shifts, but to a lesser extent, could be seen in India. The share of renewables and waste in the consumption of energy diminished to 25.8%, while a considerable rise was recorded in the share of coal (from 10.5% to 17.6%), electricity, oil products and natural gas. A higher decrease in the share of renewables and waste in the consumption of energy – to 17.3% – was observed in Indonesia, while the share of oil products, coal, electricity and – insignificantly – that of natural gas increased. Positive trends regarding the transformation of the energy sector towards mitigating harmful impacts on the environment and climate were characteristic of Brazil, and especially of Nigeria, which achieved the highest share of renewables and waste in the consumption of energy – 78.5% in 2018. To recapitulate, significant changes can be observed comprising larger diversification of energy sources, combined with a decline in the consumption of energy in highly developed countries and a rise in the interest of dynamically developing countries (other than OECD countries) in renewable energy sources.
Fig 3. Renewables and waste shares in energy consumption by sources in 2000 and 2018 (in%).
Source: own elaboration based on Table 2.
Note: Countries ranked by share size in 2018.
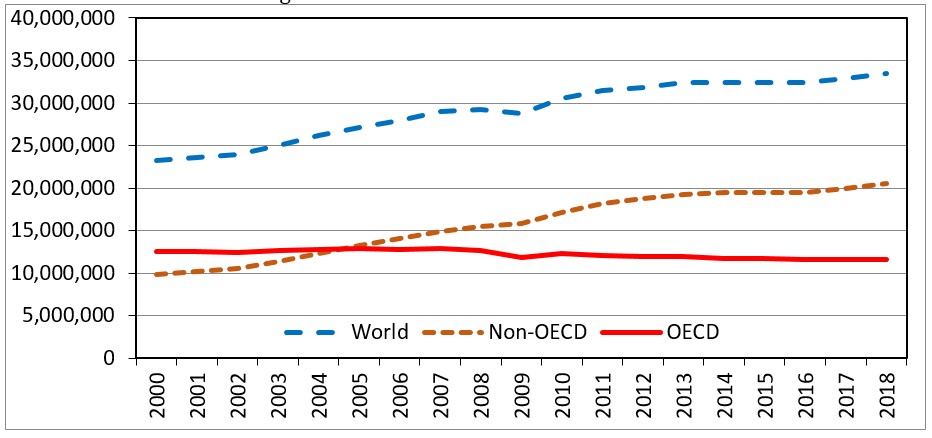
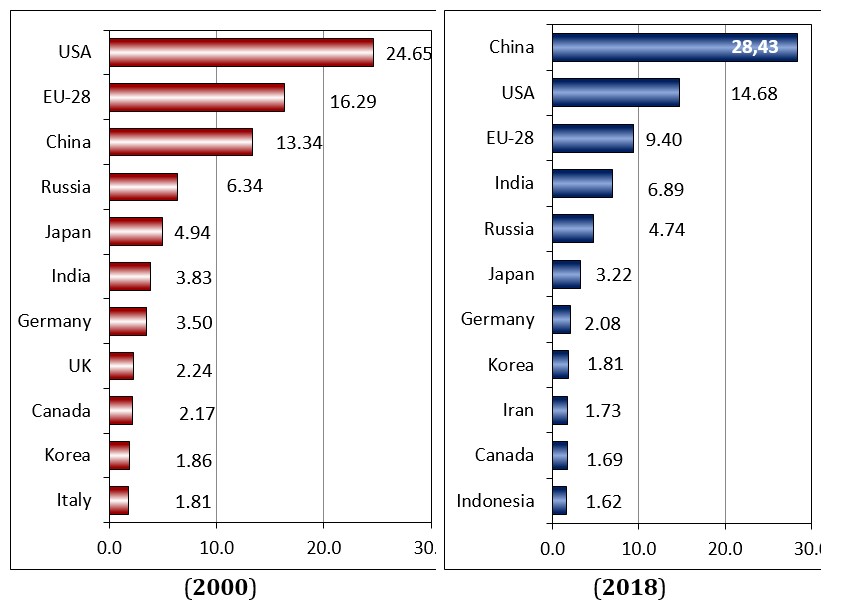
Figures 4 and 5 illustrate the changes in the levels of CO2 emissions and the share of countries with the highest emission levels in 2000 and 2018. Figure 4 demonstrates that in the analysed period the global emissions of CO2 definitely increased, with a small drop during the crisis in 2008-2009, but after the crisis the rate of surge was much slower. The US and EU’s share of CO2 emissions decreased significantly in 2018 compared to 2000, while China’s share increased more than twice as much and India’s nearly two times. As a result, the US and EU CO2 emissions (in total) were 4.35 pp lower than in China. Russia and highly developed countries decreased their share of CO2 emissions and became less important, while Iran and Indonesia joined the group of major emitters. The presented indicators confirm the fundamental changes in the group of major CO2 emitters: achievements in reducing EU and US emissions and a high increase in emissions from China, India, Iran and Indonesia (Figure 5).
Fig. 4: Emissions of CO2 from fuel combustion in OECD and non-OECD countries compared to the word in 2000 – 2018 (ktCO2).
Source: own elaboration based on (OECDa 2021).
In the 1990s, truly revolutionary structural changes commenced in the energy sector and the global economy. These changes were induced by multiple factors. Firstly, technological progress not only gives access to new gas and oil reserves, but especially new technologies facilitate a broader use of renewable and natural energy sources, which leads to their diversification. Secondly, the industrialisation of developing countries and the growth in the population contributed to a high increase in the requirement for energy, and countries having the greatest influence on the expanding consumption of energy – especially in the 21st century – are: China, India, South Korea and Brazil. Thirdly, the increase in demand, production and consumption of energy does have an impact on the natural environment and it is not only manifested by pollution but also by the more dangerous climate change. Counteracting this process requires cooperation and actions at a global level. In particular, greenhouse gas emissions should be limited. Two important documents regarding this issue were signed. The first binding agreement was the Kyoto Protocol (1997) but only 41 countries signed it (United Nations 1997). The Paris Agreement adopted in December 2015 by 196 states is much more important. Its signatories committed to reduce gas emissions and the greenhouse effect and achieve carbon neutrality by 2050 (United Nations 2015). These goals will not be easy to accomplish because respective countries attach different priority to environment security policy and to mitigating climate change. Transformation of the energy sector towards an increased share of renewable energy sources involves reconciling the economic growth objectives with energy security, and environment and climate security. Generally, more developed countries display more responsibility for the impact of economic activity on the environment, and more efficiently implement the plans of transition to low carbon energy sources. The leader is the European Union promoting green economy, and the country that is the least involved in adapting energy policy to climate challenges is Canada. The largest responsibility for disrupting the Earth’s natural balance rests on the main economic centres such as China, the United States and the European Union as well as India, Russia and Japan (Figure 5).
Fig. 5: Largest emitters of CO2 from fuel combustion in 2000 and 2018: shares in global CO2 emissions in %.
Source: own elaboration and calculations based on (OECDa 2021).
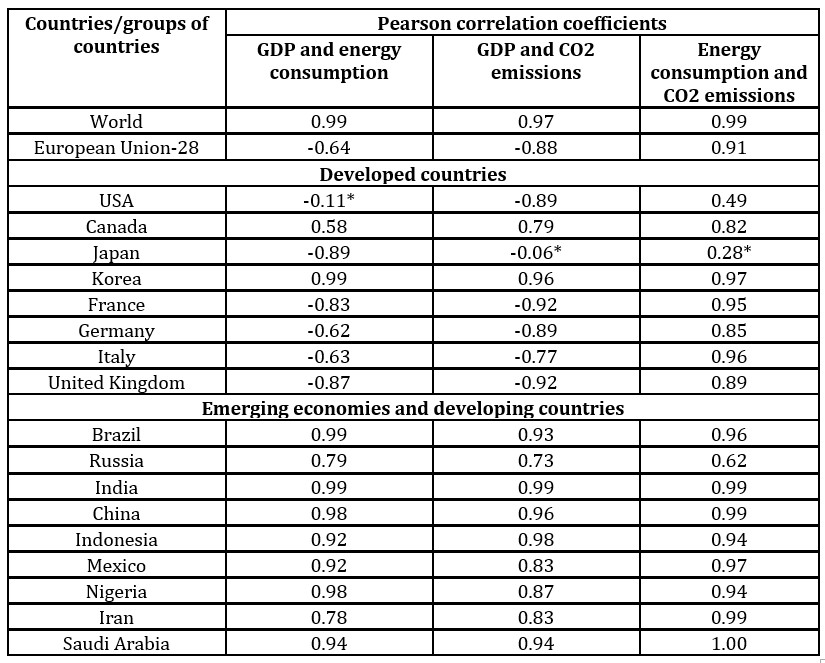
Table 3: Pearson correlation coefficient between GDP (billions $), total final energy consumption (ktoe) and CO2 emissions (KT) of major energy consumers and CO2 emitters in 2000-2018.
Note:
GDP based on Purchasing Power Parity in international dollars at current prices
All correlation coefficients are statistically significant at the 5% significance level (α = 0.05) except the ones marked with *
The values of the correlation coefficient fall within the range (-1, 1), positive values of the coefficient indicate changes in the variables occurring in the same direction, and negative values in the opposite direction. The closer the coefficient value is to ∣1∣, the stronger the interdependence, and the value zero means no correlation.
Source: own elaboration and calculations based on (OECDb 2021).
In the summary, we present the results of the correlation analysis (carried out using the Pearson’s linear correlation coefficient) regarding the correlation between the pairs of the following variables: GDP, energy consumption and CO2 emissions in 2000-2018 (Table 3). The study covered the largest highly developed economies, the largest emerging economies and developing countries, as well as the world economy and the EU-28. The obtained correlation coefficients express the following significant statistical interdependencies: 1) very strong relationships between GDP and energy consumption, GDP and CO2 emission, as well as between energy consumption and CO2 emissions at the global level (0.99-0.97), 2) in the EU-28 scale, the coefficients for GDP and energy consumption as well as GDP and CO2 emissions are negative, which means an inverse relationship. However, in the first case the coefficient of -0.64 is close to moderate while in the second case it is a strong inverse association. This means that despite the growing GDP in the EU in the analysed period, energy consumption and CO2 emissions decreased. On the other hand, the correlation between energy consumption and CO2 emissions in the EU is high (0.91) and not much lower than the global one. This may indicate that the transition to clean energy sources in the energy sector in Europe is still poorly advanced.
In the group of selected, the largest in the world, developed economies, the EU countries were characterized by negative correlation coefficients between GDP and energy consumption, as well as GDP and CO2 emissions, while high positive correlation coefficients indicated a strong relationship between growing energy consumption and increasing CO2 emissions. In Canada, all the correlations tested were positive, and in the USA and Japan, only some of them turned out to be statistically significant.
In the group of emerging economies and developing countries, there is high compliance – all three pairs of variables have a positive and generally strong correlation, only in Russia and Iran it was slightly weaker (except for the last pair in Iran).
Conclusions
The theoretical literature and empirical research show that the modern transformation of the energy sector significantly differs from the changes that took place at the earlier stages of technological progress. Currently, it takes place under different conditions of economic interdependence, the level and strength of which on a global scale have considerably increased due to the development of e-business and the liberalization of economies. The fundamental problem that necessitates changes in the structure of energy production sources are the climatic effects of growing energy consumption and greenhouse gas emissions.
The authors believe that energy security is a priority goal of sustainable development in the national, regional and global dimension. Its complexity requires new conceptualisation of energy, energy security and energy policy. Therefore, the authors focused on redefining the conceptual apparatus and formulating the research scheme that could constitute the basis for the implementation of the assumptions of empirical analysis. The introduction to the analysis defines the political and economic importance of energy in terms of its functions: as a production factor, as a strategic product, as a supply product (service) for households, and as a product that degrades the environment and causes climate change. The functions of energy defined in such a way determine a wide range of empirical analyses and assessments of the transformation process of the energy sector in the global dimension.
The energy policies of countries – the largest energy consumers and CO2 emitters – play a special role in the transition to clean and renewable energy sources. In the regional dimension, the effects of the transformation of the energy sector as well as the reduction of energy consumption and CO2 emissions achieved by the European Union deserve attention. It adopted a strategy to decarbonise energy production and increase the share of renewable raw materials in order to stop climate change.
The empirical analysis displays that the group of emerging economies belonging to the largest consumers and emitters of CO2 stood out in 2000-2018 with high GDP dynamics, but the growth rates differed significantly between countries (Table 1 and Figure 1). Thus, the opinion, quite common in the literature, that the dynamics of economic growth in emerging economies result in an increase in energy consumption and CO2 emissions is to some extent a simplification of the problem. More specifically, several countries are responsible for the rise in energy consumption and CO2 emissions, mainly China, India, Russia, Iran, Indonesia and Brazil. Indicators of energy consumption fell in Japan and the EU-28, while in the US there was a slight increase of 3.8%. The results of the US and the EU-28 in reducing CO2 emissions deserve special emphasis, as together they have a smaller share in global emissions than China. Japan, Russia and Canada also decreased their share in the global CO2 emissions. When assessing energy consumption and its impact on greenhouse gas emissions, its structure according to energy sources is of great importance. In the group of the largest energy consumers in 2000, Asian countries had a 63.1% share of energy from coal. In 2018 it rose to 71%, but it was not China that contributed to it, but India, Indonesia and, to a small extent, Japan. China has made progress in decarbonising its energy consumption by reducing the share of coal from 35.1% to 30.9%. In both the US and the EU, coal as an energy source has become meaningless. Among the European countries, limiting the use of coal in Russia would result in a qualitative improvement in the structure of energy consumption in the world. The good news is the growing share of renewables and electricity in energy consumption. Emerging economies stand out in this respect, but the trend of increasing renewable energy is not constant. In 2018, renewables’ shares in consumption declined substantially in China, India and Indonesia. Nigeria and Brazil can be considered model countries in the transformation of the energy sector (Table 2 and Figure 3).
Statistical data and correlation indicators (Tables 2, 3 and Figure 2) confirm hypothesis 1. The first six countries – the largest energy consumers in 2000-2018 – did not change, but China significantly increased its share in the world’s energy consumption from 11.1% to 20.7%. By contrast, the US and the EU have substantially decreased their shares. Apart from China, Iran and India also have exceptionally high rates of growth in energy consumption. The rates of participation in global CO2 emissions were similar: the top six emitters did not change, but the share of China and India increased, and the US, EU-28, Japan and Russia decreased their shares. The above-mentioned indicators partially confirm also hypothesis 2 concerning the process of transformation of the energy sector towards clean and renewable energy sources in the EU and other countries. This process is generally in its early stages in the EU and the US, but the persistence or increase in the share of coal in some Asian countries and Russia is worrying, as is the lack of consistency in the transition to renewable energy sources. In particular, there was a significant decline in renewables in 2018 in India, Indonesia, China and the world in general. In the EU-28, the transformation of the energy sector towards enlarging the share of renewables in consumption is not dynamic, but noticeable and with a clear upward trend.
Bach, D. and Newman, A. L. (2007), ‘The European regulatory state and global public policy: micro-institution and macro-influence, ’ Journal of European Public Policy, 14 (6), 827-846, doi: 10.1080/13501760701497659.
British Petroleum [BP], BP-Energy Outlook, 2019 edition, 1-73. [Online], [Retrieved September 20, 2021], Available: https://www.bp.com/content/dam/bp/business-sites/en/global/corporate/pdfs/energy-economics/energy-outlook/bp-energy-outlook-2019.pdf.
Cohen, B. J. (2008), ‘International Political Economy. An Intellectual History,’ Princeton University Press: NY, USA, ISBN 978-0-691-13659-4.
Consolidated version of the Treaty on the Functioning of the European Union [CVTFEU], OJEU, C 326/134-5, 26.10.2012.
Goldthau, A. and Sitter, N. (2014), ‘A liberal actor in a realist world? The Commission and the external dimension of the single market for energy,’ Journal of European Public Policy, 21(7), 1452-1472, doi: 10.1080/13501763.2014.912251.
Goldthau, A. and Sitter, (2020), ‘Horses for courses. The roles of IPE and Global Public Policy is global energy research,’ Policy and Society, 1-17, doi:10.1080/14494035.2020.1864100.
Herranz-Surralles, A. (2015), European External Energy Policy: Governance, Diplomacy and Sustainability. In ‘Sage Handbook of European Foreign Policy; Aarstad, A.K., Drieskens, E., Jørgensen, K.E., Laatikainen, K., Tonra, B. (ed), Sage, London, UK, 911-925, doi: 10.4135/9781473915190.n63.
International Energy Agency [IEA], Balances Database. [Online], [Retrieved September 15, 2021], Available: https://www.iea.org.
International Monetary Fund [IMF], World Economic Outlook Database, October 2020. [Online], [Retrieved September 10, 2021], Available: https://www.imf.org.
Keohane, R. O. (2009), ‘The old IPE and the new,’ Rev Int Polit Econ, 16 (1), 34–46, doi: 10.1080/09692290802524059.
Kuzemko, (2019), ‘Re-scaling IPE: local government, sustainable energy and change,’ Rev Int Polit Econ, 26 (1), 80-103, doi: 10.1080/09692290.2018.1527239.
Kuzemko, C., Lawrence, A. and Watson, M. (2019), ‘New directions in the international political economy of energy,’ Rev Int Polit Econ, 26(1), 1-24, doi: 0.1080/09692290.2018.1553796.
Lavenex, S. (2004), ‘EU external governance in ‘wider Europe’’, Journal of European Public Policy, 11(4), 680-700, doi: 10.1080/1350176042000248098.
Mucha-Leszko, B. and Kąkol, M. (2012), ‘Globalizacja i zmiany w układzie sił gospodarczych a międzynarodowy system walutowy.’ In ‘Globalizacja i regionalizacja we współczesnym świecie’, Molendowski, E. (ed), Wydawnictwo Uniwersytetu Ekonomicznego w Krakowie, Kraków, Poland, 315, ISBN 978-83-7252-586-4.
Mucha-Leszko, B. (2016), ‘Przyczyny słabego ożywienia koniunktury gospodarczej w strefie euro w świetle hipotezy o nowej sekularnej stagnacji,’ Prace Naukowe Uniwersytetu Ekonomicznego we Wrocławiu, 449, 436-449, doi: 10.15611/pn.2016.449.39.
Newell, P. (2019), ‘Transformismo or transformation? The global political economy of energy transitions,’ Rev Int Polit Econ, 26(1), 25-48, doi: 10.1080/09692290.2018.1511448.
Oatley, (2008), International Political Economy. Interests and Institutions in the Global Economy, Pearson Longman, Londyn, UK, 1-2, ISBN13 978-0-205-58980-7.
Organisation for Economic Co-operation and Development [OECDa], CO2 Emissions by Product and Flow Database. [Online], [Retrieved October 10, 2021], Available: https://www.oecd-ilibrary.org.
Organisation for Economic Co-operation and Development [OECDb], World Energy Balances Database. [Online], [Retrieved October 10, 2021], Available: https://www.oecd-ilibrary.org.
Romanowa, T. (2016), ‘Is Russian Energy Policy Towards the EU Only About Geopolitics? The Case of the Third Liberalisation Package,’ Geopolitics, 16 (4), 857-879, doi: 10.1080/14650045.2016.1155049.
Simola, (2018), Limited Interdependence in EU-Russia-Trade. In Post-Crimea Shift in EU-Russia Relation: From Fostering Interdependence to Managing Vulnerabilities; Raik, K., Racz, A. (ed), International Centre for Defence and Security: Tallin, EE, 138-139, ISBN 978-9949-7331-6-3.
United Nations, Adoption of the Paris Agreement, United Nations Framework Convention on Climate Change, FCCC/CP/2015/L.9/Rev.1, 12 December 2015, Annex: Paris Agreement, FCCC/CP/2015/L.9. [Online], [Retrieved October 25, 2021], Available:https://unfccc.int/resource/docs/2015/cop21/eng/l09r01.pdf.
United Nations. A Kyoto Protocol to the United Nations Framework Convention on Climate Change, Kyoto, 11 December 1997, Entry into force: 16 Feb 2005, No. 30822.
Wojcieszak, Ł. (2017), ‘Nord Stream 2 Pipeline. Role of German-Russian Energy Cooperation for Poland,’ American Journal of Sociological Research, 7 (3), 85-89, doi:10.5923/j.sociology.20170703.01.
Wojtas, M. (2017), ‘Przyczyny spowolnienia światowego handlu,’ Studia i Prace Wydziału Nauk Ekonomicznych i Zarządzania, 49(2), 75-87, doi: 10.18276/sip.2017.49/2-06.
Yergin, D. (2006), ‘Ensuring Energy Security,’ Foreign Aff, 85 (2), 69-82, doi: 10.2307/20031912.