Bucharest University of Economic Studies, Bucharest, Romania
Volume 2022,
Article ID 676927,
Journal of Eastern Europe Research in Business and Economics,
13 pages,
DOI: 10.5171/2022.676927
Received date: 15 March 2022; Accepted date: 12 July 2022; Published date: 22 August 2022
Academic Editor: Daniela Zirra
Cite this Article as:
Cristina ANGHELESCU (2022)," The COVID-19 Pandemic through the Lens of a Representative Economic Activity Index in the case of Selected Central and Eastern European Countries ", Journal of Eastern Europe Research in Business and Economics Vol. 2022 (2022), Article ID 676927, DOI: 10.5171/2022.676927
The COVID-19 pandemic has already struck a hard blow, affecting economies all over the world. At the current juncture, it still represents a relevant source of uncertainties, as new variants have recently emerged and witness a fast spread. To these adds the threat to economic activity induced by the ongoing war in Ukraine. In this context, a robust assessment of the current state of the economy is relevant to both policymakers – when formulating the mix of economic policies – and people outside public administration – for further decisions on consumption, saving and investment. The aim of this paper is to build a representative economic activity index in the case of Czechia, Hungary, Poland and Romania. Empirical evidence provided by the principal component analysis shows an incomplete pass-through of external shocks. The representative index for economic activity also points to temporary positive effects induced by policy measures introduced during the pandemic which could have been higher in the lack of existing structural deficiencies.
Keywords: economic activity, economic policies, crisis, principal component analysis
Introduction
After two years of COVID-19 pandemic, which since its outbreak has significantly affected economic activity worldwide, a new threat has recently appeared. The military conflict between Ukraine and Russia could jeopardize economic recovery. While in most European countries the direct exposure to these countries is rather small, the indirect effects have the potential to leave a deep mark on economic activity. At the current juncture, despite favorable prospects amid the progress of vaccination campaigns and the implementation of first projects financed through the Next Generation EU program, economic recovery could be a long-lasting process.
Under these circumstances, the acknowledgment of the current state of the economy is essential. Policymakers should have a prompt response to the potential large spillovers of the ongoing war. While there are currently great financial opportunities on the back of the Next Generation EU program, the investment strategy has recently gained more importance. National Plans provide various reforms and investment projects. Yet, policymakers should prioritize the initiatives aiming to strengthen the resilience of economies to external shocks. At the same time, a comprehensive understanding of the economy through the lens of various macroeconomic indicators could prove useful even for people not necessarily working in the economic field. For instance, understanding the starting point of the economy (its current state) might help forming expectations regarding its future evolution and further decisions on consumption and saving.
The aim of this paper is to provide information regarding the current state of the economy by building an index relevant to economic activity. While the gross domestic product is usually considered for such studies, this analysis focuses on a wide set of macroeconomic indicators in order to obtain a broad perspective on the economic activity as a whole. At the same time, the mix of economic policies such as the fiscal and revenue ones, monetary policy and the exchange rate one is also considered. Furthermore, external shocks are also accounted for. Overall, the research objective is to summarize information from relevant macroeconomic indicators in order to obtain a representative index for economic activity. Economy as a whole is a complex science and the independent evolution of some variables could be misleading, as some macroeconomic effects are produced with a lag. However, the current analysis aims to aggregate information from various economic sectors for creating a large perspective on the economy as a whole.
The analysis provides information in the case of selected Central and Eastern European (CEE) countries, namely Czechia, Hungary, Poland and Romania. The economic activity index is built using the principal component analysis (PCA) and, as previously mentioned, embodies a large set of economic variables. Effects of the COVID-19 pandemic are compared with the implications of the financial crisis, also taking into consideration the impact of policy measures adopted in order to alleviate the adverse economic effects. The estimated economic activity index also provides information regarding the latest macroeconomic developments.
Results could provide useful information for policymakers. By highlighting potential structural deficiencies, the economic activity index might signal the need to implement structural reforms as fast as possible in order to increase the resilience to adverse shocks such as the ongoing geopolitical conflicts. Moreover, by analyzing the speed of recovery from the pandemic crisis and the behavior of CEE countries during previous economic crises, the current paper could also provide some useful information for future forecasts, as the starting point of the economy is of great importance when making predictions. At the same time, regular people could also benefit in terms of expectations’ formation.
At first, relevant economic literature is summarized. The analysis of the state of economies in general and of the business cycle in particular has been of interest for a long time and there are different approaches trying to provide a comprehensive understanding of the state of the economy. Next, data and methodology are described. Variables included in the analysis are therefore highlighted, as well as the reasons for choosing them and the required data transformations for the best fit in the model. At the same time, the methodology used, namely the PCA, is described. Lastly, results are presented, also highlighting policy implications. The paper concludes with main findings and also some policy recommendations.
Literature Review
The analysis of economic activity has always been an important subject in related literature. A proper assessment of the current state of the economy, as well as understanding its past evolutions, have been of great concern for economists all over the world. Yet, capturing all influences affecting an economy is a difficult task. Even the most complex econometric models including large datasets sometimes fail to embody all factors with a potential significant impact on economic activity.
The state of the economy is commonly analyzed through business cycles. Those are formally defined as fluctuations in the aggregate economic activity (Grigoras, 2015). It is therefore implied that economic activity as a whole should be considered when accounting for business cycles. Ever since the formal definition of this concept, several research directions have appeared. For instance, there are various approaches of measuring business cycles. While the classical one and the growth cycle view are the most common in economic literature, Bortz (2021) identifies at least six theories regarding business fluctuations.
Furthermore, there are several econometric tools used for capturing the state of the economy. The most common ones and, at the same time, fast to implement, are the univariate filters, such as the Hodrick-Prescott one. However, given the end-sample bias related to this kind of filter and other problems identified by Hamilton (2018), alternative methods are recommended. Those include other univariate filters such as the Band-Pass one (Alvarez, 2017) or even multivariate filters such as various approaches using the Kalman filter (Poncela, 2021).
In the case of Central and Eastern European countries, there are also plenty of studies focusing on the measurement of business cycles. As regards business cycles in Romania, Caraiani (2010) dates business cycles using a Markov Switching AR approach. The author focuses on the Romanian industrial production index. Dumitru (2010) explores various econometric tools, including the principal component analysis. In case of Poland, Mazur (2017) uses a flexible Fourier form also taking into consideration the industrial production. More generally, CEE countries are studied in tandem in order to highlight a potential synchronization in terms of their business cycles. Berger et al. (2021) highlight the existence of a global business cycle, more pregnant in case of certain development group cycles or regional cycles such as CEE countries.
In order to capture the simultaneous impact of a wide set of indicators, the principal component analysis proves to be a useful tool. Andrle, Bruha and Solmaz (2017), by using a dynamic principal component analysis in the case of OECD countries, show that the business cycles of key macroeconomic data can be largely explained by a single source of variation. Borraz et al. (2020) build a representative index using the principal component analysis for studying sales behavior and their relationship with market conditions. The authors find a common structure of the analyzed indicators, thus highlighting the existing linkages between the studied indicators. The principal component analysis can also play an important role in quantifying a global economic policy uncertainty index, as shown by Dai et al. (2019). The authors find that the index built based on the principal component analysis performs better than other measurements for policy uncertainty.
At the current juncture, as a response to the novel sanitary crisis and the high level of uncertainties regarding its socio-economic impact, research has recently intensified in this area. In order to capture better specific effects, classical approaches have adapted to the current conditions, and thus have started accounting more for specific indicators. As a consequence, in the modelling of business cycles, Kufel et al. (2021) introduce energy consumption and Cizmesija (2021) uses the economic sentiment indicator. At the same time, the principal component analysis gains momentum given its ability to embody a large set of indicators. In this regard, Gehringer and Mayer (2021) build a business cycle indicator for Germany compiling 20 relevant variables. While the above-mentioned papers focus on estimating the business cycles, there are also plenty of works addressing the significant reconfigurations brought by the pandemic to economic activity (Albu et al., 2020; Dimian et al., 2021) or trying to assess the effectiveness of the mix of economic policies.
In case of the impact of policies on economic activity, Cudik (2021) studies the effects of the fiscal policy using a global vector autoregressive model. The author highlights beneficial effects of discretionary measures adopted by national authorities. In case of the monetary policy, Huber (2021) analyzes the actions of the Fed. Yet, the combination of various economic policies is rather limited in related literature. Asongu (2020) studies the mix of such policies and concludes that there is high heterogeneity among countries.
Methodology and data
Methodology
A business cycle assumes fluctuations occurring at the stage of aggregate economic activity. This consists of simultaneous expansions or recessions of more sectors of the economy. In order to obtain a large view on the economic activity as a whole, it was considered a model aggregating an extended set of variables specific to various sectors. Furthermore, for obtaining the simultaneous dynamics of more variables, factor models are usually used. Through such models, latent factors specific to all analyzed variables are extracted. Such models are used for summarizing information from a large set of indicators. In this regard, such an analysis is recommended including in the context of a proper evaluation of the state of the economy.
A type of factor model is the principal component analysis (PCA). The first description of this method relates to Pearson (1901). However, it is commonly attributed to the work of Hotelling (1933). This is a statistical procedure using an orthogonal transformation in order to convert a set of observations of variables possibly correlated into a set of values of variables uncorrelated called principal components. Their number is lower or equal to the number of the variables initially included in the model. Each component is a linear combination of the initial variables and the first component explains the largest variation from the initial set of data. The second principal component explains the second largest variation from the initial dataset not explained by the first component and so on.
One of the main characteristics of the method is that it can identify some patterns in data and it can extract information so that it highlights existing similarities or differences. After the identification of these patterns, namely the components, the dataset can be compressed without losing a significant amount of information. Therefore, the aim of extracting principal components is reducing the dimensions of the database. Technically, PCA is based on the spectral decomposition of the covariance matrix or the correlation matrix. If PCA is made upon a correlation matrix, then results will be influenced only by the yield correlation. Yet, if the PCA input is a covariance matrix, then both the yield and their volatility are of interest. Therefore, in order to obtain proper results, it is necessary that data are standardized.
PCA starts with choosing the dataset. All variables are embodied in a matrix (equation 1) and after this first step, its related covariance matrix is computed (equation 2). All data have the same frequency and cover the same time span. It is assumed that each column of the data matrix has a mean equal to 0 and the variance equal to 1.
X is a (Txn) data matrix containing the variables introduced in PCA;
xi represents the i column of X representing a certain variable out of the n variables; T represents the number of observations; V is the covariance matrix of the included variables.
Matrix V is the yield correlation matrix when data series are standardized. The next step is computing the eigenvalues matrix. When the number of observations of each variable is higher than the total number of variables, all eigenvalues of V are positive. Given the eigenvalues matrix and the one containing the variables, the principal component matrix can be computed (equation 3).
W is the orthogonal matrix of the eigenvectors of V , the covariance matrix; P is the matrix of principal components.
Consequently, matrix P contains principal components of the covariance matrix given the initial dataset. Each principal component is defined as a linear combination of the columns within matrix X, where the weights are chosen so that principal components are not correlated and the first component explains the largest variation of the dataset and so on. For instance, the m principal component of the covariance matrix V is defined as the m column of matrix P and it can be written as described in equations (4) – (5).
Wm is the eigenvector corresponding to the m eigenvalue; xk represents the n column of representing a certain variable; Pmis the m principal component of the covariance matrix.
One step further, each variable of the initial dataset can be written as a weighted sum between its related eigenvector and the associated principal component of the covariance matrix (equation 6).
In a system with highly correlated variables, independent sources of variation are limited. Therefore, the largest variation of the system can be explained by a reduced number of principal components. In this regard, in related literature, the first three components, explaining more than 70 percent of the dataset variation, are usually considered.
To sum up, PCA is a useful tool when the analysis of a large dataset is implied. Its applications in modern economics are widespread.
Data
The methodology described above was applied to a set of indicators specific to several CEE countries, namely Romania, Czechia, Poland and Hungary. Economies with similar characteristics have been chosen, such as those not yet belonging to the Euro Area, but are part of the European Union, have similar monetary policy regimes and comparable economic scales.
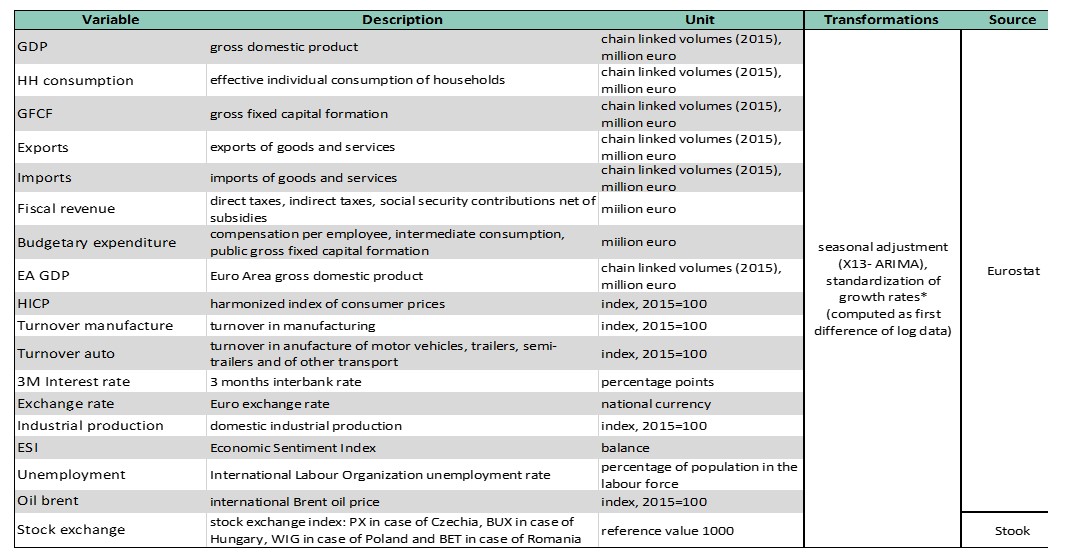
Table 1. Data included in the PCA
*except for interest rates and the unemployment rate Source: author’s formatting based on Eurostat and Stook
In order to obtain a wide picture of economic activity in CEE countries, a large set of macroeconomic indicators covering various sectors have been chosen. Moreover, for the evaluation of the impact of economic policies mix, indicators specific to both the fiscal and revenue policies and the monetary and exchange rate policies have been analyzed. Database consists of the indicators described in Table 1 and it is common in the case of all selected CEE countries.
Data have a quarterly frequency. Monthly indicators were aggregated to a quarterly frequency using the average of monthly observations. Data sample covers 2001, quarter 1 – 2021, quarter 3. Data were seasonally adjusted using the X-13- ARIMA method. Except for interest rates and the unemployment rate, defined as percentage points, growth rates have been computed. Furthermore, data transformation is specific to PCA models, namely standardizing variables. As regards data source, the Eurostat database was used, as well as stock market online database.
Results
As previously mentioned, the analysis embodies an extended set of macroeconomic variables. Various economic sectors were considered: from the industrial one to the external sector. At the same time, indicators specific to economic policies were also taken into consideration. The aim was building a representative index for the selected CEE economies and its comparison with the actual data for economic growth. Such an index could provide a large view over the economic picture as a whole. Furthermore, by comparing the representative index based on the extended dataset with the actual figures for GDP, possible effects in the lack of structural deficiencies or conjunctural factors that might limit the impact of economic policies are also highlighted.
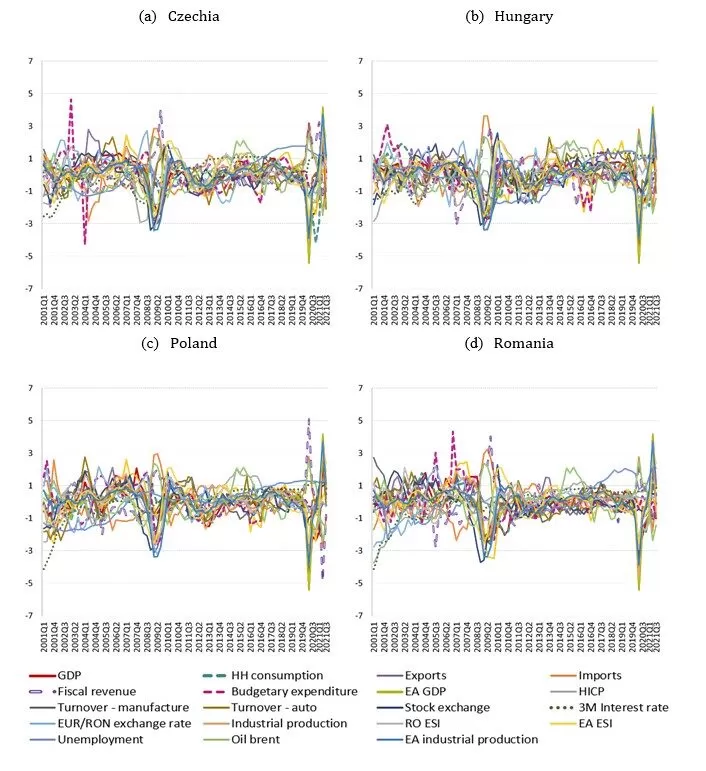
Figure 1. Standardized variables included in PCA
Source: author’s calculations
Figure 1 shows the dynamics of the standardized indicators included in PCA in the case of selected CEE countries. In the case of all countries, the variables, both domestic and external ones, are highly correlated with the series of GDP. Household consumption is among the variables having the highest correlation, accounting for about 0.9. Furthermore, foreign variables such as Euro Area GDP or Euro Area industrial production also share increased correlation rates. Instead, the stock exchange market in Romania is not very developed, as the correlation with GDP is rather low. A similar evolution can be seen in case of the unemployment rate, amid existing labor market rigidities.
In the case of Romania, in the period of pre-accession to the European Union, namely 2005-2007, the fiscal and budgetary policy was a strong expansionary one. Spillovers stemming from such policies could be felt by both consumption and gross fixed capital formation. Figure 1 also highlights the co-movement of most economic indicators during both the 2008 financial crisis and the 2020 pandemic one.
As regards the rest of CEE countries, similar figures are obtained. The variables are highly correlated with the series of GDP. Labor market rigidities also prevail, especially in the case of Poland and Czechia. Yet, the stock exchange market in the rest of the selected CEE countries seems to be more correlated with GDP than in the case of Romania.
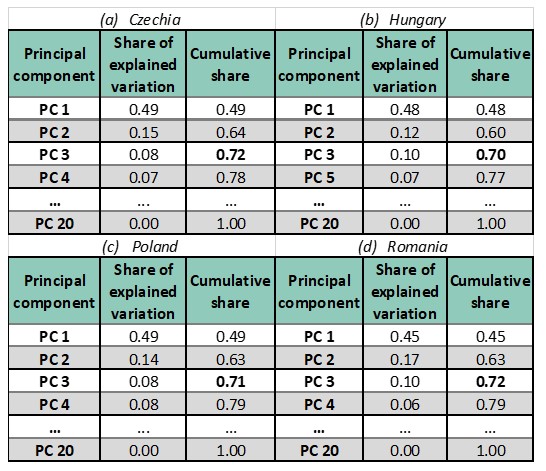
Table 2. Extracting principal components
Source: author’s calculations
However, data selection and its transformation are the prequel to building a representative index for economic activity. Using standardized data, principal components were extracted. The first principal component (denoted PC1) explains the most variation of the entire set of indicators. The second principal component, namely PC2, explains the second largest variation of the set which has not been explained by PC1 and so on. In case of all selected CEE countries, the first three components explain over 70 percent of the variability of the series (Table 2).
The index of economic activity was built starting from the first three principal components. It was computed as a weighted sum according to the relative importance of the three components. The index reflects a large economic picture, incorporating unaltered effects of economic policies. At the same time, by including foreign variables, spillover effects stemming from the external environment are higher.
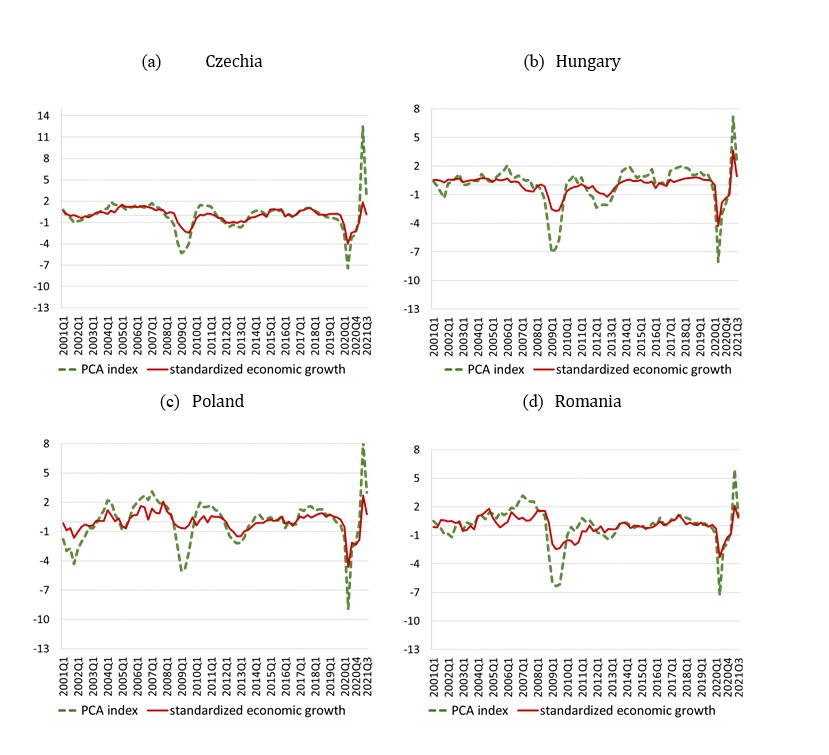
Figure 2. Representative index for economic activity
Source: author’s calculations
In this regard, one should notice that the PCA index reflects deeper contractions during both episodes of the crisis in the case of all selected CEE countries. This evolution relates to the inclusion of foreign variables. Given external shocks, economic contractions could have been deeper in the case of a pass-through coefficient equal to one. This is especially the case of Poland, which the expansionary fiscal measure conducted before the financial crisis helped the economy alleviate the adverse economic effects. However, despite a low impact on the overall GDP, the PCA index shows that the economic environment as a whole also deteriorated in Poland. A similar picture is shown in case of the 2020 COVID-19 pandemic, yet of a higher magnitude.
As regards the impact of the economic policies mix, the stimulative packages would have had slightly higher effects during the financial crisis and significant higher effects during the pandemic one. In the case of the latter one, the volume of expenditure allotted to economic recovery and alleviating adverse economic effects was more consistent as compared to the one considered during the financial crisis. It is shown that in the lack of structural deficiencies, economic recovery could have been a faster one at the current juncture. In all analyzed economies, similar evolutions could be noticed (yet of different magnitudes). It is noticed that in the case of Czechia and Poland, the response to fiscal stimulus during the pandemic crisis should have been significantly higher (especially in the case of Czechia). However, an important role in quantifying the magnitude of fiscal and revenue polices effects is played by the composition of the fiscal shock. In case of Czechia, authorities implemented a higher stimulus based on revenues as compared to the rest of the countries. In this context, the discrepancy between the PCA index and the actual data might also reflect a low efficiency of the revenue policy. This result is actually confirmed by studies in related literature, where revenue multipliers are evaluated to be rather small and less efficient than that of expenditure.
Similar evolutions could also be seen during the financial crisis. As a response to this adverse shock, national authorities also adopted support measures, mainly based on high investment. However, PCA index shows that in the lack of structural deficiencies and in the absence of conjunctural factors alleviating the impact of economic policies, the recovery would have been a faster one also in the case of this crisis. Results are confirmed by Necula et al. (2022), pointing to a similar evolution of the PCA index in case of selected CEE countries.
As a whole, PCA indicates the possibility of a faster recovery of economic activity. The economic environment clearly benefitted from the ease in social distancing measures as economies gradually opened. Yet, the PCA index points to potential influences alleviating the impact of economic policies. This feature is highlighted in all cases of selected CEE economies. Furthermore, the inclusion of variables describing the foreign environment leads to increased spillover effects, with an adverse impact on economic growth during both crises. Under these circumstances, countries should implement structural reforms as fast as possible in order to increase the resilience of national economies. In this regard, the Next Generation EU program, especially through the Recovery and Resilience Fund as its main instrument, is a unique opportunity which should be considered by countries in order to address structural deficiencies.
As regards the structural reforms that should be implemented by selected CEE countries, the PCA index shows a potential higher impact of the fiscal and revenue policy measures. The limited efficiency of this type of policy is a common finding in related literature. Yet, all CEE countries should make use of Recovery and Resilience Funds in order to increase the future response of GDP to such measures. For instance, during the pandemic, the Czech authorities heavily relied on revenue measures, which proved to have a short-lived effect. In this context, authorities should focus on reforms related to this area. Furthermore, given the need for all selected CEE countries to correct the fiscal slippages during the pandemic, reforms targeting national fiscal administration (for instance, improving the tax collection) are also recommended.
Apart from reforms in the field of the fiscal and revenue policies, other measures should aim at reducing labor market deficiencies. This is especially relevant in the case of countries having strong rigidities or the ones dealing with skill mismatches. The low correlation rate between labor market indicators in Romania and Poland could highlight potential structural deficiencies. Furthermore, in the case of Romania, data show a less developed stock exchange. In this regard, reforms could also aim at developing the stock exchange in this country.
At the same time, investment within the National Recovery and Resilience Plans should not be ignored, especially in terms of infrastructure, transition to a green economy and a higher level of digitalization. This is available in the case of all selected CEE countries.
Concluding Remarks
At the current juncture, the future evolution of the economic environment is highly uncertain, as numerous risks and uncertainties are stemming. The ongoing war between Ukraine and Russia could jeopardize economic recovery after the adverse shocks induced by the COVID-19 pandemic, despite favorable conditions amid the progress made by vaccination campaigns and the initial steps taken within the NGEU program.
In Central and Eastern Europe countries, the sanitary crisis had a significant impact on economic growth. By analyzing an index representative for economic activity as a whole, empirical evidence shows deep contractions in all selected CEE countries. However, the same index points to a V-shaped recovery. As compared to the 2008 financial crisis, the PCA index highlights a faster recovery at the current juncture. The gradual reopening of the economies in tandem with more experience in managing the pandemic has led to a strong rebound in economic activity, especially in the last quarter of 2020 and the first quarter of 2021. This evolution also relates to base effects. Nevertheless, starting the second quarter of 2021, economic activity tends to become sluggish. Given that the PCA index also embodies effects of the mix of economic policies, empirical evidence points to a temporary effect of support measures adopted during the pandemic. Those effects helped alleviating the adverse shocks induced by the sanitary crisis, yet their effect is rather a short-lived one. Furthermore, the PCA index shows a potential higher effect of such policies, explaining the gap between the evaluated PCA index and actual data for the gross domestic product. Similar evolutions are seen during the financial crisis. In this context, the effectiveness of economic policies such as the fiscal or monetary one might be jeopardized by the existence of structural deficiencies in all selected CEE countries.
At the same time, the PCA index contains foreign variables. If the pass-through of external shocks into domestic economies was complete, the impact of both the financial crisis and the sanitary one would have been significantly deeper. In this context, in the case of Poland, the country which barely felt the effects of the 2008 financial crisis, the response to this shock could have been of a similar magnitude with the rest of CEE countries. Under these circumstances, the PCA index highlights potential rigidities not allowing the full transmission of external shocks.
To sum up, the PCA index offers a wide perspective on the state of the economy. At the current juncture, it is shown that economic activity tends to become sluggish. Given the threat posed by escalating geopolitical tensions, authorities should focus on implementing reforms as fast as possible. Within the NGEU program, there are both opportunities for financing reforms and investment projects. However, in the context of empirical evidence provided by the representative index, in order to maximize the effectiveness of future economic policies’ measures, structural deficiencies should be addressed. As a result, reforms should be implemented with high priority. For instance, CEE countries should consider reforms in the field of fiscal and revenue policies in order to increase the efficiency of future measures. Potential labor market deficiencies should also be addressed. Overall, policymakers should spend the NGEU resources as fast as possible in order to help economies fully recover after the pandemic and prevent recessions in the context of the escalating geopolitical tensions.
Yet, the PCA index has its limitations. It embodies the same macroeconomic indicators for all selected CEE countries. Even though it accounts for various fields, from economic policies to the financial market or labor market, it does not account for country specific characteristics. In this regard, future research aims to provide empirical evidence accounting for country specific characteristics, analyzing the most important economic fields, rather than providing a general outlook.
Acknowledgment
This paper was funded by the Research Project „Sanitary crisis versus financial crisis. Impact on the efficiency of the economic policy mix” from the Bucharest University of Economic Studies during the PhD program.
References
• Albu, L., C. Preda, R. Lupu, C. Dobrota, G. Calin and C. Boghicevici (2020), ‘Estimates of dynamics of the COVID-19 pandemic and of its impact on the economy’, Romanian Journal of Economic Forecasting, 23: 5-17. • Alvarez, L. (2017), ‘Business cycle estimation with high-pass and band-pass local polynomial regression’, Econometrics, 5(1):1 • Andrle, M., Bruha, J., Solmaz, S (2017), ‘On the sources of business cycles: implications for DSGE models’, European Central Bank, Working Paper Series, No. 2058 • Asongu, S., Diop, S., Nnanna, J. (2021), ‘The geography of the effectiveness and consequences of COVID-19 measures: global evidence’, Journal of Public Affairs, 21(4) • Berger, T. et al. (2021), ‘Testing for international business cycles: A multilevel factor model with stochastic factor selection’, Journal of Economic Dynamics & Control, 128(3) • Borraz, F. et al. (2020), ‘Price, sales and the business cycle: a time series principal component analysis’, Banco Central del Uruguay, Working Paper no 002-2020 • Bortz, P. (2021), ‘Keynes’s theories of the business cycle: evolution and contemporary relevance’, Levy Economics Institute, Working Paper no. 986 • Caraiani, P. (2010), ‘Modeling business cycles in the Romanian economy using the Markov Switching approach’, Romanian Journal of Economic Forecasting, 13(1), 130-136 • Chudik, A., Mohaddes, K., Raissi, M. (2021), ‘COVID-19 fiscal support and its effectiveness’, Economic Research Forum, Working Paper no. 1465 • Cizmesija, M., Skrinjaric, T. (2021), ‘Economic sentiment and business cycles: a spillover methodology approach’, Economic Systems, 45(1), 100770 • Dai, P., Xiong, X., Zhou, W. (2020), ‘A global economic policy uncertainty index from principal component analysis’, Finance Research Letters, 40(4) • Dimian, G. C., S. A. Apostu, M. D. Vasilescu, M. I. Aceleanu, and J. Jablonsky, (2021), ‘Vulnerability and resilience in health crises. Evidence from European countries’, Technological and Economic Development of Economy, 27, 783–810 • Dumitru, I., Dumitru, I. (2010), ‘Business cycle correlation of the new member states with Eurozone – the case of Romania’, Romanian Journal of Economic Forecasting, 13(4), 16-31 • Gehringer, A., Mayer, T. (2021), ‘Measuring the business cycle chronology with a novel business cycle indicator for Germany’, Journal of Business Cycle Research, 17, 71-89 • Grigoraș, V., Stanciu, I. (2015), ‘Business cycle dating and properties’, National Bank of Romania, Occasional Papers no. 14 • Hamilton, J. (2018), ‘Why you should never use the Hodrick-Prescott filter’, The Review of Economics and Statistics, MIT Press, vol 100(5), pp. 831-843
• Huber, F., Feldkircher, M., Pfarrhofer, M. (2021), ‘Measuring the effectiveness of US monetary policy during the COVID-19 recession’, Scottish Journal of Political Economy, 68(7) • Kufel, T. et al. (2021), ‘Do COVID-19 lock-downs affect business cycles? Analysis using energy consumption cycle clock for selected European countries’, Energies, 15(1), 340 • Mazur, B. (2017), ‘Probabilistic predictive analysis of business cycle fluctuations in Polish economy’, Equilibrium, Quarterly Journal of Economics and Economic Policy, 12(3), 435-452 • Necula et al. (2022), ‘Quantifying the Probability of a Recession in Selected Central and Eastern European Countries’, Economic Research Ekonomska Istraživanja, DOI: 10.1080/1331677X.2022.2073460 • Poncela, P., Ruiz, E., Miranda, K. (2021), ‘Factor extraction using Kalman filter and smoothing: this is not just another survey’, International Journal of Forecasting, 37(4), pp. 1399-1425