Alexandra Vintila, Mihai Daniel Roman, Irina-Maria Trucmel and Andreea Gabriela Capbun
Bucharest University of Economic Studies, Bucharest, Romania
Volume 2022,
Article ID 932621,
Journal of Eastern Europe Research in Business and Economics,
14 pages,
DOI: 10.5171/2022.932621
Received date: 24 March 2022; Accepted date: 7 August 2022; Published date: 9 November 2022
Academic Editor: Claudiu Tiberiu Albulescu
Cite this Article as:
Alexandra Vintila, Mihai Daniel Roman, Irina-Maria Trucmel and Andreea Gabriela Capbun (2022)," A Cournot Model Applied on the European Natural Gas Market “, Journal of Eastern Europe Research in Business and Economics Vol. 2022 (2022), Article ID 932621,
DOI: 10.5171/2022.932621
The existence of several different degrees of restructuring, uneven dynamics, the transition from a natural monopoly to a competitive market with new strategic and economic opportunities are among the defining features of the natural gas market that transform it into an important pillar of the economy. Since in such an oligopolistic market, the actors must define a strategic and competitive advantage with positive effects on the competitive environment. In this context, game theory can be an essential tool for the decision-making process depending on the dynamics of asymmetric information. The main purposes of the paper are to analyze the degree of European gas market concentration and to determine, using a game theory model, the production, the price and the profits equilibrium levels for the main producers. The variables used in the analysis are natural gas countries’ productions and exports, price and market shares for 1992-2019 period for the main European producers. In order to determine the European gas market concentration, we use the Hirschman-Herfindahl concentration index. This index indicates the existence of an oligopolistic market with Russia, the United Kingdom and Norway in dominant positions. Using a quantity-oriented Cournot model, we determine the equilibrium gas price and quantities and we show the fact that these are significantly different from the average values of the reference period only for Russia due to its dominant position on this market. Our analysis highlights Russian’s dominant position in the European gas market and suggests its replacement by other suppliers.
Keywords: European natural gas market, Cournot model, market concentration, Nash equilibrium
Introduction
One of the most important primary energy sources and primary drivers for energy security strategy is natural gas. This key strategic component represents a one fifth of all primary energy used in Europe market, one of the three major regional markets along with North American and Asian markets. The overall trends show that the European gas market has developed steadily. This is due to the degree of competition between countries that can improve a country’s economic performance and opens up business opportunities. Competition on natural gas market became a challenge because there are players with a dominant and stable position in the market (i.e Russia). In this sense, the aim was to create a competitive framework through a wider restructure and a rigorous control over the players’ behavior, the efficient regulation of the production, storage and transport infrastructure as well as the regulation of the price. Also, this set of tools aims to reduce price risks and volume risks. The natural gas market can provide incentives that can change the export behavior for a certain firm. Russia’s growing dependence on natural gas has turned this regional gas producer and exporter into a pricesetter, leading to the construction of a diversification strategy. Like any substitutable good, the price of gas is directly dependent on the evolution of alternative fuel prices, especially on the variation of the price of oil. The transition from vertically integrated monopolies to competitive structures has influenced the formation of prices. Thus, there has been a transit from indexed prices or government-controlled prices to a price mechanism defined by the market forces of the gas industry. The recent market dynamics have led to an increase in uncertainty regarding the price and the quantity supplied, the main drivers being the commercial and geopolitical factors, the weather conditions, level of economic growth, war. On the natural gas market, every firm seeks to adopt a model of efficiency along the production chain in order to gain a competitive advantage. Gazprom, one of the firms with a dominant position on the natural gas market, uses green technologies in production chain. The current conditions on the market require the optimization of the gas infrastructure, especially that of storage, as well as the optimization of the set of instruments for security of supply.
The current war between Ukraine and Russia, one of the most important natural gas producing countries, is creating a series of tensions in the European gas market. The president of Russia has signed a decree obliging foreign buyers to pay in rubles for Russian gas to supply them with natural gas. This action has been seen at European level as blackmail, as it violates the contractual conditions. Countries such as the United Kingdom, France and Germany, heavily dependent on imports of natural gas from Russia, have rejected this request. The European Commission argues that European countries should not consider Russia’s request if concluded supply contracts stipulate payment in euros or dollars.
Recently, a record amount of liquefied gases from the United States has been imported into Europe. The United States intends to encourage Europe to abandon its dependence on both Russian gas and the Nord Stream 2 project in favor of its own liquefied gas reserves. After the invasion of Ukraine, several oil companies such as ExxonMobil, Shell, Bp, Equinor suspended their Russian gas and oil operations Russia is an essential player on the international market considering strategic behavior and trade reallocation. We address the impact of Russia’s position on the equilibrium quantities to assess if there are any significant differences compared to the actual quantities.
Visualizing the strategic interactions, both social and economic, existing on the natural gas market can be easily done by applying the tools offered by game theory. As a branch of microeconomics, game theory provides a framework based on the construction of models that allow the modeling of the behaviors of rational players, especially in the presence of information asymmetry and stochastic choices. We talk about asymmetrically distributed information when one of the parties involved in the economic game has an informational advantage over the other. In this case, the information is intentionally incomplete and manipulated by certain economic agents. Improper allocation of resources, loss of economic well-being are the result of the existence of information asymmetry. Its presence implies the deformation of the incentives of the economic agents, thus leading to the appearance of inefficiency. Therefore, the ability to provide useful tools that allow us to model real cases with multiple interacting decision makers is one of the main values of game theory. By applying this research tool, the aim is to improve the decision-making processes.
We observed there is a less explored area on studying the oligopolistic nature of the European gas market. Through our paper, we aim to contribute to the existing literature by applying concentration indices to highlight the dispersion of production and reveal the oligopol structure. Similar to Kalashnikov and Kalashnykova (2008), we conducted a quantity-oriented mathematical analysis by using specific models of game theory based on empirical data. However, we particularly focus on the main producers in Europe to highlight the main features of the European gas market in terms of competition. According to Hoayek et al. (2020), the Cournot’s acceptance rate in characterizing players’ behavior is 51%. We used the Cournot model to identify the main similarities or differences between the equilibrium quantities and the equilibrium price in comparison with registered quantities by the main manufacturers on this market. The analysis is based on publicly available annual data retrieved from data.org.un and ourworldindata.org from 1992 to 2019 and the costs are calibrated based on reports provided by Rystad Energy. Our findings are consistent with the evolution of the analyzed market.
The structure of the paper is designed as follows. In the first part, we emphasize the most relevant theoretical contributions from game theory and analysis of natural gas market to present the framework for the research objectives of interest. The second part reveals the results of the competition analysis between the main natural gas producing countries, namely description of market. The following section presents the methodology and the model used to analyze the competition on the natural gas market and we determine the equilibrium quantities for the European gas market in terms of game theory. The paper ends with a summarization of our findings along with identifying further research.
Literature Review
Since the behavior of companies on the oligopoly market presents the characteristics of a strategic game, game theory is an important tool for understanding and modeling both the basic principles and complex problems of oligopoly. The action of each player directly influences the level of demand of the opponents, thus making a distinction between perfect competition and oligopoly. The oligopoly model implies the existence of an interdependence between players that can also lead to anti-competitive agreements. The Cournot competition is often used in the classic approach to the oligopoly alongside the Bertrand and Stackelberg competition. Friedman (1977), Harris and Wiens (1980), Shapiro (1980), Daughety (1988), De Fraja and Delbono (1990) are among those who provided pioneering papers and surveys to understand the complexity of oligopoly.
Various studies have been conducted in this direction having as reference the classical Cournot model (1838). Many models developed gave emphasis to three main issues: quasi-competitiveness of the model, the convergence of the model towards the perfect competition when there is an infinite number of players, the dynamic stability of the equilibrium solution. Through his work, Ruffin (1971) demonstrated that regardless of the quasi-competitiveness of the model, it should not converge to perfect competition. Moreover, convergence only occurs when there is no scale economy. Ruffin also pointed out that the number of firms can be considered a determining factor of quasi-competitive behavior and stability: a large number of firms can generate a deterioration of these aspects.
Levin (1988) compared the classic competition models: the collusive monopoly, Stackelberg and Cournot, while assessing the levels of welfare and performance in these models. For this comparison, Levin considered the same demand and cost functions, but varied the manufacturer’s behavior depending on the model analyzed, taking into account the structure and market conditions. This paper highlights the net effect of price and production change on welfare, with reallocation of production not necessarily favorable when moving from the Cournot to Stackelberg model in terms of performance and welfare.
Based on classical competition models, Morasch (2000) analyzed the consequences of alliance forms, emphasizing the incentives of firms to form these alliances. It has been shown that any kind of strategic alliance is a means of affecting competition that depends directly on the number of allied firms. Such a competitive structure presupposes a commitment regarding the production level, the transfer prices and implicitly the profit sharing. In the case of Stackelberg cartels, allied companies behave like a leader compared to the rest of the industry. Also, firms can expand their production compared to the Cournot level as long as the number of allied firms is small. Otherwise, the production will be reduced.
Johari and Tsitsiklis (2005) focused on the loss of aggregate surplus in Cournot competition as a result of players’ exercise of market power. Obtaining results independent of the characteristics of the players, they have shown that the loss of efficiency is arbitrarily significant in such a competition. It should be noted that the aggregate surplus at a Nash-Cournot equilibrium is 2/3 of the maximum aggregate surplus, resulting in a loss of efficiency of less than 33%. These results can be obtained when consumers who have a concave utility function face an affine supply curve or when producers who have associated convex cost functions face an affine demand curve.
Kalashnikov and Kalashnykova (2008) conducted a comparative analysis of competition in the natural gas market. As structural changes allow for the accurate modeling of strategic behaviors, they have proposed an exhaustive model structured as a two-stage game to characterize the perfect competition, cartel and Cournot competition in such a market. The first stage is defined by natural gas exports to Europe and the second stage by wholesale trade within Europe. The model presented allowed them to highlight that the uncooperative Cournot competition is the most realistic mail scenario in the two stages of the game, but also distinguishes the blockages of the transport infrastructure.
Assuming that profit maximization is not the only goal for Russia, it also aims to increase market power, Jansen et al. (2012) combined the Cournot model with strategic delegation games to highlight the implications of Russia’s operation as a major gas supplier. Their analysis has shown that any non-profit target targeted by Russia leads to increased gas volumes and lower prices, which is a beneficial outcome for EU consumers. The implications of the specific preference test specific to the Cournot equilibrium on the crude oil market have been investigated by Carvajal et al (2013). These tests take into account the strategic interactions during the economic game. The results presented show that the Cournot model with convex costs cannot explain the behavior of the OPEC group. Also, the optimal behavior was rejected for reference periods of 6 months. Through their study, Hoayek et al. (2020) aimed at analyzing the competition, the efficiency of the available information structure, the stability of the prices on the natural gas market using models specific to the game theory. The results obtained prove the presence of the regulatory authority on the analyzed market. Reporting the number of Nash Cournot equilibrium players to the total number of players, Hoayek et al. deduced the Cournot acceptance rate to characterize player behavior. The rate level indicates that players choose to enter into strategic alliances to maximize their profit.
Cumbul (2021) conducted a comparative analysis between the Stackelberg and Cournot models with private information, a linear demand function, but with stochastic interception, asymmetric prediction of signals or differentiated products as hypotheses. Compared to studies that were based on perfect demand information, Cumbul showed an expected price and a higher total profit, the total expected production, the consumer surplus, but also the total being higher in the Cournot-Bayesian equilibrium than in the Stackelberg equilibrium for a finite number of firms. At the same time, through this comparative analysis, four effects of these types of competition were highlighted, the first two favoring Stackelberg competition in terms of welfare, namely: the strategic effect of the first mover and the effect of extracting an information rent.
Starting from the classic Cournot model, Abe (2021) analyzed the formation of cartels in such a competition, the strategic profile of each company being determined by the level of cost advantage. Through his analysis, Abe showed that there is a direct relationship between the result of forming a cartel and the level of cost advantage achieved by each player. Thus, a company can obtain an incentive that allows it to lead the formation of a cartel when it has a moderate level of account advantage. This level allows them to produce goods and services at a significantly lower unit cost. Moreover, Abe pointed out that when there is a cost-copying technology that can be easily copied, this technology can be seen as a barrier to the division of the crankcase.
Roman and Stanculescu (2021) made an analysis of the bargaining power of some European countries (Russia, Norway, Ukraine and Germany) derived from the natural gas transportation system using a cooperative model game. A game theory model based on price strategies (Bertrand type competition) in incomplete information was analyzed by Vintila and Roman (2021).
European Natural Gas Market Analysis
Before presenting the impact of competition among a limited number of gas producers in Europe in the context of a game theory model, we highlight the main features of this market. Over time, the dynamics of the European gas market have been marked by three important aspects: the liberalization process, the rapid depletion of natural gas reserves and Russia’s dominant position. The European gas market is made up of both the competitive and the regulated segment. The competitive segment reflects natural gas trading between producers, suppliers and ultimately eligible consumers, and the regulated segment reflects natural monopoly activities (e.g., underground storage and transportation). Given that natural gas is both a strategic component and a support for the development of several industries, the European gas market has over time played the role of a balancing market.
In order to analyze the European natural gas market and implicitly to identify the main players, the evolution of production, prices, exports and the degree of concentration in the period 1992-2019 were followed. In order to achieve this goal, official annual data published for production and export by data.un.org (http://data.un.org/Data.aspx?d=EDATA&f=cmID%3ANG) and price by ourworldindata.org (https://ourworldindata.org/grapher/natural-gas-prices) are used.
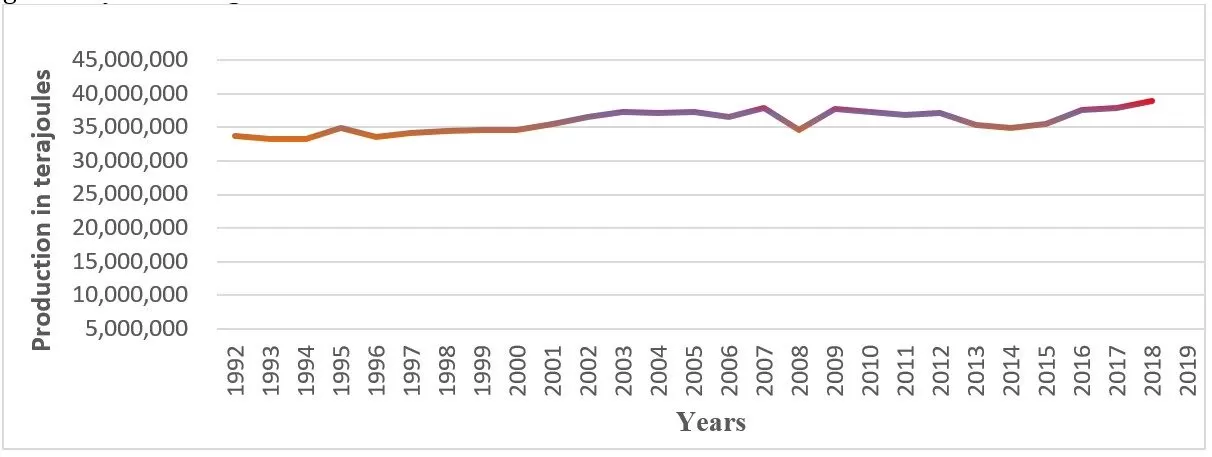
During the analysis period, gas production in Europe was over 33 million terajoules, representing about 24% of world natural gas production. Until 2008, natural gas production did not register significant deviations, expecting the years 1996 (production increased by 4.6% year on year) and 1997 (production decreased 3.9% year on year). In 2008, at European level there was a production with 3.5% higher than the previous year, following that the most significant decline in natural gas production to be registered in 2009 (-8.6% year-on-year). This completely different pattern from historical trends is correlated with the gas crisis of early 2009, which is considered the largest gas crisis in Europe. For producer countries, this has led to rising worries about meeting growing domestic demand and export obligations. Fortunately, it was a short-term decline. Natural gas production reached its highest growth rate of 8.9% (year-to-year) in 2010. In the last four years of the analysis period, natural gas production has increased gradually reaching a level of about 39 million terajoules. The European gas market is seen as a strategic target market. The access to import and export allows the consolidation of the position of the producers on the market and of the profitability of the resources, since the production represents an increase of the business line.
Fig 1. Evolution of European natural gas production during 1992-2019 (terajoules)
Source: Authors’ representation based on data.un.org data
According to preliminary date, European natural gas production decreased in 2020 by almost 7% and consumption decreased slightly by 4.51% year-on-year. It seems that natural gas production and long-term market prospects were not significantly impacted by changes in the European gas market amid Covid-19 pandemic.
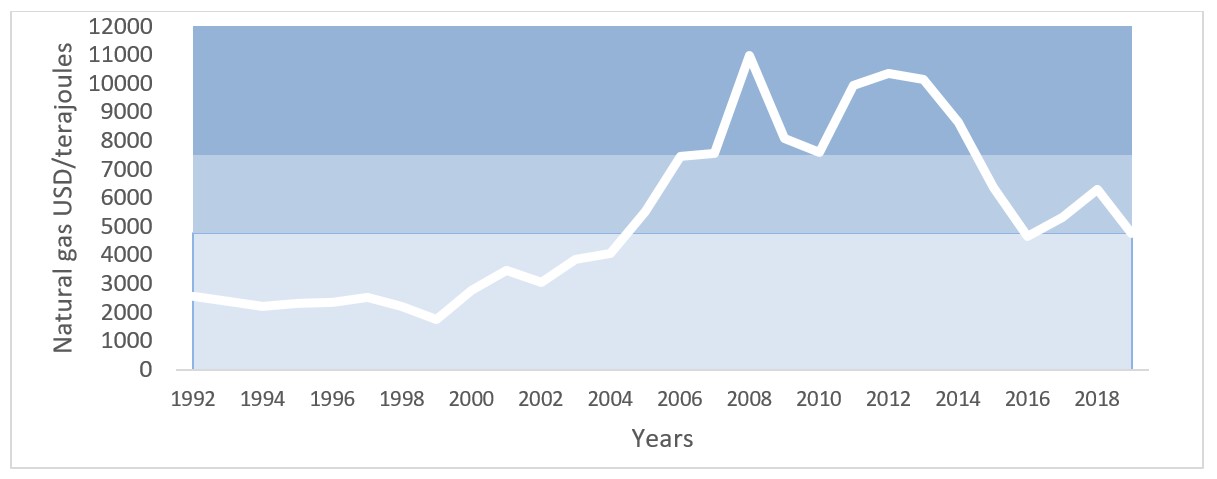
Fig 2. Evolution of natural gas price during 1992-2019
Source: Authors’ representation based on data.un.org data
The natural gas – average German import price ($/terajoules – see Fig 2) was volatile during the period considered, without the possibility of highlighting a trend. In the periods 1992-1997, 2004, 2007, 2012-2013, the price variation did not exceed 7% year on year. The most significant risings year on year were in 2000 (56%), 2005-2006 (35%), respectively 2008 (45%). In 2009, 2015-2016 and 2019, gas price dropped by more than 24% year on year. It should be noted that in 2016, the price gas reached a level close to that recorded in 2004. Given that the price of gas has a significant impact on industrial cost, household expenditures, but also on business competitiveness, analysts, decision makers in different business lines attach special importance to monitoring the market price gas.
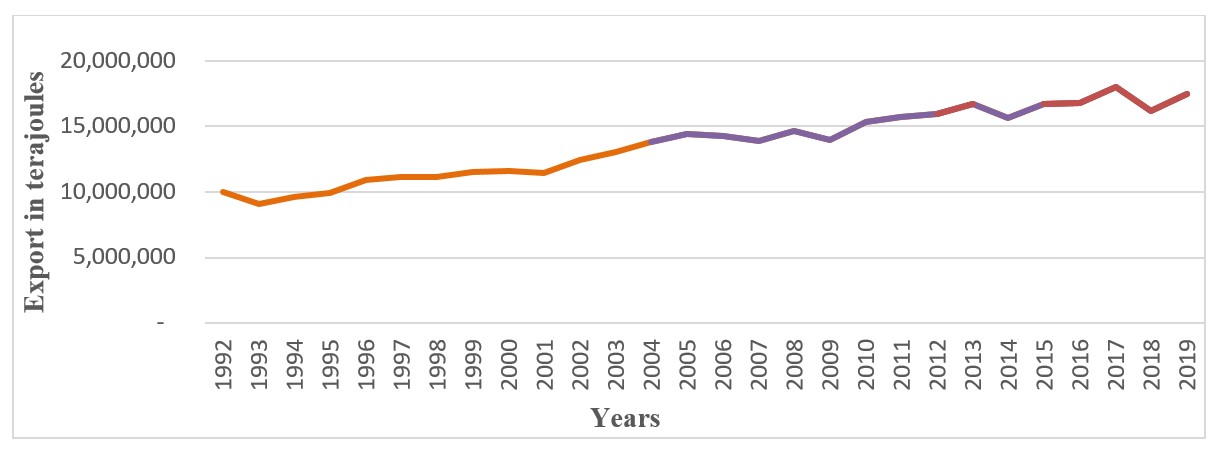
Fig 3. Evolution of natural gas export during 1992-2019
Source: Authors’ representation based on data.un.org data
In the period 1992-2019, the exported quantity of natural gas did not experience very large variations, having a minimum of 9.1 mil terajoules (1993) and a maximum of 18.03 mil terajoules (2017). At present, the quantity exported at European level represents approximately 36% of the quantity exported at world level. The share of the Russian Federation in total European export flows has decreased since 2000, being between 46% and 63%. Between 1992 and 1999, the volume of natural gas exported by Russia accounted for between 67% and 73% of total European exports. However, Russia is the largest supplier of natural gas in Europe, followed by Norway. Russia’s dominant position as the main exporter of natural gas to the European market involves uncertainty regarding market power and security of supply.
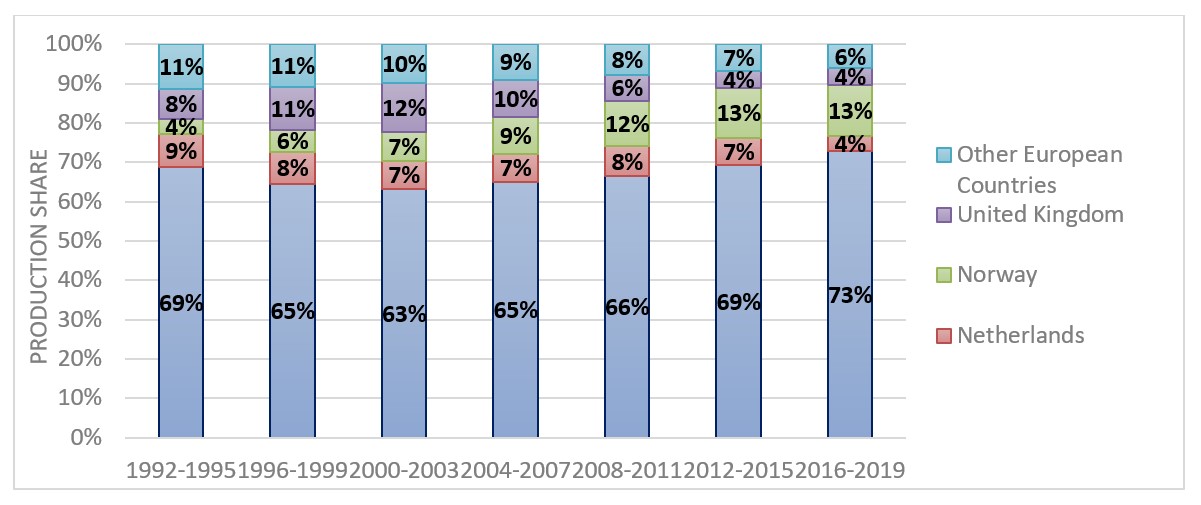
The analysis of the degree of concentration achieved on natural gas production is of significant importance from a competitive point of view. This analysis is based on the market shares of European countries calculated according to the quantity of natural gas produced. As we see in fig 4, the European gas market is currently dominated by the four players: Russia, Norway, the United Kingdom and the Netherlands. If in 1992 the domestic production of these absolute leaders accounted for 89% of total production in Europe, in 2019 they provided 95% of European production and over 20% of world production. Therefore, during the analyzed period, there were small structural changes on the natural gas market in terms of its main players.
Fig4. Gas production by major countries during 1992-2019
Source: Authors’ calculation and representation based on data.un.org data
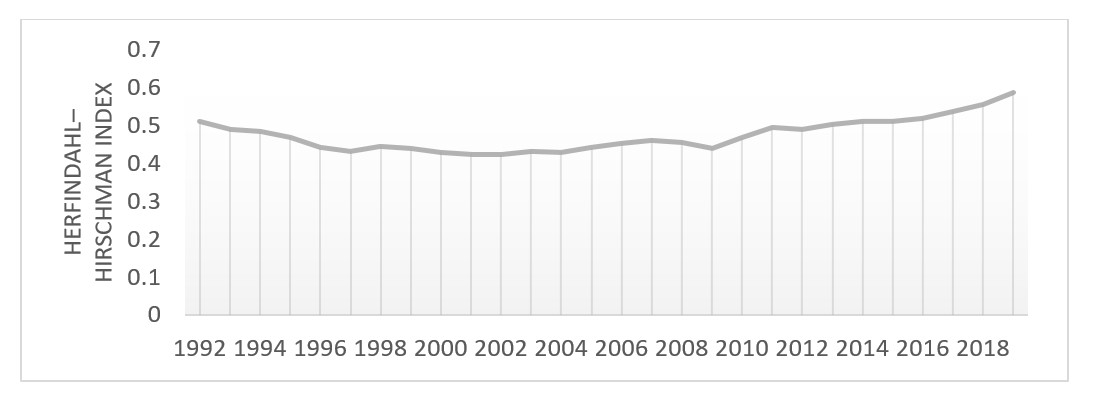
According to the analysis carried out in this direction, Russia has managed to consolidate its competitive position both at European and global level as a result of the increase in demand and the decrease in local production in other countries. Therefore, we can say that the segment of European natural gas production is characterized by a very high degree of concentration, indicating a higher approach of the market analyzed by the oligopoly model. Hirschman Herfindahl market concentration index helps us to see the dispersion of production between countries with natural gas production on the European market. Analyzing the evolution presented in fig 5, we observe the oligopolistic character of the natural gas market during the whole reference period. When the index decreases, competition decreases and market power increases.
Fig 5. Hirschman Herfindahl market concentration index
Source: Authors’ calculation and representation based on data.un.org data
Hafner (2008) made an analysis which resulted in the dominant position of Russia and Norway, which for the last few years has strengthened the dominant position of these two countries. Heterogeneous capacities and cost levels lead to a substantial differentiation among providers. At present, Gazprom and Equinor are the leaders by natural gas production in the Russia market, respective in the Norway market. Gazprom provides 66% of Russia’s natural gas production and 11% of global natural gas production. In terms of Equinor production, this represents 70% of Norway’s natural gas production. These firms being in a monopoly position can operate at the minimum point on the long-term average cost curve. Instead, rival producers can achieve production equal to or even lower than those firms that benefit from the effects of scale economies, but at higher average costs.
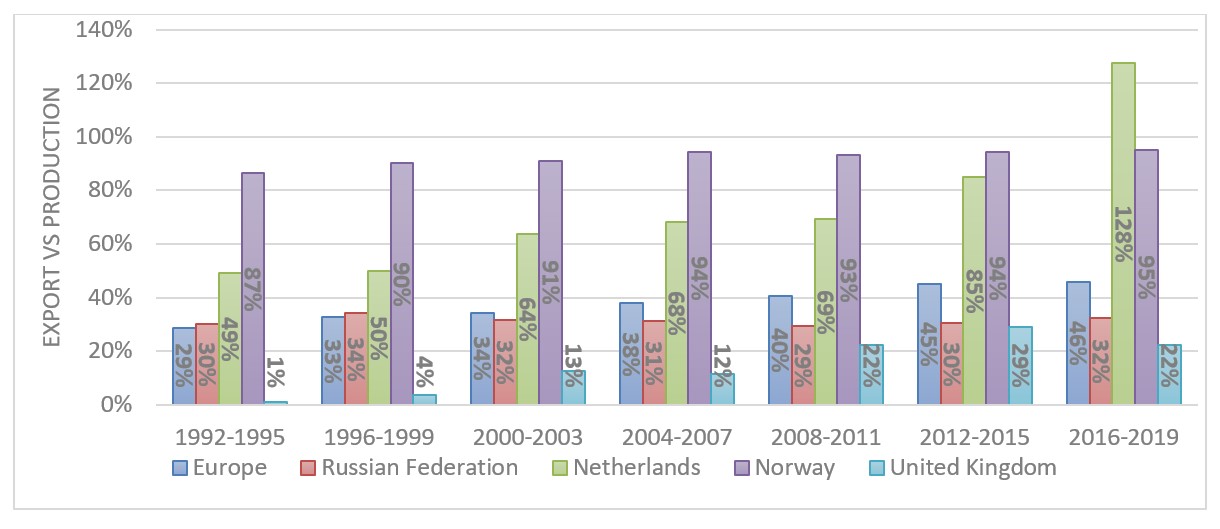
Fig 6. Export to production ratio
Source: Authors’ representation based on data.un.org data
In the chart above, we can see if the quantity of gas exported can be covered only by domestic natural gas production at the level of the leading countries in production. It is noted that the Netherlands exported more natural gas than the quantity produced in 2016-2019, which means that imports exerted significant competitive pressure on domestic production. If this trend continues, the Netherlands could see a dilution of market power. As the export to production share increases, countries are forced to increase imports to meet demand. During the reference period, the quantity of gas exported by Norway has a significant share in the total domestic production. This does not apply to Russia and the United Kingdom. Fig 6 shows us that the UK exported a small quantity of natural gas during the analyzed period. As the market grows and becomes more open and resilient, Russia wants to sustain or increase its exports to Europe. But at the European level, the aim is to shape a competitive and efficient market, without any player becoming vulnerable to Russian pressure.
Methodology and Model
Because firms have to make strategic choices, the competitiveness gaps and market concentration can be defined within the limits of a mathematical model. One of the primary research tools used to formalize strategic choices in the mathematical concept of the game is game theory. Being a rational player, any company seeks to maximize its benefits derived from both prices and quantities, wanting to gain a large share of the market. Cournot competition is used to shape the behavior of firms when they seek to maximize their profits based on opponents’ decisions about the quantities supplied. Firms adopt profit-oriented market strategies and do not cooperate. Therefore, the decision of each firm affects the price paid by the consumer.
Let’s consider four firms that produce an undifferentiated good and choose to play a quantity setting game with simultaneous moves. In this case, the total quantity of good supplied by the four firms is:
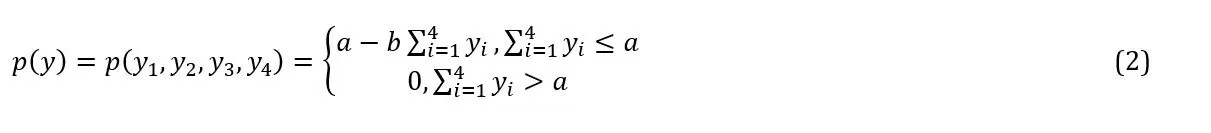
The market inverse demand function is defined as:
where a is a parameter, the maximum price that the consumer is willing to pay, and p is the price of the good.
Each firm is assumed to have asymmetric marginal costs and no fixed costs. Thus, the total production cost of quantity is given by:
In our case, the players are the four firms whose strategies are given by choosing the optimal quantity of production as in the case of any Cournot competition: .
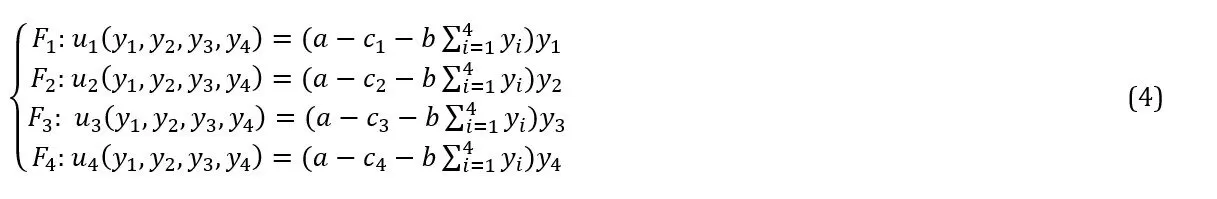
Under these assumptions, the firm i`s payoff is:
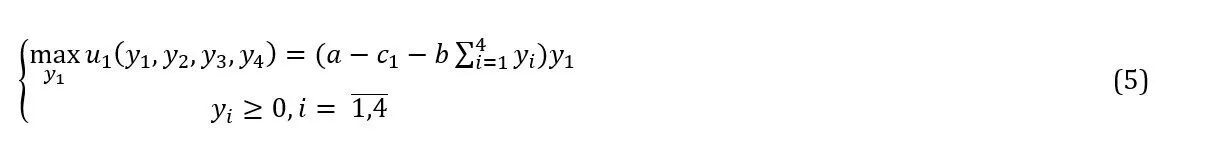
In order to characterize the market equilibrium, four optimization programs must be solved as follows:
The solution of the optimization program for is determined by canceling the partial derivative of the profit in relation to the quantity of good produced:
whence it results:
Relation (7) defines the reaction function of the first company. This represents the quantity produced by in relation to the quantities he thinks his opponents are offering on the market.
As well, the second-order condition for a maximum is satisfied:
The optimization programs for the other firms are written and solved analogically,
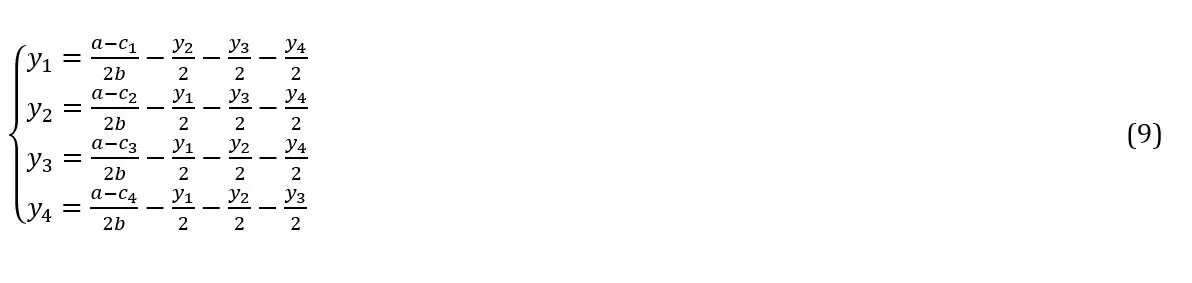
thus obtaining a system formed by the reaction functions of the four companies:
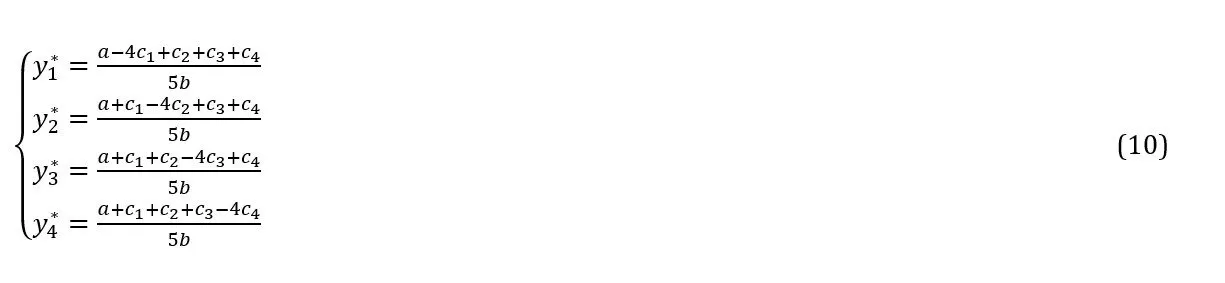
Solving the system defined in equation (9), we obtain the optimal quantities that will be produced by the four companies in the analyzed industry:
In the case of the Cournot model, the Nash equilibrium emphasizes the strategy that ensures the maximization of the payoff of each player both in relation to the supplied quantities and in relation to the strategies of the opponents. Thus, the Nash-Cournot equilibrium is found at the coordinate point .
Substituting the optimal quantities in relation (2), we obtain the price paid by the consumer:
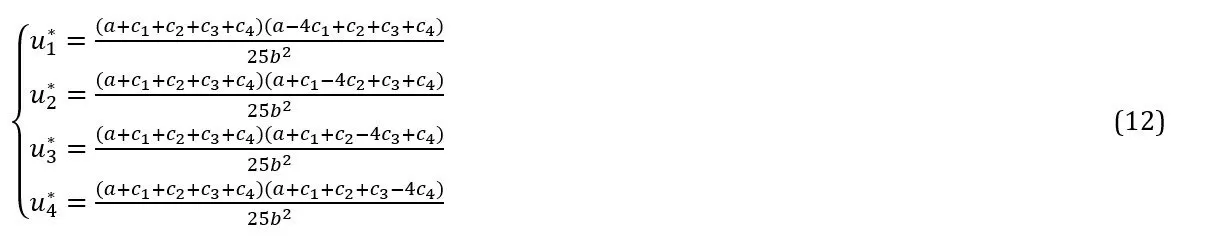
Equation (12) shows the profits of the four companies:
Game Theory Results and Discussions
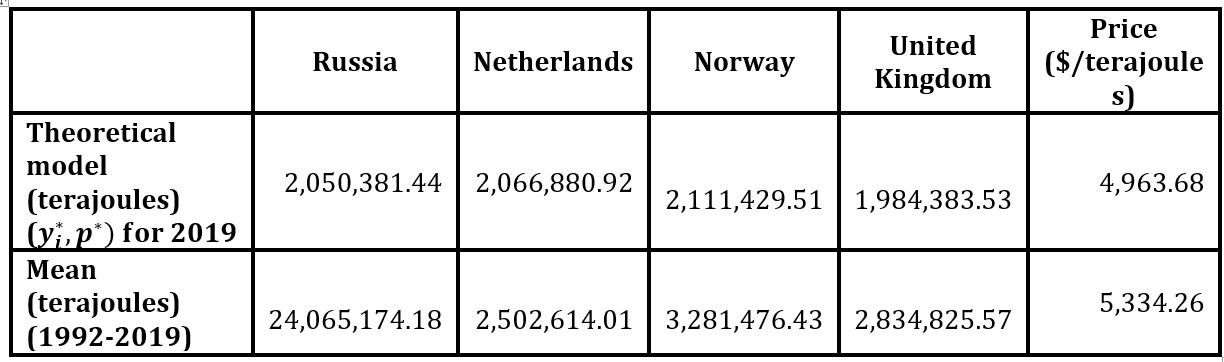
For the application of the model presented in the methodology, we take into account the productions of the most important producers in Europe: Russia, Norway, the Netherlands and the United Kingdom. The natural gas market in Europe is an oligopoly market on which a single good is traded that is supposed to be homogeneous, disregarding its quality. Thus, the offers of the four most important players in this market are substitutable, and the selling price is unique. It arises as a result of meeting the aggregate demand with the supply of natural gas. Thus, we take into account the average selling price of natural gas. The estimation of demand function parameters from the theoretical model is made using the program R, in which the exogenous variables are represented, for the four dominant players, by the levels of annual production (1993-2019), expressed in terajoules per year while the average selling price of natural gas ($/terajoules) represents the exogenous variable. Production costs are calibrated based on the reports made by Rystad Energy. The average cost for Russia is 398.88 $/terajoules, for the United Kingdom is 531.84 $/terajoules, for Norway is 275.89 $/terajoules and for the Netherlands is 365.64 $/terajoules. The estimators of the coefficients of the model variables (p(y) = a – b y) are: a = and b =397.1. The increase of the natural gas production by 1 terajoules for each of the four players will determine the decrease of the natural gas price by 397.1$/terajoules. Substituting the values of the parameters in equations (10) and (11) – presented in the methodology section – we obtain the equilibrium quantities and the price described in Table 1.
Table 1. Equilibrium quantities
Source: Authors’ calculation based on data.un.org data
Analyzing the obtained results, we notice that the estimated price is very close to the average price, and the quantities obtained in the theoretical model are significantly different from the average productions considered. As we see in Table 1, Russia’s quantity in the theoretical model is eleven times higher than the average production. The dominant position of this producer is the determining factor of this result. For the Netherlands, Norway and the United Kingdom, the quantities obtained in the theoretical model and the average productions do not differ significantly. If different reference periods are taken into account, then the estimated parameters for quantity function change significantly.
Conclusions
In economic games, the behavior of microeconomic entities varies depending on the information available to the parties, the beliefs of observers. Bargaining, competition between firms, conflict between managers and labor provide examples of economic games. Behavior that adapts to changes in economic or influencing games is induced by the level of uncertainty. Modeling economic transactions through game theory reveals a strategic decision-making process. Game theory provides a powerful tool for understanding the relationships, both consolidated and broken, between players in the case of competition and cooperation. Thus, knowing and identifying the type of game are essential steps that allow the identification of the means of analyzing the existence of equilibrium.
The research tools offered by game theory can be easily applied in the European natural gas market. Highlighting the structure of the market, the degree of concentration, the volatility of price and production, the identification of dominant players and the pressure they exert are among the important characteristics that must be taken into account when analyzing this market. During the period considered, the production of natural gas at the European level represents approximately 24% of the world production, not being identified a significant volatility in its evolution. The price evolution was extremely volatile, with a maximum of 10995.17 $/terajoules (2008) and a minimum of 1765.61 $/terajoules (1999). Through the analysis performed, we identified a very high degree of concentration, indicating a higher approach of the market analyzed by the oligopoly model. In the context of the current war and the sanctions applied to Russia, it appears necessary to call on other suppliers of natural gas. European countries are seeking to stop importing natural gas from Russia due to the current war and turn to the United States, Arab countries and Asian countries.
Russia, the United Kingdom, Norway and the Netherlands are the dominant players in the European gas market, their production being taken into account for determining the equilibrium quantities from the point of view of game theory. Comparing the equilibrium quantities and price, determined on the basis of data from 1992-2019, with the average values, we notice that only in the case of Russia there are significant variations between the quantities (24 mil terajoules vs. 2.2 mil terajoules). This is due to its dominant position. For the other three countries analyzed, we have small variations between the average quantities and the equilibrium quantities. Referring to the price, we notice that between the average price and the price resulting from the theoretical model there is a variation of 0.29% (5334.26 $/terajoules vs 5349.97 $/terajoules).
One of the limitations of this analysis is the lack of knowledge of exact costs. Data sources do not accurately indicate it, so they were calibrated from existing sources. In the Cournot model, the equilibrium quantities are almost equal for all players. In fact, the data show that Russia is a leader. As future research directions, we propose to modify the model using the Stackelberg-Cournot oligopoly model, Russia being the leader and the other three dominant countries being followers.
An earlier version of this paper was presented at the 39th IBIMA Conference.
Acknowledgment
This paper was co-financed by the Bucharest University of Economic Studies during the PhD program.
Copyright Notice
Authors who publish in any IBIMA Publishing open access journal retain the copyright of their work under a Creative Commons Attribution 3.0 Unported License, which allows the unrestricted use, distribution, and reproduction of an article in any medium, provided that the original work is properly cited. No permission is required from the authors or the publishers. While authors retain copyright of their work with first publication rights granted to IBIMA Publishing, authors are required to transfer copyrights associated with commercial use to this Publisher. Revenues produced from commercial sales and distribution of published articles are used to maintain reduced publication fees and charges.
References
Abe, T. (2021) ‘Cartel Formation in Cournot Competition with Asymmetric Costs: A Partition Function Approach,’ Games, 12(1), 1-16.
Carvajal, a., Deb, , Fenske, J. and Quah, J. (2013) ‘Revealed Preference Tests of the Cournot Model,’ Econometrica, 81(6), 2351-2379.
Clempner, JB. andPoznyak, A (2016) ‘Analyzing An Optimistic Attitude For The Leader Firm In Duopoly Models: A Strong Stackelberg Equilibrium Based On A Lyapunov Game Theory Approach,’ Economic Computation And Economic Cybernetics Studies And Research, 50(4), 41-60.
Colombo, L. andLabrecciosa, P. (2019) ‘Stackelberg versus Cournot: a differential game approach,’ Journal of Economic Dynamics and Control, 101(C), 239-261.
Cournot, A.A. (1838) Recherches sur les Principes Mathematiques de la Theorie des Richesses, Hachette.
Cumbul, E. (2021) ‘Stackelberg versus Cournot oligopoly with private information,’ International Journal of Industrial Organization, 74(C), 1-25.
Daughety, AF. (1988) Cournot Oligopoly, Cambridge University Press.
De Fraja, G. andDelbono, F. (1990) ‘Game Theoretic Models of Mixed Oligopoly,’ Journal Economic Surveys, 4(1), 1-17.
Friedman, JW. (1977) Oligopoly and the Theory of Games, North-Holland Publishing Company.
Hafner, M. (2008) ‘Long-Term Natural Gas Demand and Supply Outlook for Europe: Import Potential, Infrastructure Needs and Investment Risk Mitigation’, Paper Presented at the FEEM seminar, Milan.
Harris, RG. andWiens, E (1980) ‘Government Enterprise: An Instrument for the Internal Regulation of Industry,’ The Canadian Journal of Economics, 13(1), 125-132.
Hoayek, A., Hamie, and Auer, H. (2020) ‘Modeling the Price Stability and Predictability of Post Liberalized Gas Markets Using the Theory of Information,’ Energies, 13(11), 1-20.
Jansen, T., van Lier, , van Witteloostuijn, A. and von Ochssée, TB. (2012) ‘A modified Cournot model of the natural gas market in the European Union: Mixed-motives delegation in a politicized environment,’ Energy Policy, 41, 280-285.
Johari, R. andTsitsiklis, J (2005) ‘Efficiency loss in cournot games. Technical report, LIDS-P-2639, Laboratory for Information and Decision Systems,’ MIT.
Kalashnikov, V. and Kalashnykova, (2008) ‘A Strategic Model Of European Gas Supply,’ International Business & Economics Research Journal, 7(5), 43-50.
Levin, D. (1988) ‘Stackelberg, Cournot And Collusive Monopoly: Performance And Welfare Comparisons,’ Economic Inquiry, 26(2), 317-330.
Milgrom, P. and Roberts, J. (1982) ‘Limit Pricing and Entry under Incomplete Information: An Equilibrium Analysis,’ Econometrica, 50(2), 443-459.
Morasch, K. (2000) ‘Strategic alliances as Stackelberg cartels – concept and equilibrium alliance structure,’ International Journal of Industrial Organization, 18(2), 257-282.
Roman, MD. And Stanculescu, DM. (2021) ‘An Analysis of Countries’ Bargaining Power Derived from the Natural Gas Transportation System Using a Cooperative Game Theory Model,’Energies, 14(12).
Ruffin, RJ. (1971) ‘Cournot Oligopoly and Competitive Behaviour,’ The Review of Economic Studies, 38(4), 493-502.
Shapiro, C. (1989) Theories of oligopoly behavior, Handbook of Industrial Organization.
Vintila, A. and Roman, MD. (2021) ‘Bertrand competition under asymmetric conditions’ Proceedings Of The International Conference On Business Excellence, ISSN 2502-0226, 18 March 2021, Bucharest, Romania,15(1), 235-244.