University of Warmia and Mazury, Institute of Economics and Finance, Olsztyn, Poland
Volume 2024,
Article ID 331247,
Journal of Eastern Europe Research in Business and Economics,
14 pages,
DOI: https://doi.org/10.5171/2024.331247
Received date: 27 November 2023; Accepted date: 7 February 2024; Published date: 7 March 2024
Academic Editor: Aleksandra Ostrowska
Cite this Article as:
Jaroslaw SKORWIDER-NAMIOTKO (2024)," Determinants of the Polish State Budget Stability", Journal of Eastern Europe Research in Business and Economics Vol. 2024 (2024), Article ID 331247, https://doi.org/10.5171/2024.331247
The problem of the stability of budget revenue and expenditure has been the subject of research for many years. However, there is still a need to monitor this phenomenon to achieve a correct balance in the budget because of the instability of different factors in the economic surroundings that affect the budget. This is especially important in developing countries undergoing economic transformation, and Poland is still in that process. The study aims to assess changes in the Polish state budget’s size and revenue and expenditure structure between 2000 and 2022. The method of comparative analysis over time is used with the actual value of the money concept, measures of dynamics, structure, GDP ratios, statistical description and coefficients of dissimilarity of structures. Analyses have shown a permanent imbalance in the Polish budget. However, the budget’s primary result oscillates around zero and both revenues and expenditures have gradually increased. The volatility of budget revenue and spending is moderate. Only the use of EU funds is characterised by high volatility. The emerging crises (e.g. Russia’s war against Ukraine and the coronavirus pandemic) have a negligible impact on the budget structure, but they influence its level of expenditure. The changes in Polish budget size are generally due to inflation, economic growth rates, and the inflow of funds from the European Union budget.
Keywords: state budget, stability, public finance, deficit.
Introduction
The state budget is the primary financial plan for allocating funds collected by the central government. Its scope results from decentralisation processes and the power and economic resources’ distribution between the central government and local authorities. It also depends on the objectives of the state’s socio-economic policy and the scale of state interventionism—the scope of applied interventionism and decentralisation changes with the change of successive government cabinets. The state budget, therefore, has an allocative function, a redistributive and stabilising function, and a management and control function (Podstawka, 2017; Owsiak, 2017). Adequate planning of financial resources is an element of public management processes, and allocating public resources affects the economy’s efficiency (Skuza, 2021). This is particularly important in countries with a high share of the state in the economy, and Poland still belongs to such countries. According to the Ministry of Finance, in 2021, the state budget was responsible for 31% of revenues of the public finance sector and 34% of the sector’s expenditures (Justification…, 2021). Consequently, the state budget is still essential for allocating financial resources in Poland.
The study aims to assess changes in the Polish state budget’s size and revenue and expenditure structure between 2000 and 2022. The problem of the size and causes of changes in the level and structure of budget revenue and expenditure have been the subject of research for many years. However, there is still a need to monitor this phenomenon to achieve a correct balance between revenue and expenditure in the budget.
Theoretical Concept
Changes in the state budget can concern both its size and structure. They result from the government’s decisions on the scope of interventionism and decentralisation but also from changes in legislation, the economic development of a country and changes in the purchasing power of money in a country. The most relevant factors relate to the observed inflationary phenomena in the economy and the pace of its development (Lubieniecka, 2013; Bell, 1975; Petek, 2022). Excessive state interference in the economy limits development opportunities and results in slower economic growth. Higher levels of public income and expenditure to GDP in EU countries are accompanied by lower economic growth in the long term, which is particularly pronounced in the case of Central and Eastern European countries. Therefore, a sustainable reduction in state interventionism is increasingly called for (Krajewski, 2013; Redo et al., 2018; Ramey, 2019).
It is important to note here the correlation between the size of budget expenditure and the level of economic development observed by Adolf Wagner in the 19th century. He noticed a positive correlation between economic growth and public expenditure. Wagner concluded that the public sector increases in relative and absolute terms as the size of the economy increases (Wagner, 1883; Lamartina, Zaghini, 2011). Academic research only sometimes confirms this relationship (Kuckuck, 2014). The link Wagner referred to may be more relevant in the early stages of economic development than later. On the other hand, research is driven by effects other than state action (Köppl-Turin et al., 2017; Jaen Garcia, 2021).
As Sokolowski (2008) emphasises, the formation of the structure of central budget expenditure is influenced by institutional-legal, political-social and efficiency factors. In the first group, we can distinguish the degree of decentralisation of public tasks and the organisational and legal system of the public finance sector. The level of decentralisation, both in organisational and financial terms, determines the amount of financial support in the form of grants and subsidies provided to local government units. The greater the organisational decentralisation and the smaller the financial decentralisation, the larger the transfers have to be directed from the state budget and distributed through budget units, which are characterised by low efficiency.
The second group includes the composition of political forces in parliament, the extent of state financing of social and technical infrastructure, the needs arising from social security and the implementation of social contracts by the state. In Poland, as a rule, coalition governments are formed, which often have different policies on social and welfare issues. As a result, other social goods are delivered to the population so that budget expenditure will differ. In Poland, there is an ongoing dispute about the desirable and acceptable redistribution rate between left-wing and trade union groupings on the one hand and confederations of employers and pro-market political parties on the other. The Polish redistribution rate is estimated to be around 42-45% (Wilczynska, 2008). Wilczyńska (2008) points out that this rate is too high from the point of view of the country’s investment needs, as with high redistribution for budgetary purposes, the level of investment is low. Additionally, the state of the economy – unemployment or inflation – determines the direction of budget spending. Significant sporting events that require government investment can also influence the size of expenditure. Such a factor was the organisation of EURO 2012, which decided to increase spending on public infrastructure across the country.
The third group of determinants includes fiscal efficiency (Wierzbicka et al., 2021) and the scope and effectiveness of the subsidy system (grants and subventions). Public authorities in Poland made changes to the tax system through changes in tax rates and sealing in tax collection. These changes concerned mainly VAT and personal and corporate income tax. In the case of VAT, the introductory VAT rate was temporarily increased to 23% in 2011 but has not been reduced since then. Since 2013, measures have been introduced to increase the collection of this tax in reverse VAT for some goods, JPK – a uniform control file, and organisational changes in the collection of this tax. However, reducing the VAT gap turned out to be short-lived. As the economic situation deteriorated, this gap began to widen again. From 2022, reduced VAT rates are also part of the anti-inflation shield. They are related primarily to food, fuels, gas, heat, and electricity (Obłąkowska, 2023). The most significant changes in the PIT tax are related to introducing the so-called Polish Deal. Under this program, increased tax thresholds and the tax-free amount, and the rate for people from the first tax threshold was reduced to 12% (Łożykowski, 2023). In the case of corporate income tax, an additional reduced rate of 9% was introduced for small enterprises. These may have also significantly changed the size and the structure of revenues. Over the last decades, tax rates have been reduced in many countries, but this has generally not decreased state budget revenues. This indicates that a reduction in tax rates is an incentive to expand economic activity, which offsets the reduction’s fiscal ‘losses’.
A separate category should be attributed to crisis phenomena that occur in the economy. The two most important ones observed during the period under study are the financial crisis of 2008-2009 and the pandemic of 2020-2021 (Wierzbicka, Kalitka, 2023; Krajewski, 2013; Ramey, 2019). This phenomenon usually causes an increase in state budget expenditure.
Poland also joined the European Union in 2004. This membership entails payments to the EU budget, but at the same time, receiving financial support from the Union is possible. Additional cash flows have, therefore, emerged, which may have significantly altered the existing budget structure. The European Union, however, dictates how funds are allocated. It is directed towards achieving European Union objectives, not necessarily national ones. As a result, it can have a stabilising effect on changes to the budget structure. The escalation of the Russian-Ukrainian conflict in 2022 did not directly affect the state budget, but the indirect impact was significant. As a result of the war, energy and fuel prices changed as existing supply chains were disrupted. This was reflected in the rapidly growing inflation, which was additionally driven by the post-COVID effect when entrepreneurs tried to make up for the losses. A slightly delayed reaction of the National Bank of Poland led to higher inflation than in other European countries (according to the Central Statistical Office, it reached 14.4% in 2022).
One of the main problems of any country’s fiscal policy is the proper coordination of budget revenues with budget expenditures and, consequently, the maintenance of budget balance (Sosnowski, 2014). The mismatch between the amount of revenue and expenditure leads to a budget deficit. This phenomenon is influenced by both economic factors and random situations (natural disasters, epidemics). Sometimes, a deficit is used to raise taxes or deliberately stop increases in the budgetary sphere (Dżugaj, 2022). However, the security of public finances requires the maintenance of a balance (Rubin, 2020). The benchmark for assessing fiscal sustainability is most often the debt and deficit limits of the public finance sector (Malinowska-Misiąg, 2017). To maintain the sustainability of public finances, it is essential not only to ensure the solvency of the state but, first and foremost, to ensure that public authorities provide an adequate level of public services and that fiscal policy is aligned with the tasks of stimulating the development of the economy. Monitoring public deficit and debt forecasts and the risks associated with the sustainability of public finances is critical to maintaining economic credibility and market confidence (Gonet, Suchodolski, 2021; Shkarlet et al., 2019). The cause of the debt increase independent of the authorities may be a change in exchange rates, as it increases the debt in the currency of the concluded loan. Following the recent financial crisis, several regulations of a supranational nature have been developed and adopted at the European Union level to strengthen the fiscal discipline of Member States (Redo et al., 2018).
According to the theoretical studies, the following hypothesis is set out:
H1: The level of revenues and expenditures in Poland’s state budget and its structure during the 21st century was unstable due to changes in the legal and economic environment.
Data and Method
The analysis of the state budget structure can be carried out in various classification cross-sections: budget classification headings, the system of state functions in the performance budget system or the generic structure of income and expenditure. The research used the latter classification due to the availability of statistical data and the level of detail (it covers more than 30 items).
It should be noted here that, since 2010, the state budget in Poland has not been a single financial plan. It can be distinguished between the core budget and the budget for European funds. They are combined at the level of the budget result, which the State Treasury jointly finances with funds borrowed from financial markets. In 2004-2009, EU funds flowed directly into the state budget, so to maintain comparability of data, revenues and expenditures of the core budget and the budget of European funds were consolidated. The research period from 2000 to 2022 results from the detailed availability of statistical data. It takes into account at least two complete business cycles, as well as significant phenomena from the macroeconomic environment that could affect cash flows in the budget, such as Poland’s accession to the European Union, the financial crisis, the organisation of EURO 2012, the coronavirus pandemic or war in Ukraine. The data sources are the databases of the Ministry of Finance in the scope of reports on the state budget implementation from 2000-2022. In addition, the Central Statistical Office database is used. Due to the long period of analysis, the primary data expressed in current nominal prices were converted into their real money values according to the prices of 2022, thus eliminating the direct impact of inflation on the examined phenomena.
The core budget divides revenue into three groups: tax revenue, non-tax revenue, and European Union funds (in part, the State is the final beneficiary). For the research, revenues from the four most significant taxes were singled out, i.e. VAT, excise duty, PIT and CIT, following other tax and non-tax revenues. The last group of core budget is combined with revenues from the European funds’ budget. In the case of expenditures, several groups were distinguished: grants and subventions, current expenditures of budget entities, capital expenditures, servicing of State Treasury debt, own funds of the European Union and financing of tasks with the share of funds from the European Union budget. Also, in this case, the most significant type of group – grants and subventions – was separated into those related to the social security system and others. The core budget’s last category was combined with European funds’ budget expenditures.
The concept of stability in the state budget or public finance sector is defined differently in the literature. Chugunov, I., & Makohon, V. (2019) distinguish between budget stability and sustainability. Budget stability is the stability of its architecture over time, which refers to the relationship between the budget components and the social and economic effects it causes. Maintaining appropriate budget stability can ensure consistency of budget revenues and expenditures and achieve fiscal balance. On the other hand, budget sustainability is the ability to fully finance budget expenditure or maintain the deficit and public debt ratio to GDP at an economically justified level. On the other hand, Bayramov (2020) connects budget stability only with fiscal security, the ability to finance government expenditure and the consistency of its spending. He notes that this stability has a positive impact on the development of the economy. In this study, the stability of the budget level is understood as low variability of budget revenues and expenses over time (coefficient of variation below 20%). The stability of the budget structure is identified with low structure variability (coefficient of dissimilarity of structure below 10%) and adequacy of the income level to budget expenditure.
The study used the method of comparative analysis over time, using measures of dynamics, structure, statistical description (mean, median, standard deviation) and linear regression (trend line test). The stability of income and expenditure was assessed using the coefficient of variation (CV) (Pulawska-Turyna, 2011). Comparative analyses also used indicators of the share of the examined categories in GDP and examined the co-occurrence of phenomena using Pearson’s correlation coefficient. Analyses and significance testing of correlations were done using the MS Excel package. The income and expenditure structure changes were assessed using coefficients of dissimilarity of structures (Walesiak, 1984).
Results and Discussion
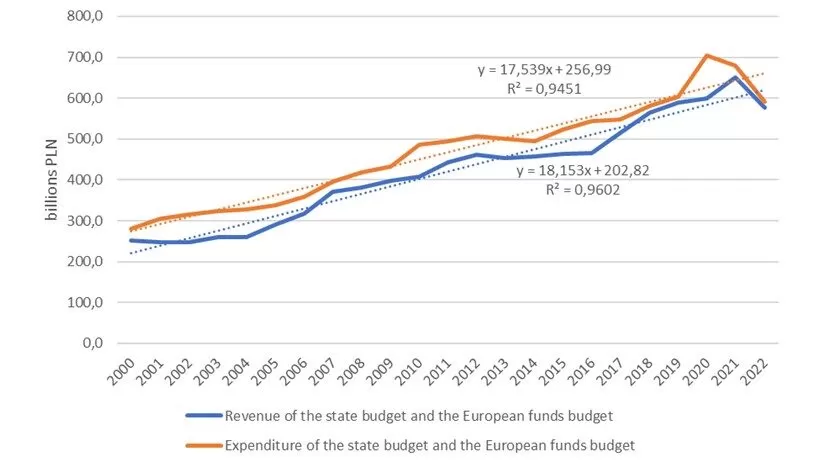
First, the magnitude of changes in the state budget was analysed (Fig. 1). Total state budget revenues at constant prices ranged from PLN 252 billion in 2000 to PLN 650 billion in 2021 before declining to PLN 577 billion. Total state budget expenditure increased from PLN 282 billion in 2000 to PLN 707 billion in 2020, gradually declining to PLN 595 billion in 2022. The reversal of the upward trend in 2022 was due to the high inflation observed in the last year under review, by which the value of money changed significantly. The highest budget expenditure in 2020 resulted from the redistribution of funds to counteract the adverse effects of the COVID-19 pandemic. The state budget was directly charged to expenses for additional support for the Social Insurance Fund, which paid increased benefits. Other Covid expenses were financed from extra-budgetary funds of the National Economy Bank and the Polish Development Fund. However, the budget increased expenditure on non-COVID-19 tasks related to paying additional pensions, increasing investment limits and creating reserves for the next year (Misiąg, 2020).
Fig 1. Total revenue and expenditure of the Polish state budget in 2000-2022
(in billions PLN, in fixed prices from 2022)
Source: Author’s own study based on data from the Ministry of Finance.
Between 2000 and 2022, the overall state budget doubled in revenue and expenditure. Considering inflation-related changes, total revenue increased by around 129%, while total expenditure increased by 111%. The analysis of the dynamics of change and the linear trend indicates a favourable development, as a faster increase in revenue than in expenditure is observed, both in the state budget as a whole and in the core budget. On the other hand, a sustained surplus of expenditure over budget revenue is visible, which is an unfavourable situation. Despite the observed upward trends, moderate volatility in total budget revenue (30%) and total budget expenditure (26%) was evident once inflation was eliminated. There was less volatility in total budget revenue and expenditure in the core budget (25% and 21%). The analysis of the size of revenues and expenditures to gross domestic product indicates a high correlation between the variables studied, which was statistically significant (correlation coefficient 0.99, p < 0.000 for budget revenues and 0.98, p = 0.000 for budget expenditures). It can be concluded that the budget size depended on the economy’s growth rate as measured by GDP. Regarding expenditure, a general relationship was defined by Wagner’s law, but its confirmation would require further detailed analysis.
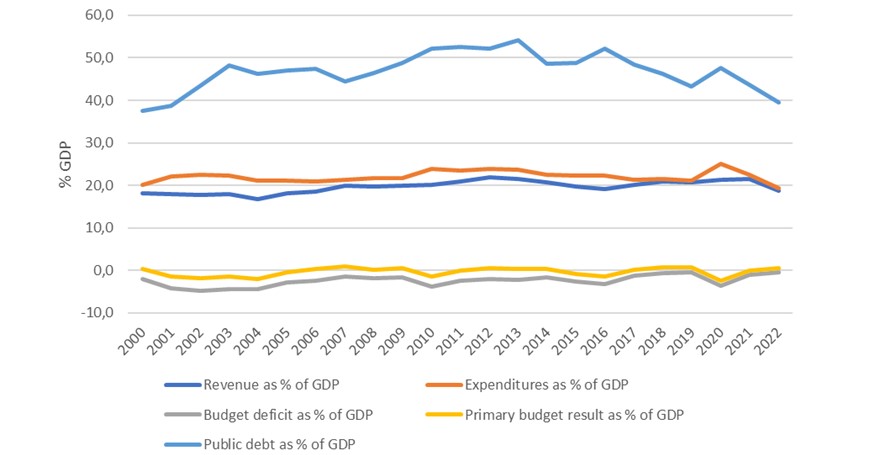
Figure 2 shows the budget level to gross domestic product (Fig. 2). Budget revenue accounted for about 20% of GDP (with a standard deviation of about 1.4 percentage points). Budget expenditures accounted for about 22% share of GDP (with a standard deviation of 1.3 percentage points). As a result, their volatility was very low (7 and 6% respectively). As already mentioned, there was a persistent deficit phenomenon in the budget. While in the budget of European funds, there was a surplus in some years, in the core budget, there is a permanent budget deficit (between PLN 11 billion and PLN 86 billion). The absolute value of the budget deficit and the deficit to GDP were characterised by high volatility (around 54%). The deficit ranged from 0.5% to 4.9% of GDP.
Fig 2. Total revenue, expenditure, budget results of the Polish state budget and public debt to GDP in 2000-2022 (in %)
Source: Author’s own study based on data from the Ministry of Finance.
The state budget had a primary surplus in 13 out of 23 periods. The average ratio of the primary result to GDP was -0.3%, but the median was already positive (0.1%). The most challenging situation was in 2020, 2004 and 2002 (primary result below -1.9% of GDP), and the best situation was in 2007, 2018, 2019, 2022 and 2009 (above 0.5%). The overall level of variability was high at 359%.
The deficits occurring resulted in a steady increase in the debt of the public finance sector. In nominal terms, the debt increased from PLN 280 billion in 2000 to PLN 1,209 billion in 2022, a fourfold increase. Due to the rapidly growing gross domestic product, this debt is not a heavy burden yet. It accounted for between 37 and 54% of GDP, reaching its highest relative values between 2010 and 2013. Despite the improvement in relative volumes in the last years of the analysis, the steady increase in debt and its diversion outside the state budget is worrying (Jarocki, 2020). With unfavourable economic conditions, this will result in a debt spiral from which it will not be easy to escape.
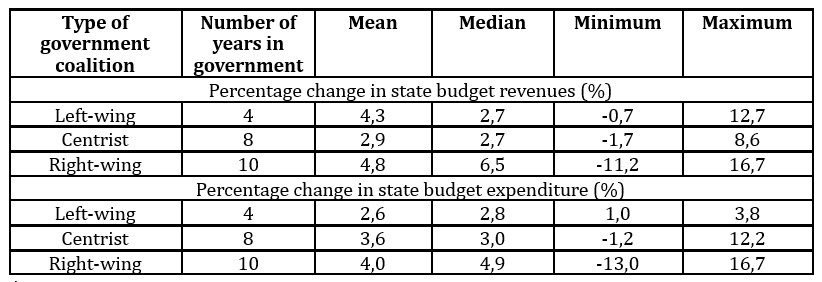
Table 1 shows the evolution of the budget size according to the government coalitions’ political views between 2000 and 2022. The 2001-2005 period is a period of governments of left-wing coalitions; 2000-2001, 2005-2007, and 2015-2022 are governments of right-wing coalitions; and 2007-2015 are centrist coalitions. The end of the term does not coincide with the end of the budget year. However, these coalitions ended their term of office between October and November, so by the end of December, they could not make significant changes to the level and structure of the state budget.
Table 1: Changes in the level of budget revenues and expenditures and the political views of the ruling cabinet
Source: Author’s own study.
An analysis of the data in Table 1 shows that the most significant increases in budget revenue and budget expenditure were observed during the right-wing coalition governments. Budget revenue grew the slowest during the centre coalition governments, while expenditure grew the slowest during the leftist coalition governments. Therefore, the observed changes are inconsistent with political views, as the budget performance was distorted by macroeconomic factors (changes in market prices, economic growth rates, and economic crises).
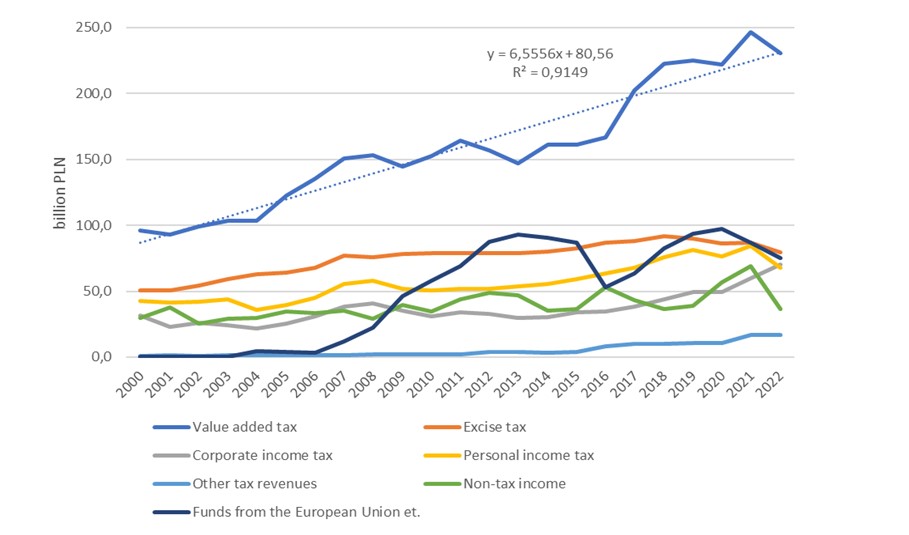
In Figure 3, the revenue of the Polish state budget in 2000-2022 by type is presented. The value-added tax is the most significant contributor to the state budget, ranging from PLN 93 billion to PLN 247 billion. Each year, on average, they increase by approximately PLN 6.6 billion. The variability of this tax was high (around 44%). A significant increase in receipts from this tax was visible between 2016 and 2018 due to the good economic situation and the sealing of the tax collection system. The excise tax was the second largest revenue earner. It generated between PLN 27 billion and PLN 80 billion, with an average of around PLN 55 billion. Revenue from this tax is characterised by the lowest volatility among the economic categories considered (ca. 23%). This was followed by inflows from personal income tax and foreign sources (EU mainly). A steady, albeit slight, upward trend is observed in the case of PIT. Its reversal does not occur until 2022 because of significant changes in the collection system for this tax (reduction of tax rates and a significant increase in the tax-free amount).
Fig 3. Revenue of Polish state budget in 2000-2022 by type
(in billions PLN, in fixed prices from 2022)
Source: Author’s own study based on data from the Ministry of Finance.
EU revenue is characterised by high volatility (around 82%). It results from the fact that these funds are available only after Poland acceded to the European Union and from the schedule of applying for and settling funds from successive financial perspectives of the European Union. Usually, for the first two to three years of the new financial perspective, a significant decrease in support is observed as new projects are in the pre-investment or early investment phase. In recent years, the importance of corporate income tax revenues has increased, while the importance of non-tax and other tax revenues has decreased. High and statistically significant correlations are observed between all tax revenues to the budget and the volume of GDP (over 93%, at p < 0.000).
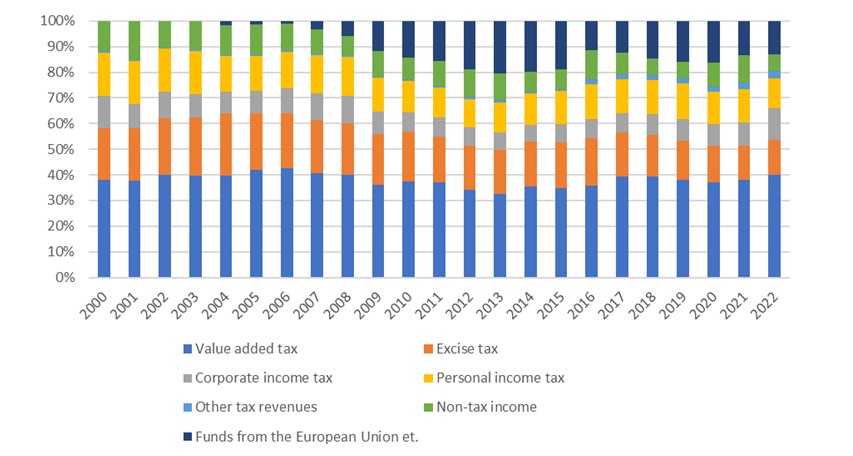
The next step is to examine the structure of budget revenue. The structure indicators are shown in Figure 4, and the structure dissimilarity indicators are shown in Table 4. Analysis of the structure of state budget revenues shows that significant changes are observed during the period under review. VAT is responsible for about 38% of revenue, excise duties for about 19%, PIT for 13%, EU funds for about 12%, non-tax revenues for about 10%, and CIT for about 8%.
Fig 4. Structure of revenue of Polish state budget in 2000-2022 by type (in %)
Source: Author’s own study based on data from the Ministry of Finance.
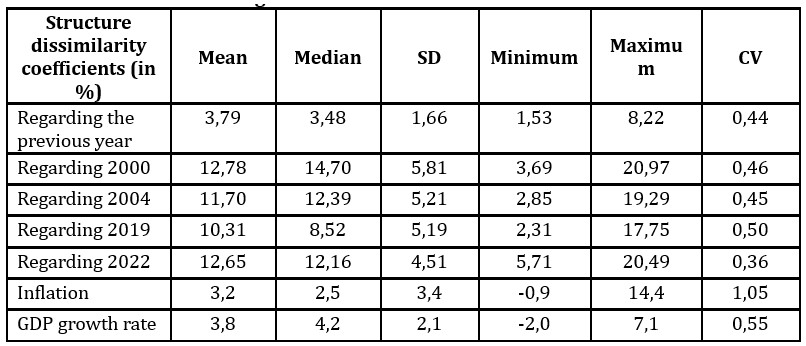
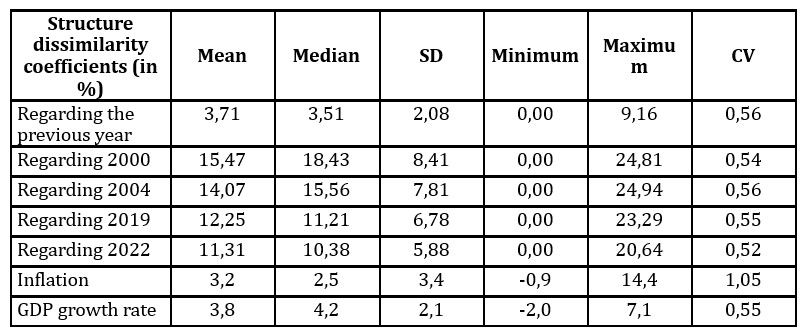
When analysing the changes in the structure from year to year, it can be observed that they are relatively small, around 4%. The most significant changes were observed in 2009 and 2016 and were related to the inflow of funds from the European Union. Analysing the changes against a fixed reference base (2000 and 2022), it can be observed that significant deviations (above 10%) occurred after 2009. Poland’s accession to the European Union does not immediately affect the structure of budget revenues. Only the inflow of funds from the new financial perspective 2007-2013 significantly impacts the state budget. This is despite the lower economic growth rate observed after the financial crisis. Also, the coronavirus pandemic does not significantly affect changes in the structure of budget revenues. Analysis indicated that they are not significantly correlated with inflation (correlation coefficient 0.04, at p = 0.60) and the GDP growth rate (correlation coefficient = 0.12, at p = 0.76).
Table 2: Descriptive statistics of dissimilarity coefficients of state
budget revenue structures in 2000-2022
Source: Author’s own study based on data from the Ministry of Finance.
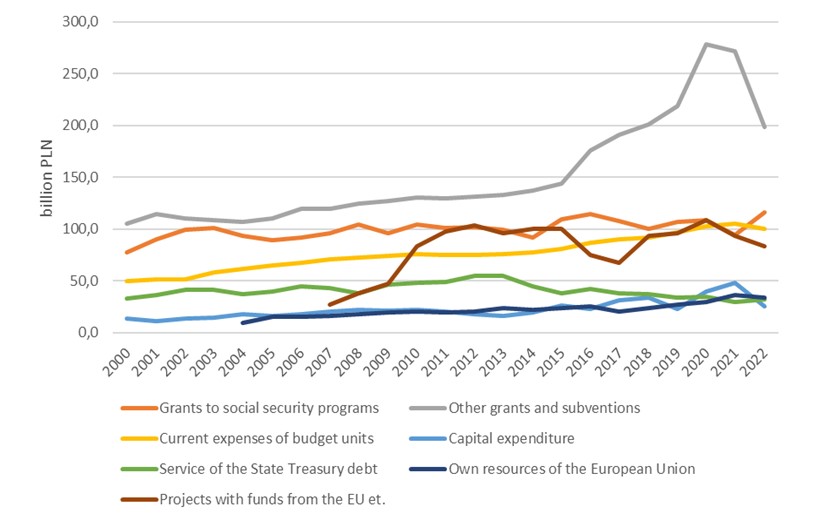
In Figure 5, the expenditure of the Polish state budget in 2000-2022 by type is presented. The most significant are other grants and subventions (Fig. 5). These ranged from PLN 106 to 279 billion, with an average of around PLN 150 billion. Most go for local government units for their current and investment activities. Until 2021, funds from the 500+ programme were also intended to support families raising children. From 2022 onwards, this programme has been financed through grants to institutions in the social security sector. The second way of spending was grants for social security sector institutions. On average, around PLN 100 million was allocated to them. In contrast to other subsidies, they were characterised by high stability in the budget (the coefficient of variation was around 9%). In third place was expenditure on projects financed by the European Union. Although significant flows have appeared since 2007, it has only been from 2009 onwards that they formed a significant part of budget expenditure, supporting the development of businesses, local authorities, and agricultural activity. It was about PLN 82 billion on average (coefficient of variability of about 29%). The fourth direction of expenditure was the current expenditure of budgetary units, i.e. funds allocated for the maintenance of the state. A constant upward trend characterised these expenditures and has increased from PLN 50 billion to over PLN 100 billion. A smaller share was accounted for by expenditure on servicing State Treasury debt and membership fees to the European Union budget. The former declined, while the latter gradually increased, which is related to the mechanism of calculating these contributions depending on gross national income. The state allocated the most minor funds for direct investments. This was around PLN 22 billion, although their value increased from PLN 13 billion to PLN 40 billion. Current expenditures, as well as subsidies and the contribution to the EU, showed a highly significant correlation with the level of GDP (correlation coefficient above 0.93, with p < 0.000).
Fig 5. Expenditure of Polish state budget in 2000-2022 by type
(in billions PLN, in fixed prices from 2022)
Source: Author’s own study based on data from the Ministry of Finance.
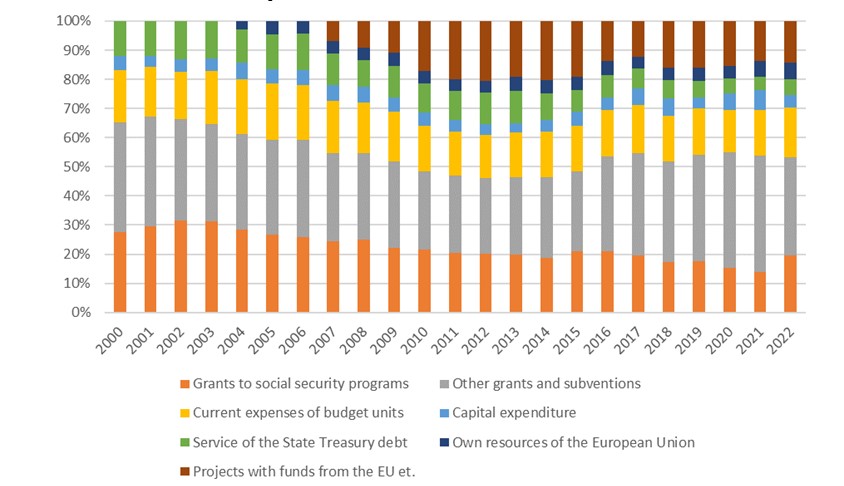
The next step is to examine the structure of budget expenditure. The structure indicators are shown in Figure 6, and the structure dissimilarity indicators are shown in Table 3. Grants and subventions accounted for the largest share of expenditure. Grants to institutions of the social security sector followed – for 22% on average, with 21% variability, while other grants and subsidies accounted for 32% of expenditure, with 13% variability. Current expenditures of budget units account for about 16%, projects with EU funds account for about 11%, and debt service accounts for about 10%. The structure indicators are generally characterised by moderate volatility; only for member contributions to the EU budget and projects financed with EU funds, the volatility is high (48 and 73%).
Fig 6. Structure of expenditure of Polish state budget in 2000-2022 by type (in %)
Source: Author’s own study based on data from the Ministry of Finance.
Table 3: Descriptive statistics of dissimilarity coefficients of state budget
expenditure structures in 2000-2022
Source: Author’s own study based on data from the Ministry of Finance.
An analysis of the expenditure structure shows that there have been significant changes in this area of the budget (Table 3). The most considerable year-on-year changes occurred in 2007, 2010, 2016, 2020 and 2022 – more than 5%. Significant changes occurred from 2007 onwards, with the most incredible intensity between 2010 and 2015 when European Union funds were allocated. Again, 2004 was not associated with significant changes in the structure of budget expenditure. In contrast, there were noticeable changes during the pandemic, with the most incredible intensity in 2021. Changes in the expenditure structure were weakly correlated with inflation and GDP and were not statistically significant (correlation coefficient 0.21, p = 0.51 and 0.18, p = 0.85). Analysis of the indices of dissimilarity of structures in both parts of the budget indicates that the observed differences between changes in the revenue structure and expenditure structure are statistically insignificant.
Summary
The study aims to assess changes in the size and structure of revenue and expenditure in Poland’s state budget between 2000 and 2022. Analyses have shown a permanent imbalance in the budget. However, the situation is not as bad, as the budget’s operating result oscillates around zero, and the debt to GDP is falling. Both revenues and expenditures have gradually increased. The volatility of budget revenue and expenditure is moderate. Only the use of EU funds is characterised by high volatility. The revenue and expenditure structure is variable. However, the emerging crises had little impact on the structure of the budget, only on its level of expenditure. Changes in the size of the budget were mainly due to the level of inflation and the rate of economic growth, as well as the inflow of funds from the European Union budget. As a result, the hypothesis is confirmed.
The state budget should continue to be monitored due to changes in Poland’s macroeconomic and political environment and changes in social security provided by the government. Despite the introduced anti-inflation shields, inflation remains high. Reductions in VAT tax rates cannot be introduced permanently. Social benefits related to the 500+ and 800+ programs and the thirteenth and fourteenth pensions are increasing, with a simultaneous increase in the minimum wage. Additionally, the government of both the current and future coalition announced further changes in the tax-free allowance, energy transformation and an increase in spending on national defence, health care and housing. All these proposed changes reduce budget revenues and increase expenses, consequently increasing the budget deficit. As a result, in 2024, Poland is already at risk of being subject to the EU’s excessive deficit procedure.
There is currently no political will to improve the revenue base significantly. Only the new taxes will be introduced due to solutions implemented in the European Union. On the other hand, there is no will to reduce social spending significantly. As a result, reducing the deficit will only be possible by limiting current expenditure and taking actions to support economic development so the deficit to GDP ratio is reduced.
References
Bayramov, S. (2020), ‘Structural efficiency of budget expenditures as a stability factor of the budget system,’ Economic and Social Development: Book of Proceedings, 4, 262-268.
Bell, G. (1975), ‘How States Manage Expenditures in an Inflationary-Recessionary Economy,’ Public Administration Review, Vol. 35, No. 5, 534–537
Chugunov, I., & Makohon, V. (2019), ‘Fiscal strategy as an instrument of economic growth,’ Baltic Journal of Economic Studies, 5(3), 213-217.
Dżugaj, M. (2022), Państwowy dług publiczny – opis zjawiska na przestrzeni lat [State public debt over the years – a description of the phenomenon], Bezpieczeństwo i stabilność jako wartość chroniona na gruncie prawa finansowego [Security and stability as a value protected under financial law], Wróblewska, D. and Bożek, W. (ed), ArchaeGraph, Łódź.
Gonet, W. and Suchodolski, B. (2021), ‘Stabilność dochodów i wydatków publicznych w sytuacjach kryzysowych w kontekście realizacji zadań publicznych [Stability of Public Income and Expenditure in Crisis Situations in the Context of Fulfilling Public Tasks]’, Finanse Komunalne, 4, 53-74.
Jaen-Garcia, M. (2021), ‘Displacement Effect and Ratchet Effect: Testing of Two Alternative Hypotheses,” SAGE Open, January-March 2021, 1-18, DOI: 10.1177/21582440211003577
Jarocki, T. (2020), ‘COVID-19 a stabilność systemu finansów publicznych w Polsce. Wpływ pandemii na bezpieczeństwo ekonomiczne kraju [Covid-19 The Impact Of Pandemic On The Economic And A Stability Of The Public Finances],’ Acta Scientifica Academiae Ostroviensis. Sectio A, Nauki Humanistyczne, Społeczne i Techniczne, 1-2 (15-16), 111-129, https://doi.org/10.1111/j.1468-0475.2010.00517.x
Köppl-Turyna, M., Kucsera, D. and Neck, R. (2017), ‘Growth of public consumption in Austria: Testing Wagner’s law and Baumol’s cost disease,’ Agenda Austria Working Paper, No. 10.
Krajewski, S. (2013), ‘Assessment of Poland’s economic policy during the crisis,’ Olsztyn Economic Journal, 8(3), 195-210.
Kuckuck J. (2014), ‘Testing Wagner’s Law at Different Stages of Economic Development,’ FinanzArchiv / Public Finance Analysis, March, Vol. 70, No. 1, pp. 128-168.
Lamartina, S., Zaghini, A. (2011), ‘Increasing Public Expenditures – Wagner’s-Law in OECD Countries,’ German Economic Review, 12(2), 149-164.
Łożykowski, A. (2023), Polski Ład z perspektywy sektora finansów publicznych, Polski Ład a opodatkowanie dochodów. Ujęcie prawne, finansowe i ekonomiczne, Małecka-Ziembińska, E., Wydawnictwo Uniwersytetu Ekonomicznego w Poznaniu, Poznań.
Lubieniecka, M. (2013), ‘Budżet państwa w obliczu wahań koniunktury gospodarczej na przykładzie gospodarki polskiej [The State Budget in the Face of Economic Fluctuations on the Example of the Polish Economy],’ Nierówności społeczne a wzrost gospodarczy, 30, 245-260.
Malinowska-Misiąg, E. (2017), ‘Przejrzystość fiskalna a stabilność polskiego systemu finansów publicznych [Fiscal transparency and the stability of the Polish public finance sector],’ Kwartalnik Kolegium Ekonomiczno-Społecznego „Studia i Prace”, 1, 31-44.
Misiąg, W. (2020), ‘Wpływ pandemii COVID-19 na polskie finanse publiczne – źródła finansowania, wydatki, procedury [Impact of the COVID-19 pandemic on Polish public finances – sources of financing, expenses, procedures],’ Kwartalnik Prawno-Finansowy, 1, 7-25, DOI: 10.34616/kpf.2020.1.7.25
Obłąkowska, K. A. (2023), ‘Mentalność podatkowa Polaków i opinia publiczna na temat wysokości VAT i akcyzy w latach 2022-2023 – perspektywa ekonomii behawioralnej,’ Doradztwo Podatkowe – Biuletyn Instytutu Studiów Podatkowych, 7(323), 25-33.
Owsiak, S. (2017), Finanse publiczne [Public finance], PWN, Warszawa.
Petek, G. (2022), ‘Considering Inflation’s Effects on State Programs,’ LAO, California. [On-line],[Retrieved November 16, 2023], https://lao.ca.gov/Publications/Report/4647
Pułaska-Turyna, B. (2011), Statystyka dla ekonomistów [Statistics for economists], Difin, Warszawa.
Ramey, V. A. (2019), ‘Ten Years After the Financial Crisis: What Have We Learned from the Renaissance in Fiscal Research?’ The Journal of Economic Perspectives, Vol.33 (2), 89-114.
Redo, M., Wójtowicz, K. and Ciak, J. (2018), Bezpieczeństwo finansów publicznych [Security of public finances]. CeDeWu, Warszawa.
Rubin, I. (2020), The Politics of Public Budgeting Getting and Spending, Borrowing and Balancing. Northern Illinois University, USA.
Shkarlet, S., Dubyna, M., Hrubliak, O. and Zhavoronok, A. (2019). ‘Тheoretical and applied provisions of the research of the state budget deficit in the countries of Central and Eastern Europe,’ EDITURA ASE, Bukareszt. Administratie si Management Public, 32, 120-138, DOI: 10.24818/amp/2019.32-09.
Skuza, J. (2021), ‘The relationship between state budget revenues from corporate income tax and the amount of private investment by small, medium, and large enterprises,’ Olsztyn Economic Journal, 16(2), 181–191, DOI: 10.31648/oej.7579.
Sokołowski, J. (2008), Struktura wydatków budżetu państwa w latach 2001-2006 [The structure of budgetary central government expenditure 2001-2006], Współczesne finanse – stan i perspektywy rozwoju finansów publicznych [Contemporary finances – state and prospects for the development of public finances]. Głuchowski J. (ed), UMK in Toruń, Toruń.
Sosnowski, M. (2014), ‘Sprawność fiskalna podatków pośrednich [Fiscal Efficiency of Indirect Taxes],’ Prace Naukowe Uniwersytetu Ekonomicznego we Wrocławiu, 346, 257-266.
Uzasadnienie do projektu ustawy budżetowej na 2021 r. [Justification for the draft budget act for 2021] (2021), Ministerstwo Finansów, Warszawa.
Wagner, A. H. (1883), Finanzwissenschaft. Leipzig
Walesiak, M. (1984), ‘Pojęcie, klasyfikacja i wskaźniki podobieństwa struktur gospodarczych [The concept, classification, and indicators of similarity of economic structures],’ Prace Naukowe Akademii Ekonomicznej we Wrocławiu, 285, 57-78.
Wierzbicka, W. and Kalitka, Z. (2023), ‘Budget Revenues in Poland During the Financial Crisis of 2007 and The Covid-19 Pandemic,’ Olsztyn Economic Journal, 18(1), 39–50, DOI: 10.31648/oej.9543.
Wierzbicka, W., Nierobisz, A. and Sobiecki, M. (2021), ‘Stability of tax revenue in Poland’s national budget in 2004-2020,’ Olsztyn Economic Journal, 16(1), 87–100, DOI: 10.31648/oej.7313.
Wilczyńska, K. (2008), ‘Budżet państwa – wielkość, struktura, konstrukcja [The national budget – Problem of size, structure, and construction],’ Zeszyty Naukowe. Wyższa Szkoła Handlu i Usług w Poznaniu, 15, 23-34.