Jaroslav Gonos1, Katarina Culková2, Anna Tomkova1, Peter Adamisin1 and Martin Rovnak1
1Faculty of Management and Business, University of Presov, Presov, Slovakia
2Institute of Earth Sources, Technical University of Kosice, Slovakia
Volume 2025,
Article ID 195450,
Journal of Eastern Europe Research in Business and Economics,
21 pages,
DOI: https://doi.org/10.5171/2025.195450
Received date: 3 June 2025; Accepted date: 15 June 2025; Published date: 10 July 2025
Academic Editor: Anna Mazurkiewicz
Cite this Article as:
Jaroslav Gonos, Katarina Culková, Anna Tomkova, Peter Adamisin and Martin Rovnak (2025)," Identification and Assessment of Quality of Life in the context of the Human Development Index in Europe ", Journal of Eastern Europe Research in Business and Economics Vol. 2025 (2025), Article ID 195450, https://doi.org/10.5171/2025.195450
This article aims to explain the basic concepts of gross domestic product, standard of living, quality of life and economic indicators that will serve as tools for analysis. The main objective is to compare the quality of life between individual countries using the Human Development Index, focusing on the countries known as the Bucharest Nine in the period 2007 to 2021. This group includes: Poland, Bulgaria, Romania, the Czech Republic, Estonia, Hungary, Latvia, Lithuania and Slovakia. The Federal Republic of Germany, a representative of Western Europe, was chosen as a reference point for comparison. The analysis is based on specifically selected socio-economic indicators through which the quality of life in the given countries is assessed.
Keywords: gross domestic product, life quality, living standards, index of human development, Bucharest Nine
Introduction
The quality of life of an individual can be analyzed through various frameworks, breaking it down into fundamental components or constructs that influence overall well-being. Quality of life has a social dimension, and this concept is primarily explored by the social sciences. The study of human quality of life, its development, and the possibilities for influencing it has become an increasingly important area of research. It is crucial to recognize that both economic and non-economic factors affect this concept in different ways. Today, there are many indicators that help quantify the various dimensions of human development. When measuring quality of life, we encounter data that can be easily quantified and numerically identified, as well as data with a subjective component that we classify as abstract variables. If we examine the concept of quality of life from a historical perspective, it would be associated with foundational disciplines such as economics, sociology, and medicine. Historically, the focus has been more on social groups than on individuals, particularly on objective factors, through which we define the essential conditions in which people live.
When defining quality of life, it is important to recognize that it can be viewed from various perspectives. Firstly, it depends on the starting points and objectives of the quality of life being assessed. Most people instinctively associate quality of life with individual well-being, particularly from a psychological perspective. However, it is crucial to remember that many professionals, including health experts, analyze quality of life at a macro level, referring to entire populations or nations. While some indicators, such as income, education, and healthcare, are universal, others may vary depending on cultural context and societal values (Veenhoven, 2000). According to the Business Dictionary (2018), the standard of living is defined as financial well-being, primarily measured by per capita income and the consumption of goods and services by individuals or households. When evaluating the standard of living, it is also essential to consider factors such as the scope and quality of public services, food, environmental conditions, social security, healthcare availability, opportunities for self-realization, access to education, cultural activities, and other variables. In a narrower sense, the standard of living can be understood as the monitoring of income and expenditures, specifically the composition of a population’s spending patterns.
The aim of the paper is to assess the possibilities for improving the quality of life in the Bucharest Nine region. This goal is influenced by the success of the economy, the overall level of GDP, and the rate of economic growth. To achieve this objective, indicators such as the Human Development Index (HDI) were used, along with components like life expectancy at birth, average years of schooling, expected years of education, gross national income per capita, GDP, registered unemployment rate, average annual wage, and the cost-of-living index.
Present state of problem solving
Human Development Index (HDI) has been widely criticized in the welfare economic literature, yet it is still the most influential income-alternative with multidimensional measuring (Fumagalli, 2021). Economic position of inhabitants is closely related to the living standards of the country´s population, which can be understood as a comprehensive measurement of socio-economic prosperity of the country. Jordé and Sarabia (2015) show absolute convergence in human well-being is satisfactorily represented by a conventional linear specification. However, the income and education indicators exhibit nonlinear patterns.
Hanová et al. (2015) studied mentioned by using such indexes as HDI, quality of life index, better life index, etc. with the aim to compare countries. The results show there are differences in regions; for example, inhabitants of northern and western European countries have the best economic position. The differences between regions are confirmed in case of Croatia, when eastern Croatian regions achieved good level of HDI, as pointed by Aksentijevic and Jezic (2015); and in Indonesia (Permai et al., 2016), when Jakarta region has the highest HDI in Indonesia. In addition, South Asian regions have different HDI index, when Shrotryia (2020) pointed to the not promising development. In India (see Arora and Ratnasiri, 2015), economic well-being of states has declined, when the reforms have positively influenced more developed high well-being states, not low well-being states. Due to the differences in regions, Smits and Permanyer (2019) recommended the establishment of sub-national HDI databases, which take regional variations into account and assess factors such as education, health, and living standards. Ikeda and Managi (2019) provide future scenarios for different regions in Japan based on shared socioeconomic pathways (SSPs). We then propose an Inclusive Wealth Index (IWI) under different future scenarios for 2015-2100. We find that future Japan remains sustainable under all SSPs in 2100 by comparing it with wealth levels in 2010.
Nowadays, ecosystem services influence human well-being (Villamagna and Giesecke, 2014), mainly in areas of psychology, economics and international development. HDI is influenced also by present day sedentary way of life, especially among children. This area is studied by Dumuid et al. (2018), showing children from countries of higher human development index reported stronger positive relationships between health-related quality of life and moderate-to-vigorous physical activity. Addressing today’s unhealthy lifestyles can lead to an increase in the quality of life of the population (Barber et al., 2017). The mentioned indicator is measured by healthcare access and quality (HAQ), which increased according to Haakenstad et al. (2022) in the analyzed countries overall to 2019. According to Yang (2018), health is strongly prioritized over income. Nowadays ecosystem services influence human well-being (Villamagna and Giesecke, 2014), mainly in areas of psychology, economics, and international development. HDI is also influenced by present day sedentary way of life, especially among children. This area is studied by Dumuid et al. (2018), showing children from countries of higher human development index reported stronger positive relationships between health-related quality of life and moderate-to-vigorous physical activity. The mentioned indicator is measured by healthcare access and quality (HAQ), which increased according to Haakenstad et al., (2022) in the analyzed countries overall to 2019. Rojas (2020) confirms the same, showing economic development can be provided not in terms of greater income, but in terms of people well-being, life satisfaction and health. Therefore, most organizations are establishing well-being programs and management (Lisovskaia, 2022).
Methodology
The primary objective is to compare international differences in the quality of life using the Human Development Index, focusing on the B9 countries over a defined period. The Bucharest Nine consists of the following countries: Poland, Bulgaria, Romania, the Czech Republic, Estonia, Hungary, Latvia, Lithuania, and Slovakia. For comparative purposes, we have selected Germany, the leader of Western Europe. The required data and information will be collected for the period from 2007 to 2021.”
Quality of life is measured using various indicators. Since the 1970s, numerous studies have focused on identifying and developing these indicators. However, there has been no consensus among researchers regarding the most appropriate approach to measuring quality of life. To effectively analyze and evaluate this concept, it is essential to consider what aspects of quality are being assessed and for whom. Therefore, quality of life must be represented through specific indicators.”
A number of authors have reached a consensus on categorizing quality of life measurement indicators into three main types. Bacova (2008) and Hamrackova (2013) identify the following types of indicators, which will be utilized in this research.
Economic indicators – in addition to the usual indicators, e.g. GDP and income, we can also include consumer flows, wealth stocks, poverty, economic security, etc. Economic indicators are mainly used in politics and the public sector.
Social indicators – represent social measures that objectively reflect conditions in a certain cultural and geographical unit. They are observed more in objective quantitative statistics than in the perception of people’s social environment. We include areas such as: well-being, ecology and education. These indicators are often defined as objective indicators of the quality of life and, above all, objectivity is their strong point.
Subjective indicators – observe the level of quality of life itself and help to measure and understand the quality of life of specific persons. They approach the emotional understanding of an individual’s life, especially about experiencing one’s own life and well-being. In the measurement here, we use indicators of satisfaction (positive or negative affect), and they can be expanded to include feelings of meaning, fulfillment, and happiness.
A consistent and dependable evaluation of quality of life that most experts would endorse has yet to be developed. The main reason for this disagreement is that it contains two relatively independent components, namely subjective and objective. The authors state the components as subjective and objective (Masarova and Zivcicová, 2012) as follows:
Subjective quality of life – derived from the utility and meaning for the individual. This refers to a good feeling of life, satisfaction and well-being. The measurement mostly uses data obtained through public opinion polls.
Objective quality of life – here indicators of economic justice, education, health, security, etc. are mainly used. It represents the fulfillment of the material needs of life. The value of life is determined and does not change over time. Objectives of life quality are variables that can be observed by several people, and it is possible to estimate the quantity and frequency.
Based on the definitions above, it can be observed that the subjective dimension focuses on measuring the quality of life of individuals or groups, while the objective dimension evaluates the quality of life at a broader level, such as that of a state. Although these two perspectives approach the concept from different angles, they are fundamentally interconnected and cannot be considered in isolation. Only by combining both subjective and objective measures can we obtain accurate and comprehensive insights into the quality of life. One of the most significant indicators for assessing living conditions is the Human Development Index (Tokarova, 2002). In this research, the HDI, Gross National Happiness (GNH), and Economic Freedom Index (EFI) are utilized as key indicators.
Human Development Index
The Human Development Index (HDI) is a socio-economic indicator that measures the average level of human development achieved in a country. It is calculated based on three key dimensions considered essential for human development (Tokarová, 2002). The HDI serves as a composite indicator that reflects average outcomes across these core dimensions and is determined as the geometric mean of the normalized indices for each of the three dimensions (Nagel, 2004).
Gross National Happiness
The Gross National Happiness (GNH) Index is built upon four pillars: good governance, sustainable socio-economic development, the preservation and promotion of culture, and environmental conservation and protection. These pillars are further divided into nine domains, which encompass various components of the index and serve as the foundation for its measurement (GNH Centre, 2019). The GNH Index offers a more holistic assessment of a country’s well-being than GDP, emphasizing that true societal development occurs when material and spiritual growth progress together and mutually reinforce each other (Ura et al., 2012).
Economic Freedom Index
The Economic Freedom Index is an economic indicator that evaluates the level of economic freedom across countries worldwide. It is based on several criteria, including the protection of private property, business freedom, regulatory efficiency, and government transparency (Masarova & Zivcicová, 2012). The primary aspects of economic freedom include:
personal choice;
free exchange coordinated by markets;
freedom of market entry;
security of persons and their property from aggression by others.
Countries characterized by high economic freedom frequently attain substantial economic growth and productivity levels, thanks to their ability to invest, engage in business, and trade freely, resulting in more favorable environments for job creation and economic development. Countries that would attempt to achieve a high score on the Economic Freedom Index must provide secure protection for private property, a legal system that treats everyone equally, objective contract enforcement and a stable monetary environment. They need to maintain low taxes, avoid creating obstacles to both domestic and international trade, and show greater interest in and dependence on market dynamics rather than on government spending and regulations (Economic Freedom Basics, 2019).
Object of solving – Bucharest 9
The Bucharest Nine is a group of nine Central European countries founded in 2015 with the aim of promoting cooperation between these countries and strengthening their position within Europe and the world. This initiative was created in response to the increasing perception that Central European nations are frequently underappreciated and overlooked in the decision-making processes at both European and global levels. These countries were often under the influence of the Soviet Union until their liberation after 1989 (Banasik, 2021).
Nine countries (Poland, Bulgaria, the Czech Republic, Estonia, Hungary, Latvia, Lithuania, Romania, and Slovakia) form an initiative aimed at coordinating the security positions of nations on NATO’s eastern flank. A common feature of the Bucharest Nine countries is their geographical location and a shared understanding of security threats. These countries have faced similar negative historical experiences and are now exposed to new security challenges. Their cooperation strengthens their position in negotiations with partners within the EU and NATO.
The B9 has an ambitious plan to deepen cooperation across various sectors, including economy, politics, culture, science, and technology. Another objective is to improve infrastructure and transport links within the region, creating new opportunities for business and economic growth.
The B9 countries also play a significant role in the field of energy and natural resources due to their strategic location between Eastern and Western Europe. Enhanced cooperation can contribute to greater energy security and the diversification of energy supplies across Europe.
However, some member states hold differing views on key issues, such as migration and European integration. These differences can hinder the group’s efforts and its ability to achieve shared goals.
Overall, the Bucharest Nine represents a vital initiative for strengthening cooperation among Central and Eastern European countries and enhancing their position within Europe and globally. One of the primary challenges remains maintaining unity and effective collaboration within the group. Given the diverse interests and priorities of member states, it is crucial to identify common objectives that benefit all parties involved (Gerasymchuk, 2019).
Data source
The primary data sources were derived from three key providers: the Human Development Reports issued by the United Nations, Eurostat, and Numbeo, which offers global databases regarding living costs worldwide. The data for the Human Development Index and its components —such as life expectancy at birth, average years of schooling, average education years, and gross national income adjusted for purchasing power parity in US dollars— are sourced from the annual Human Development Reports provided on the United Nations Development Program’s website. Data on the registered unemployment rate and average annual wage come from Eurostat statistics. The values of the cost-of-living index were obtained from Numbeo databases.
Application of statistic methods
The development of the index was examined through three hypotheses, with the primary objective of identifying statistically significant relationships between specific indicators and key economic variables. To achieve this, methods from applied statistics were employed, including the Shapiro-Wilk test, Kendall’s rank correlation coefficient, and correlation analysis. The analysis and graphical visualization of the results were conducted using MS Excel and Statistica 13.
Hypothesis
H1: We assume that there is a statistically significant relationship between the economic indicator average annual wage and the Human Development Index (HDI) in measuring the quality of life for the monitored period 2007-2021 in the selected Bucharest Nine countries.
H2: We assume that there is a statistically significant relationship between the economic indicator gross domestic product and the Human Development Index (HDI) in measuring the quality of life for the monitored period 2007-2021 in the selected Bucharest Nine countries.
H3: We assume that there is a statistically significant relationship between the economic indicators, registered unemployment rate and the Human Development Index (HDI) in measuring the quality of life for the monitored period 2007-2021 in the selected Bucharest Nine countries.
Results
Human Development Index
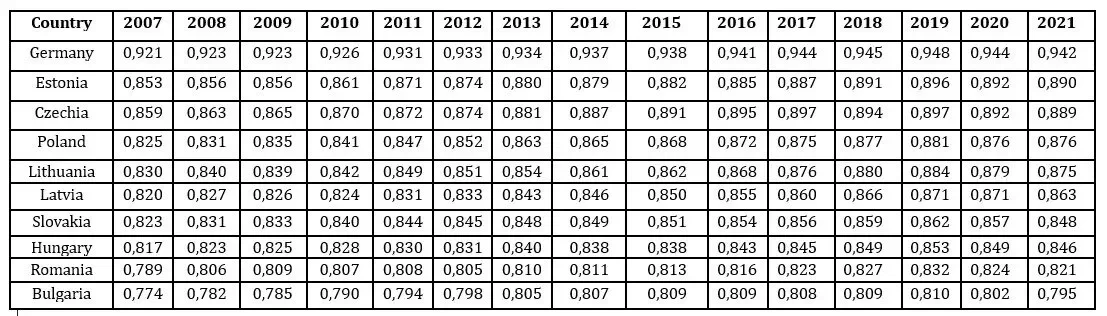
The following section provides an overview of the selected socio-economic indicators that will be used to analyze the quality of life in each of the ten selected countries during the monitored period from 2007 to 2021. Each indicator will be analyzed individually. The development of the Human Development Index (HDI) is presented in Table 1.
Table 1: The development of the Human Development Index (HDI
Table 1 represents the permanent development of the human development index in the selected Bucharest Nine countries, at the same time we wanted to point out the leader of Western Europe, namely Germany, in the period 2007-2021. It is also important to note that the new calculation for the HDI implemented since 2010 takes into account the differences acquired within the individual dimensions based on the geometric mean. A negative state in each of the dimensions is now reflected directly in the overall HDI, which shows how well a given country is doing in each of the dimensions separately. This means that a low share in one dimension is no longer directly offset by a high performance in another dimension.
The increase in HDI over the monitored period is lower for the Bucharest Nine than for the developed western country of Germany, which ranks 9th in the HDI ranking in 2021. Compared to the entire Bucharest Nine, Germany achieves much better result; whether we compare 2007, 2015 or 2021, none of the B9 countries comes close to Germany in terms of values. HDI has been growing over several years. The leaders of the B9 with the highest measured value are Estonia, which ranks 31st together with the Czech Republic, which ranked 32nd in the HDI ranking in 2021. Next is Poland, where it is clear that there has been a significant improvement in the indices. Poland ranks 34th in the ranking. Next is Lithuania, which ranked 35th, and Latvia, with 39th place in the aforementioned ranking. Slovakia’s HDI value in 2021 was at 45th position. Since 2007, Slovakia has seen a significant increase in this value, with the country moving from a high HDI level to a very high HDI level during the monitored period. This is followed by Hungary, which ranked 46th, and Romania, with 53rd place. On the contrary, Bulgaria showed the lowest values during the monitored period, which ranked 68th in the HDI ranking in 2021. UNDP presents the borderline values of the Human Development Index, and an HDI value of 0.800 classifies very high human development. Through this, we can conclude that all countries except Romania and Bulgaria reached the upper limit of human development every year for the monitored period of 2007-2021.
Average life expectancy at birth
This sub-index of the Human Development Index (HDI) serves as a valuable indicator of a society’s overall condition and its development trajectory. Average life expectancy at birth can be influenced by a range of factors, including genetics, environmental conditions, dietary habits, and access to healthcare services.
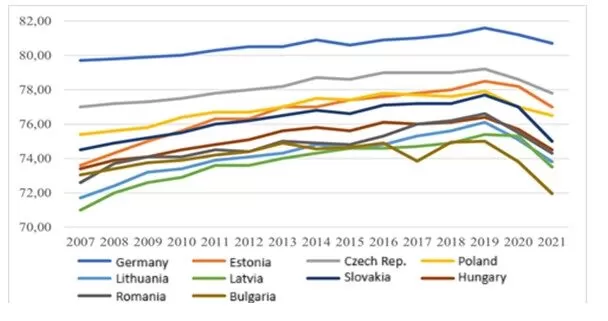
Countries with a low HDI typically exhibit lower average life expectancy, often due to limited access to healthcare, widespread poverty, and poor living conditions. Conversely, nations with a high HDI tend to have longer life expectancies, largely attributed to higher-quality healthcare systems, better living standards, and improved access to education. Figure 1 illustrates the evolution of this indicator across the monitored countries over the observed period.
Fig 1. Average life expectancy at birth for the period 2007-2021
The life expectancy at birth index closely reflects the HDI rankings of the countries under comparison. Germany consistently ranks as the leader, recording the highest annual values, which underscores the international disparities in life expectancy. This trend highlights how countries with a high HDI typically achieve longer life expectancies, often due to the availability of high-quality healthcare services. Within the Bucharest Nine, the Czech Republic recorded the highest life expectancy in 2021, reaching 77.8 years, while Bulgaria reported the lowest, with an average life expectancy of 71.95 years.
Average school attendance
An educated population is more likely to invest their money in education and healthcare, which can improve the overall quality of life in a society. The average number of years of schooling can be influenced by many factors, including the quality of education, the availability of education, and the economic situation in the country. Countries with a low HDI may have insufficient infrastructure to provide quality education or insufficient financial resources to support education. In these countries, people may be forced to work from a young age, and a lack of financial resources can hinder access to education. On the other hand, countries with a high HDI tend to invest in education and create educational opportunities for everyone (Piketty, 2015).
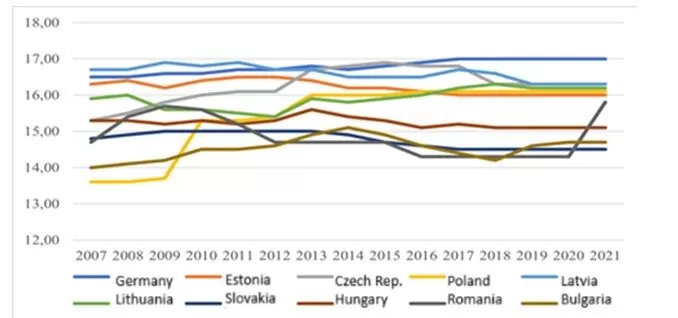
Fig 2. Average school attendance in 2007-2021
Figure 2 shows the average number of years of schooling for the observed period of years. The average of the numerical data of the analyzed countries for the observed period creates the following ranking: Germany – 16.79 years, Lithuania – 16.61 years, Czech Republic – 16.27 years, Estonia – 16.21 years, Latvia – 15.91 years, Poland – 15.43 years, Hungary – 15.24 years, Romania – 14.85 years, Slovakia – 14.76 years and in the last place in the sub-index of the average number of years of schooling was Bulgaria – 14.53 years. The years 2007 to 2011 are considered important, when there was a short-term change in the table ranking, when Lithuania was placed ahead of the leader of Western Europe, Germany. The numerical difference was not particularly large, but the significance lies in the fact that the Bucharest Nine countries ranked ahead of the important western country of Germany.
Expected years of education
Expected years of schooling can be defined as the average number of years an individual in a given country can expect to spend in the school system. Expected years of schooling have increased significantly compared to the past. In the past, it was common for children to attend school for only a few years to learn basic reading, writing and arithmetic. Today, most children are expected to attend school for at least 12 years, and many people choose to continue their education beyond secondary school. There is a greater global demand for people with higher levels of education, who have a broader range of skills and are able to adapt to a rapidly changing labor market (Pikety, 2015).
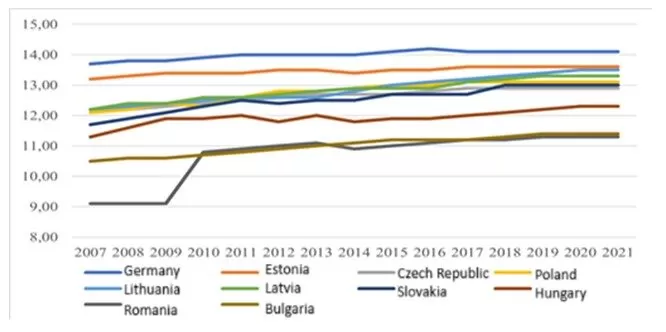
Fig 3. Expected years of education in 2007-2021
We averaged the figures from Figure 3 and created a sequential ranking consisting of the Bucharest Nine countries and Germany, the following order: Germany – 14.00 years, Estonia – 13.47 years, Lithuania – 12.87 years, Latvia – 12.84 years, Poland – 12.77 years, Czech Republic – 12.64 years, Slovakia – 12.53, Hungary – 11.93 years and the lowest age belongs to Bulgaria – 11.02 years and Romania – 10.69 years. It should be noted in particular that the comparator country Germany has a wide network of public schools and universities, which are generally accessible to all residents regardless of their financial capabilities.
Gross National Product per Inhabitant
Gross National Income (GNI) per capita measures a country’s economic performance relative to its population. It serves as a key indicator for evaluating a nation’s economic well-being, as it reflects overall economic output distributed across the population. An increase in GNI per capita can be achieved through various means, such as enhancing labor productivity, developing high value-added industries, fostering entrepreneurship, and investing in education and workforce training.
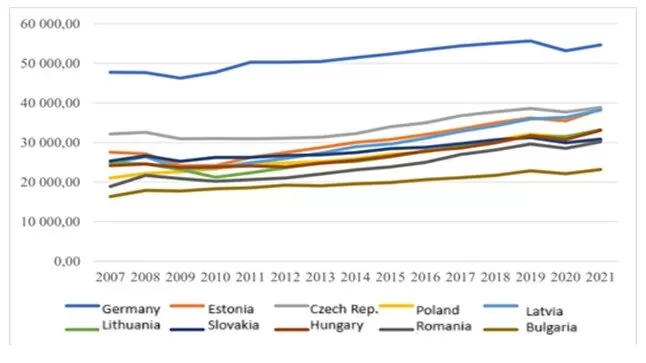
Fig 4. Development of GNP in USD in 2007-2021
Just a quick glance at Figure 4 showing the gross national income of the compared countries expressed in purchasing power parity suggests that sub-index plays a decisive role in calculating the human development index. Thus, the index directly affects and influences the overall table ranking of countries. The differences between the compared countries are truly marginal, and even when averaging the numerical data from years, the table ranking of the countries of the overall human development index does not change. The average gross national income for the given years 2007-2021 presents us with the following data. None of the B9 countries comes close to Germany, which achieves the highest values, namely 51,395.30 USD. The three leaders of the B9 with the highest average value measured are the Czech Republic (34,079.17 USD), along with Estonia (30,463.33 USD) and Lithuania (29,590.37 USD). Next is Slovakia (28,031.57 USD), Hungary (26,877.37 USD), Poland (26,723.43 USD). Conversely, the lowest values for the monitored period were shown by Latvia (26,638.70 USD), Romania (24,060.93 USD) and in the last place of the ranking is Bulgaria with a value of (19,899.27 USD).
Gross Domestic Product
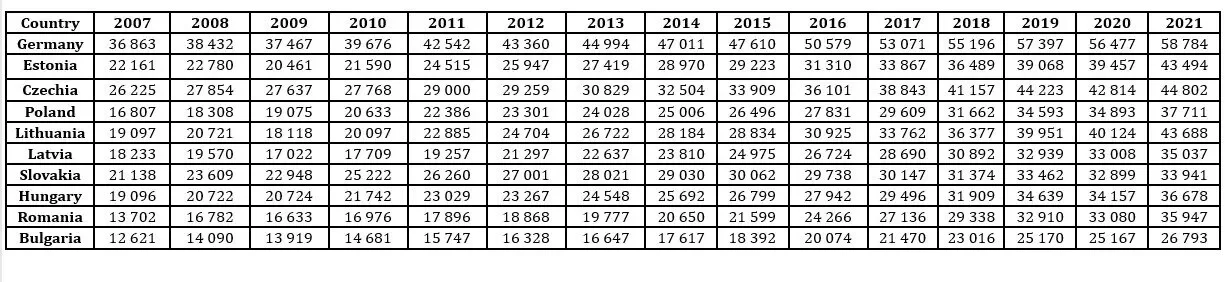
Table 2 shows the gross domestic product for the monitored countries of the Bucharest Nine and, for comparison, the leader of Western Europe, Germany, for the period 2007-2021.
Table 2: GDP development per inhabitant in USD in 2007-2021
Table 2 presents the development of gross domestic product from 2007 to 2021 in the selected countries. We can see that the average values fluctuated significantly in the monitored period. In 2009, the lowest values were measured, which arose due to the global economic crisis, which led to a decrease in values in almost all monitored countries. Poland was the only country where there was no decrease in values. In the following years, GDP growth accelerated significantly in some of the Bucharest Nine countries, mainly Estonia, the Czech Republic, Lithuania and Poland. On the contrary, in other countries, gross domestic product growth was slower. These countries include, for example, Latvia, Hungary together with Slovakia, but especially Romania and Bulgaria. Compared to the entire Bucharest Nine, Germany achieves much better result, whether we compare 2007, 2015 or 2021, none of the B9 countries comes close to Germany in terms of values.
In 2020, we could observe negative growth in gross domestic product in all monitored countries, except Latvia (Chart No. 6). The smallest drop in the Bucharest Nine is estimated for Estonia (-0.40%), Poland (-2.00%), Lithuania (-2.20%) and Slovakia (-3.40%). The highest drop is estimated for Romania (-3.70%), Hungary (-4.50%), and especially the Czech Republic (-5.50%). Germany is approaching Hungary with its negative drops with a value of (-4.10%). If we take into account quality of life indicators, it is debatable whether the increase in GDP should really contribute more significantly to improving the quality of life of citizens.
Unemployment Rate
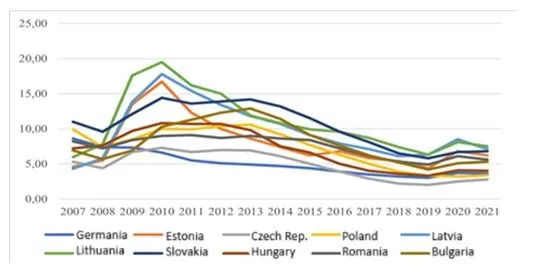
The unemployment rate is a crucial indicator not only of economic performance but also of social development. Its social dimension often offers a more comprehensive reflection of the quality of life than gross domestic product (GDP) alone. In economic terms, unemployment represents a situation where the number of job seekers exceeds the available job opportunities. Unemployment negatively impacts family life, leading to broader consequences for the overall standard of living. Figure 5 illustrates the trend in the registered unemployment rate (in %) over the monitored period from 2007 to 2021.
Fig 5. Development of registered unemployment in % in 2007-2021
At the beginning of the period under review, the average registered unemployment rate in the Bucharest Nine was 7.04%. Figure 5 shows that, after the economic crisis in 2009, unemployment increased in all the Bucharest Nine countries in the following years. The highest unemployment rate was recorded in 2010 and throughout the entire period under review. Fortunately, due to the economic recovery, the unemployment rate decreased. The lowest measured unemployment rate in the Bucharest Nine was in the Czech Republic in 2019. The highest value of the registered unemployment rate was measured in Latvia in 2010. Using graph no. 7, we can conclude that the Czech Republic, with a value of (2.80%), in 2021 overtook the Western European leader, Germany, with a value of (3.60%), in terms of registered unemployment.
Average Wages
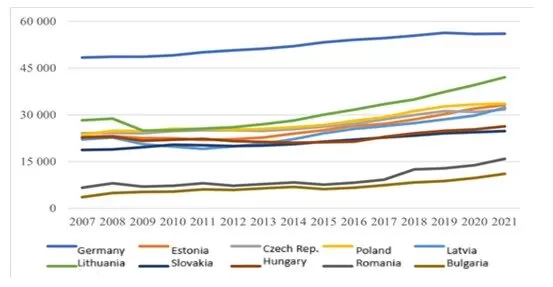
The average annual wage is typically defined as the total amount of income earned by a worker over the course of one year. It serves as an indicator of a country’s economic strength and is therefore a key factor in determining the population’s standard of living, as it represents their primary source of income. This indicator is measured in constant US dollars. Its development over the period from 2007 to 2021 is illustrated in Figure 8.
Fig 6. Development of average annual wage in USD in 2007-2021
Figure 6 shows information on the average annual wage per full-time employee and for the whole year in the total economy, converted to purchasing power parities in USD. Although the findings obviously vary across countries, countries with available data have recorded a positive shift in wages since the beginning of the period under review. Slovakia and the Czech Republic recorded growth in actual real wages that exceeded productivity growth. This phenomenon suggests that a catching-up process is underway, which has recently been caused by labor shortages. The leaders in average annual wages in the Bucharest Nine countries that we averaged are Latvia, Poland, the Czech Republic, Estonia and Lithuania. On the other hand, the lowest average annual wages were recorded in Bulgaria, Romania, Hungary and Slovakia. The average annual wage in Germany is among the highest in the world; as can be seen in Figure 6, none of the B9 countries comes close to Germany in terms of values.
Cost of Living Index
The cost-of-living index, also known as the consumer price index, is an indicator that measures the change in the cost of common consumer goods and services. The cost-of-living index is very important to the economy because it helps measure inflation, which is an important indicator of economic stability. If the price of goods and services increases too quickly, it can have a negative impact on the economy and consumers. In addition, the cost-of-living index is also used to adjust wages and benefits. If the index increases, increases in wages and benefits may be necessary to ensure that consumers are able to cover the costs of their daily expenses.
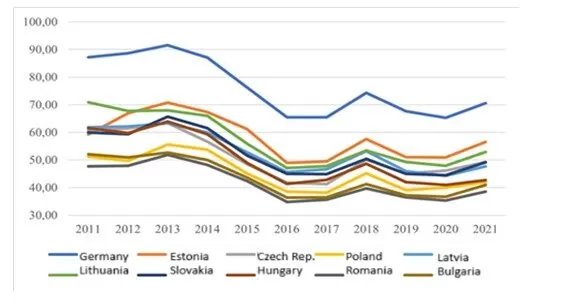
Fig 7. Development of Cost of Living in 2011-2021
Figure 7 shows the development of the cost-of-living index for the period 2011 to 2021 due to the absence of data in Numbeo statistics. From graph no. 10 we can conclude that the cost-of-living index has been decreasing over the years. The leaders of the B9 with the highest measured value are Estonia, which ranks 98th, together with Latvia, which ranked 89th in the CPI ranking in 2021. This is followed by the Czech Republic, which ranked 73rd, and Slovakia, with 72nd place in the CPI ranking in 2021. This is followed by Lithuania, which ranked 69th, Hungary with 65th place, and Poland with 61st place in the aforementioned ranking. On the contrary, during the monitored period, the lowest values in the cost-of-living index were shown by Bulgaria, which ranked 55th with its values, and Romania, with 46th place in the CPI ranking in 2021. Figure 7 also shows us the different values between the Bucharest Nine group and the western state of Germany, where the country ranked 110th in the 2021 CPI ranking. In general, the cost of living in Germany is relatively high compared to other countries.
Result of statistic methods application
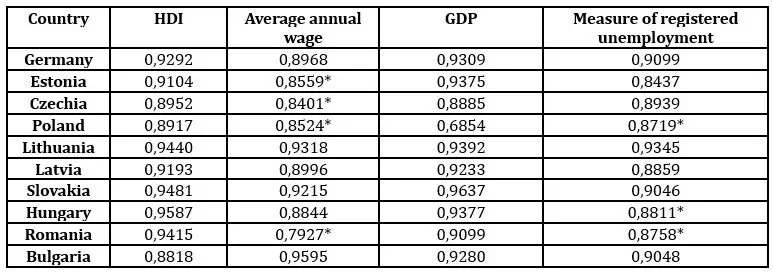
The results in the individual countries of the Bucharest Nine and, for comparison, Germany, are shown in the following Table 3, from which it is possible to deduce a normal distribution in most of the evaluated cases (82.5%). It is possible to reject the assumption of a normal distribution based on the results of the Shapiro-Wilk test only four times in the case of the average annual wage in the countries (Estonia, the Czech Republic, Poland and Romania) and 3 times in the case of the registered unemployment rate in the countries (Poland, Hungary, Romania). Table No. 3 shows the results of the Shapiro-Wilk test for individual countries.
Table 3: Results of normal distribution testing for analyzed indicators in 2007 – 2021
Note: *α < 0,05
Based on the results from Table No. 3, it is not possible to use the Pearson correlation coefficient, i.e. for the purposes of verifying the established hypotheses, its non-parametric alternative in the form of the Kendall rank correlation coefficient is used.
Evaluation of research hypothesis in Bucharest 9
H1 evaluation
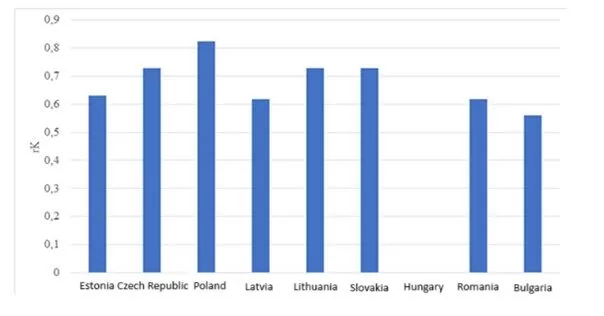
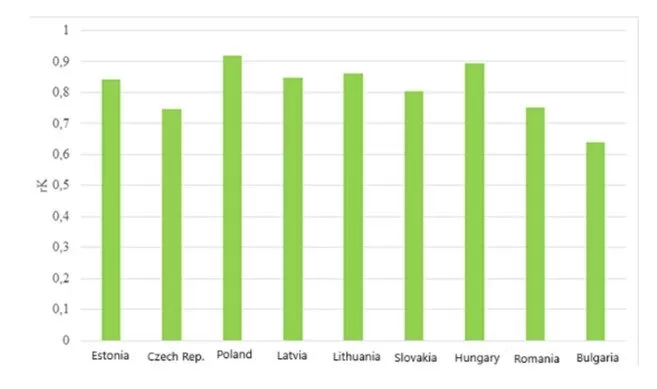
The linear ordinal relationship between the human development index and the average annual wage in the individual countries of the Bucharest Nine is presented in Chart No. 10, where Hungary is the only country in which this relationship is not statistically significant at the 5% significance level (rK = 0.2212; p = 0.5862). In the other countries, this relationship is always positive, which means that with the growth of the average annual wage, the human capital index also grows and vice versa. The strength of this linear relationship can be described as medium to high.
Fig 8. Results of correlation analysis – H1
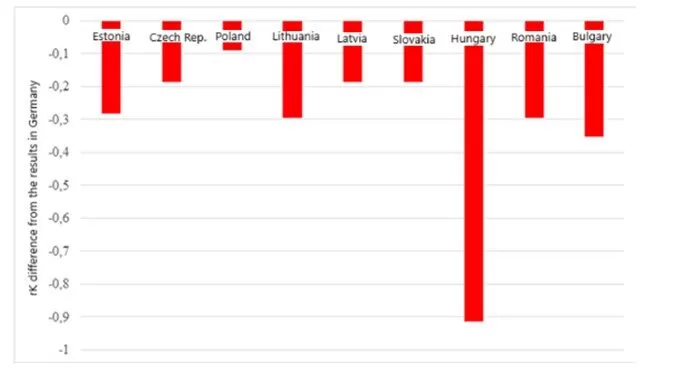
In no case, however, do the results of the Bucharest Nine countries reach the level of the Kendall coefficient in Germany (rK = 0.9135; p < 0.01). Poland is closest to this (rK = 0.823; p < 0.01), followed by three countries with the same results, i.e. the Czech Republic, Latvia and Slovakia (in all cases rK = 0.7273; p < 0.01). The largest differences were demonstrated when comparing with Bulgaria (rK = 0.5604; p < 0.01) and Romania (rK = 0.6190; p < 0.01). The difference in the results of individual countries with the result of Germany is also shown in more detail in the following Figure 9.
Fig 9. Differences in correlation analysis results in Germany and B9 – hypothesis 1
Based on the obtained results, we can conclude that, with the exception of Hungary, a statistically significant relationship between the human development index and the average wage has been demonstrated in all other Bucharest Nine countries, meaning that H1 can be confirmed. However, when compared to the strength of this ordinal relationship in Germany, we observe significantly lower values of the Kendall coefficient. Differences can also be observed within the Bucharest Nine countries, with Poland coming closest to the results of Germany.
H2 evaluation
The second research hypothesis (H2) focuses on the linear ordinal relationship between the human development index and gross domestic product per capita in the individual countries of the Bucharest Nine. In all 9 countries, this relationship has been shown to be statistically significant and positive. The growth of gross domestic product per capita is therefore accompanied by the growth of the human development index, in other words, with the growth of the index. It is possible to observe the growth of this macroeconomic indicator. The strength of this ordinal correlation can be described as high, or rather very high in the case of Poland (rK = 0.9187; p < 0.01), see figure 10.
Fig 10. Results of correlation analysis – H2
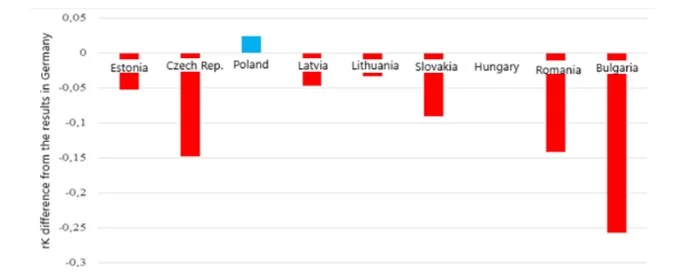
The structure of the results of the Bucharest Nine countries is not homogeneous in comparison with Germany (rK= 0.8943; p < 0.01), as was the case in the previous research hypothesis. 7 out of 9 countries show a lower strength of the ordinal correlation, while significant differences can be identified between these countries. Countries with a relatively smaller difference can include Lithuania (rK = 0.8476; p < 0.01) and Latvia (rK = 0.8613; p < 0.01). A more significant difference compared to the results of Germany is observed mainly in the case of Bulgaria (ΔrK = -0.3531) and partly also in the Czech Republic (ΔrK = -0.1479) and Romania (ΔrK = -0.1418). A graphic illustration of the aforementioned differences in the results of the correlation analysis is offered by Figure 11.
Fig 11. Differences in correlation analysis results in Germany and BD – H2
Based on the above results, we can state a proven statistically significant ordinal relationship between the human development index and gross domestic product per capita in all Bucharest Nine countries, i.e. H2 can be confirmed. When compared to the level of this relationship in Germany, we observe a similar level in Hungary and Poland, in the case of which the value of the Kendall coefficient is even higher.
H3 Evaluation
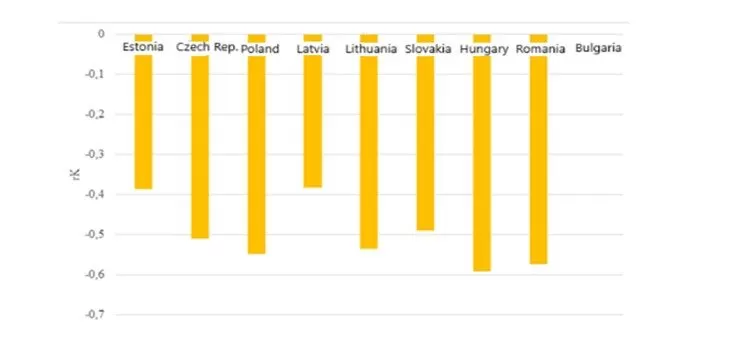
The subject of the last and thus third research hypothesis (H3) is the linear ordinal relationship between the human development index and the registered unemployment rate in the individual countries of the Bucharest Nine. The nature of this relationship can be characterized as negative in all 9 countries. The decrease in the registered unemployment rate, which is a desired phenomenon from our point of view, is accompanied by an increase in the human development index, in other words, with a decrease in the index, it is also possible to observe an increase in the level of this macroeconomic indicator. The strength of this ordinal correlation can be described as low (three countries) to medium (five countries), while in Bulgaria this relationship is not statistically significant.
Fig 12. Results of correlation analysis – H3
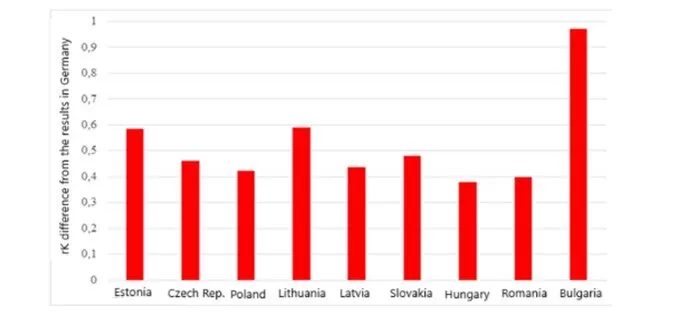
Compared to Germany (rK = -0.9712; p < 0.01), the structure of the results of the Bucharest Nine countries is homogeneous, which means that the observed ordinal correlation is weaker in all countries. The difference is always significant, as documented in the following Figure 13, but at the same time relatively balanced, as documented by the low value of the variation range of the results (R = 0.2094).
Fig 13. Differences of correlation analysis results in Germany and B9 – H3
Based on the described results, we can state a proven statistically significant ordinal relationship between the human development index and the registered unemployment rate in all Bucharest Nine countries, thus H3 can be confirmed. When compared with the level of this relationship in Germany, however, we observe a significantly lower level in all countries, while in Bulgaria the linear ordinal correlation between the observed pair of indicators is statistically insignificant (at the set significance level of 5%).
Results Comparison
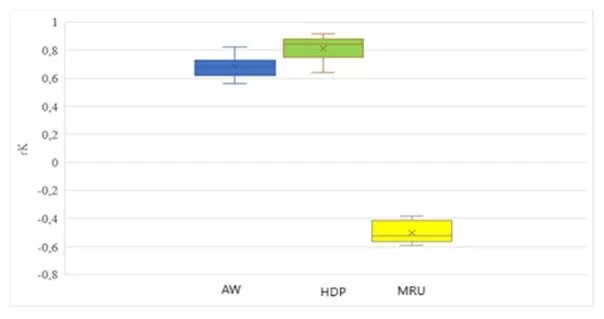
In the previous sections, the research hypotheses are individually evaluated, with each of the three defined hypotheses proving to be relevant. In this section, we will take a closer look at the results across these research hypotheses from the perspective of the Bucharest Nine countries. Using boxplot No. 16, the results of this group of countries can be labeled homogeneous, meaning that no outlier or extreme value was identified in any case. The relationship between the human development index and the selected macroeconomic indicators (average annual wage, gross domestic product per capita, registered unemployment rate) in the Bucharest Nine countries is therefore homogeneous or rather uniform.
Fig 14. Comparison of correlation analysis results in BD (HDI vs. AW, HDP, MRU)
Note: AW – average wage, MRU – measure of registered unemployment
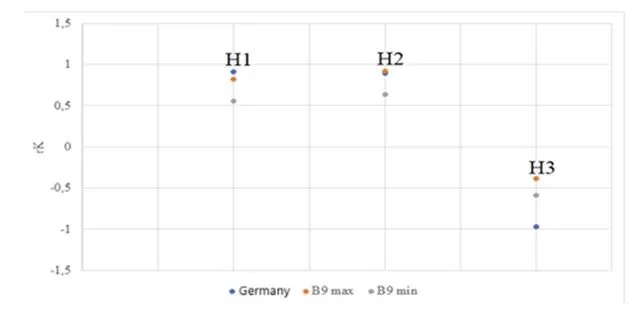
The level of linear ordinal correlation across individual pairs of indicators (research hypotheses) shows some differences. In the case of research hypotheses H1 and H3; Germany is the country with the strongest relationship among the evaluated countries (note: in the case of H3, this is a negative correlation, i.e. the strongest relationship is represented by the lowest value). In the case of H2, however, it is possible to find countries with the same or higher strength of this relationship (Hungary and Poland, respectively), which is also documented in Figure 15.
Fig 15. Comparison of Kendall coefficient for individual hypothesis (H1, H2, H3)
From the perspective of individual analyses, the Bucharest Nine countries are a homogeneous group. The results indicate a significant dominance of Germany in some aspects (research hypothesis no. 3), but it is also possible to find a point of view from which some countries are competitive with Germany (evaluation of research hypothesis no. 2).
Discussion
In the analytical section, it was evident that Romania consistently ranked at the lower end of the scale. Despite this, the country possesses notable strengths, including a large domestic market with significant potential for growth and development. Romania also benefits from substantial agricultural resources, particularly in the production of wheat, barley, and rapeseed. Additionally, the country demonstrates strong capabilities in generating electricity from renewable sources and maintains a degree of energy independence due to local reserves of coal, oil, and gas. Other advantages include growing export volumes and consistently strong agricultural yields. However, Romania faces several persistent challenges. One of the most pressing is demographic decline, driven by a low birth rate and the emigration of educated youth. This issue is closely linked to the healthcare index, which has shown variability over time and across regions (Goschin & Druica, 2019). Furthermore, the country struggles with low female participation in the workforce, alongside ongoing challenges in public administration and corruption. Notably, Romania has made significant progress in its Human Development Index (HDI), improving from a score of 0.767 (50th position) in 2011 (Buta & Kicsi, 2011) to 0.827 (26th position) in 2022 (Global Economy, 2022), reflecting positive socio-economic development over the past decade.
Living in Bulgaria brings several advantages, such as low costs compared to other EU countries, safety and the beauty of the country, which offers many historical monuments and a high potential for tourism development. However, there are also some disadvantages, such as insufficient infrastructure, as confirmed by Kocziszky and Szendi (2023), overcrowding of popular tourist areas in the summer months, communication problems, lack of skilled labor and a declining population with relatively low incomes. Bulgaria has the capacity to carry out R&D in terms of human potential, but does not have sufficient own financial resources to invest in it (Ivanova, 2020).
Living in the Czech Republic brings many advantages. The most important of which are low crime rate, low unemployment rate and quality healthcare. In addition, the country is ideally located and has a rich culture and preserved nature. However, there are also disadvantages, such as neglected infrastructure, bureaucracy and lack of fast transport connections with other EU countries. In the Czech Republic, there are disparities in living conditions among the city districts. The influence of historical city development on the quality of life was revealed as well (Flokova et al., 2023).
Estonia offers several advantages for living, such as a very clean environment and excellent air quality, which has also been recognized by the World Health Organization. In addition, there is a system of solidarity health insurance, which ensures the same quality of care for all insured persons, regardless of their age, income or health risks. Other positives are the low number of homeless people and free transport for residents. On the other hand, the disadvantages of Estonia are uneven infrastructure, a declining workforce and a shortage of qualified workers. Estonia, together with Lithuania has great potential for successful transition to a knowledge-based economy. Education as a HD’s element has a high influence on rural development (Starineca and Voronchuk, 2015).
Lithuania is characterized by a low cost of living compared to the other B9 countries (Gumeniuk, 2017), preserved nature and a lot of greenery. However, the gap between the countries will increase. The country has free education and relatively easy visa obtaining. On the other hand, the disadvantages are income inequality and slow progress in educational reforms. Lithuania also noted weak control of companies responsible for waste management. The sustainable development of the knowledge-based economy in Lithuania since 2010 is growing up. The same was confirmed by Cizauskaite-Butkaliuk (2014).
Latvia faces several challenges, including a low birth rate, emigration and high structural unemployment. It also has to deal with high labor taxes that affect people with low incomes, income inequality, and other factors. On the other hand, Latvia has strengths, including good international relations, a competitive business environment, high-quality education and relatively low real-estate prices. The situation is caused by SMEs’ weaknesses in Latvia, which do not use effectively online selling, social media, cloud computing and big data possibilities (Jekabsone and Gudele, 2020).
Hungary’s strengths include excellent transport and logistics, a favorable ecological and environmental status, a high waste recycling rate, and an overall unemployment rate. On the other hand, the country’s weaknesses include regional disparities, insufficient vocational education, and a low level of innovation. The results of Majerová (2018) show that the values of the regional development improved in nearly all regions (with the exception of Kozep-Magyarorszag in Hungary), however regional development was not negatively influenced by the economic crisis.
Slovakia lags behind developed countries in access to clean energy. The country should pay more attention to climate change. Weaknesses include high levels of vandalism and education, where children from marginalized communities also suffer from poor grades. On the other hand, the country’s strengths include good natural potential, a preserved environment, rich folklore traditions, and cultural and historical monuments. Oláh et al. (2020) found that there are significant differences between Slovakian regions, in terms of economic, social and environmental factors (confirmed also by Holubek et al., 2018).
Poland is among the top ten performing economies in the EU with a high level of the market and available skilled workforce. In addition, Poland is a culturally and historically rich country that offers various travel options. Churski et al. (2021) confirm that contemporary spatial diversification at the level of socio-economic development in Poland is still strongly conditioned by history. Szydlo (2019) confirmed the successful economic transformation in Poland as well. However, the global financial crisis changed the situation, when Poland has several weaknesses, such as an almost complete ban on abortion, low female employment, poor research and development, and low investment levels.
Conclusion
The primary objective of this study was to evaluate the quality of life in the selected countries using the Human Development Index (HDI). The analysis focused on the Bucharest Nine (B9) countries, located on the NATO’s eastern flank, to examine their development and assess the quality of life through the HDI, which incorporates sub-indices reflecting various dimensions of human well-being. To provide a comprehensive assessment, this study emphasized the economic dimension, utilizing key economic indicators such as the average annual wage, gross domestic product (GDP), and the registered unemployment rate. The evaluation was conducted exclusively on the B9 countries, offering insights into their socio-economic conditions and development trends. The findings of this study highlight several key areas for potential improvement, including economic growth, infrastructure development, education quality, and overall quality of life. For comparative purposes, Germany—recognized as a leader in Western Europe—was selected as a benchmark. Future research could expand this analysis by incorporating a broader international context and comparisons with additional regions (Holubec & Tomka, 2023). It is important to note that forecasting the development of quality of life remains challenging due to unforeseen events that can significantly impact socio-economic conditions, as demonstrated by the global COVID-19 pandemic in 2020. To address these uncertainties, future studies could utilize the State of the Future Index (Kladivo, 2014), which, unlike the Human Development Index, focuses not only on current conditions but also on potential future opportunities and risks.
Acknowledgment
This article is one of the outputs of the research project 024PU-4/2023 – KEGA “Preparation of an innovative study program Green economy in the study field of economics and management” and the research project KEGA 010PU-4/2023 “Innovation of the Course Entrepreneurship in Small and Medium-Sized Enterprises in the Context of Sustainability and Circularity”.
Arora, RU. and Ratnasiri, S. (2015) ‘Economic reforms, growth and well-being: evidence from India, ‘ Journal of Economic Policy Reform, 18(1), 16-33. doi: 10.1080/17487870.2014.920706.
Bačová, E. (2008) ‘Kvalita života a sociálny kapitál – psychologické dimenzie,‘ Prešov: Folozofická fakulta Prešovskej univerzity v Prešove.
Banasik, M. (2021) ‘Bucharest nine in the process of strategic deterrence on NATO’S eastern flank,‘ The Copernicus Journal of Political Studies, [online]. [cit. 2024-02-03]. Available from: https://apcz.umk.pl/CJPS/article/view/36524/30782
Barber, RM., Fullman, N., Sorensen, RJD, Bolllyky, T. and McKee, M. (2017) ‘Healthcare Access and Quality Index based on mortality from causes amenable to personal health care in 195 countries and territories, 1990-2015: a novel analysis from the Global Burden of Disease Study 2015,‘ The Lancet, London, 390(10091), (Jul 15, 2017): 231-266. doi:10.1016/S0140-6736(17)30818-8
Cizauskaite-Butkaliuk, A. (2014) ‘The Sustainable Development of The Knowledge Based Economy in Lithuania,‘ Management Theory and Studies For Rural Business and Infrastructure Development, 36(4), 775-783. doi: 10.15544/mts.2014.072.
Dumuid, D., Maher, C., Lewis, LK., Standford, TE., Fernández, JAM., Ratcliffe, J., Katzmarzyk, PT., Barreira, TV., Chaput, JP. and Fogelholm, M. (2018) ‘Human development index, children’s health-related quality of life and movement behaviors: a compositional data analysis,‘ Quality of Life Research, 27(6), 1473-1482. doi: 10.1007/s11136-018-1791-x
Flokova, L., Huebelova, D., Kozumplikova, A., Caha, J. and Janosikova, L. (2023) ‘Multi-perspective quality of life index for urban development analysis, example of the city of Brno,‘ Czech Republic, 137. doi: 10.1016/j.cities.2023.104338. art No 104338
Fumagalli, R. (2021) ‘Theories of well-being and well-being policy: a view from methodology,‘ Jourmal of Economic Methodology, 28(1), 124-133. doi: 10.1080/1350178X.2020.1868780
Gumeniuk, IS. (2017) ‘Human Development Index As a Toll To Assess Social Development in the Baltic States,‘ Baltic Region, 9(3), 45-57. doi: 10.5922/2079-8555-2017-3-4.
Haakenstad, A., Yearwood, JA., Fullman, N., Bintz, C., Bienhoff, K., Weaver, MR, Nandakumar, V., Joffe, JN., LeGrand, KE., Knight, M., Abbafati, C., Abbasi-Kangevari, M., Abdoli, A., Abeldaño Z., Roberto A. and Sun, J. (2022) ‘Assessing performance of the Healthcare Access and Quality Index, overall and by select age groups, for 204 countries and territories, 1990–2019: a systematic analysis from the Global Burden of Disease Study 2019,‘ The Lancet Global Health, doi: 10.1016/s2214-109x(22)00429-6
Hamráčková, M. (2013) ‘Sociálna práca s nezamestnanými a kvalita života nezamestnaných,‘ Nitra: Fakulta sociálnych vied a zdravotníctva UKF v Nitre.
Hanová, M., Prokeinová, RB., Hallová, M. and Cierna, Z. (2015) ‘Economic Position of the Slovak Inhabitants in Europe,‘ Proceedings ICABR 2015: X. International Conference on Applied Business Research, 273-282. 10th International Conference on Applied Business Research (ICABR), Madrid, Spain, September 14-18, 2015
Holubec, S. and Tomka, B. (2023) ‘Human Development Index: Changes in East Central Europe, 1913-2010*,‘ Politicka Ekonomie, 71(2), 130-152. doi: 10.18267/j.polek.1378.
Churski, P., Herodowicz, T., Konecka-Szydlowska, B. and Perdal, R. (2021) ‘Spatial Differentiation of the Socio-Economic Development of Poland-“Invisible” Historical Heritage,‘ Land, 10(11). doi: 10.3390/land10111247.
Ikeda, S. and Managi, S. (2019) ‘Future inclusive wealth and human well-being in regional Japan: projections of sustainability indices based on shared socioeconomic pathways,‘ Sustainability Science, 14(1), 147-158. doi: 10.1007/s11625-018-0589-7.
Ivanova, R. (2020) ‘Horizon Europe 2021 – 2027 Strategy – A New Opportunity for Research Activity in Bulgaria,‘ Strategies for Policy in Science and Education-Strategii na Obrazovatelnata i Nauchnata Politika, 28(6), 606-613.
Jekabsone, I. and Gudele, I. (2020) ‘Actors Contributing to the Regional Development of E-commerce in Latvia,‘ Economic Science for Rural Development, 53, 177-185. doi: 10.22616/ESRD.2020.53.020.
Jordá, V. and Sarabia, JM. (2015) ‘International Convergence in Well-Being Indicators,‘ Social Indicators Research, 120(1), 1-27. doi: 10.1007/s11205-014-0588-8.
Kocziszky, G. and Szendi, D. (2023) ‘Comparative analysis of development paths in Central and Eastern European countries (V4+2) using a composite index, 1995-2020,‘ Regional Statistics, 13(6), 1026-1058. doi: 10.15196/RS130602
Kladivo, P., Novácek, P., Machácek, J. and Teichmann, J. (2014) ‘The State of The Future of The Future Index for the Czech Republic,‘ Moravian Geographical Reports, 22(3), 42-52. doi: 10.2478/mgr-2014-0017
Lisovskaia, A. (2022) ‘Implementing Well-Being Practices through Russian Context: HRD Perspective,‘ Journal of East-West Business, 28(3), 254-269. doi: 10.1080/10669868.2022.2047131.
Majerová, I. (2018). ‘Regional Development and Its Measurement in Visegrad Group Countries,‘ Deturope-The Central European Journal of Regional Development and Tourism, 10(2), 17-37.
Masárová, T. and Živčicová, E. (2012) ‘Meranie kvality života,‘ Žilina: Georg.
Nagel, R. (2004) ‘Human development index- An elaborate means of evaluating a country´s HD,‘ [online]. Norderstedt Nemecko. [cit. 2024-12-04]. Available from: https://books.google.sk/books
Oláh, J., Hajduová, Z., Lacko, R. and Andrejovsky, P. (2020) ‘Quality of Life Regional Differences: Case of Self-Governing Regions of Slovakia,‘ Sustainability, 12(7), doi: 10.3390/su12072924. Article Number 2924.
Permai, SD., Tanty, H. and Rahavu, A. (2016) ‘Geographically Weighted Regression Analysis for Human Development Index,‘ International Conference on Mathematic, Engineering and Industrial Applications 2016 (ICOMEIA2016), 1775. doi: 10.1063/1.4965165. 2nd International Conference on Mathematics, Engineering and Industrial Applications (ICoMEIA). Songkhla, Thailand, August 10-12, 2016
Pikety, T. (2015) ‘Kapitál v 21. storočí,‘ Bratislava: Ikar. 749 s.
Rojas, M. (2020) ‘New Development Strategy: Development as Well-Being,‘ Well-being in Latin America: Drivers and Policies, 165-177. doi: 10.1007/978-3-030-33498-7_12.
Smits, J. and Permanyer, I. (2019) ‘The Subnational Human Development Database,‘ Scientific Data, doi: 10.1038/sdata.2019.38.
Shrotryia, VK. (2020) ‘Human Well-Being Indicators in South Asia Region,‘ Human Well-being and Policy in South Asia, 19-61. doi: 10.1007/978-3-030-33270-9_2.
Starineca, O. and Voronchuk, I. (2015) ‘Human Development Under Knowledge Economy Circumstances: Case of the Baltic States´Rural Areas,‘ Economic Science for Rural Development: 1. Marketing and Sustainable Consumption 2. New Dimensions in the Development of Society, 40, 186-195. International Scientific Conference on Economic Science for Rural Development, Jelgava, Latvia, Arpil, 2015.
Szydlo, W. (2019) ‘Economic Transformation of Poland – Analysis of the Success Story Perspective,‘ Vision 2025: Education Excellence and Management of Innovations Through Sustainable Economic Competetive Advantage, 7531-7542. 34th International-Business-Information-Management-Association (IBIMA) Conference, Madrid, Spain, November 13-14.
Tokárová, A. (ed). (2002) ‘Kvalita života a ľudské práva v kontextoch globalizácie a výkonovej spoločnosti,‘ Slovensko-poľský zborník štúdií a článkov. Acta Facultatis Presoviensis. Prešov : FF PU. s. 605.
United Nations Development Programme. (2020). ‘Human development index HDI,‘ [online]. [cit. 2024-12-15]. Available from: hdr.undp.org/en/content/human-development-index-hdi
Ura, K. et al. (2012) ‘An Extensive Analysis of GNH Index,‘ Centre for Bhutan Studies [online]. [cit. 2024-12-14]. Available from: http://www.grossnationalhappiness.com/wp-content/uploads/2012/10/An%20Extensive%20Analysis%20of%20GNH%20Index.pdf
Veenhoven, R. (2000) ‘The four qualities of life: Ordering concepts and measures of the good life,‘ Journal of Happiness Studies, 1(1), 1-39.
Villamagna, A. and Giesecke, C. (2014) ‘Adapting Human Well-being Frameworks for Ecosystem Service Assessments across Diverse Landscapes,‘ Ecology and Society, 19(1), doi: 10.5751/ES-06173-190111. Art No 11
Yang, L. (2018) ‘Measuring Well-being: A Multidimensional Index Integrating Subjective Well-being and Preferences,‘ Journal of Human Development and Capabilities, 19(4), 456-476. doi: 10.1080/19452829.2018.1474859