School of Computing, Electrical and Applied Technology, Unitec Institute of Technology, Auckland, New Zealand
Volume 2020,
Article ID 678700,
Journal of e-Government Studies and Best Practices,
8 pages,
DOI: 10.5171/2020.678700
Received date: 23 March 2018; Accepted date: 13 April 2020; Published date: 17 August 2020
Academic Editor: Nermin Khalifa
Cite this Article as:
Eltahir F Kabbar (2020)," Measuring e-Government Development: The Haves and the Have-nots", Journal of e-Government Studies and Best Practices, Vol. 2020 (2020), Article ID 678700, DOI:10.5171/2020.678700
Since 2003, the United Nations Department of Economic and Social Affairs (UNDESA) continued to measure the e-government development across the world using a range of indices. The UNDESA produces a biannual report that ranks UN member states according to their most recent e-government development indices. These reports are widely used by e-government officials to benchmark their country’s performance. The aim of this paper is to investigate whether there has been a significant change in the rankings of the 191 countries that participated in both the 2005 and 2016 surveys using quantitative research methods. To meet the research objectives, the study uses correlation analysis and cluster analysis technique. The correlation analysis is used to assess the degree of association between the 2005 and 2016 rankings, while the cluster analysis technique was used to segment countries into groups based on their 2005 and 2016 rankings in order to detect any significant shift in the cluster membership in each country. The results obtained reveal a strong positive correlation between the 2005 and 2016 e-government development indices, indicating a little variation occurred in the overall ranking of the countries during this period. Also, the cluster analysis results revealed that there are three distinct groups of countries/segments: Leaders, Laggards and Average performing countries. The results also disclosed that there was a little change in countries’ cluster-membership between 2005 and 2016 indicating that countries that were ranked high in 2005 survey are still leading in 2016, and the countries that were struggling in 2005 are still struggling today.
Keywords: E-Government, EGDI, United Nations, Online Government Services
Introduction
In the recent years, many countries around the world started to rely more and more on Internet technologies to deliver public services to citizens. A wide range of online services are delivered using Internet technologies that extend from the provision of the most basic informational websites to deploying sophisticated tools for managing interactions among government agencies, as well as between government agencies, citizens and businesses. The introduction of e-government services in the mid 1990′s promised a range of benefits such as enabling efficient, low cost and transparent services to citizens through integrating and sharing knowledge and resources (Janowski, 2015; Sivarajah, Irani, & Weerakkody, 2015). However, the ultimate promised goal of the e-government was, and still is, to radically transform government relations with citizens, businesses and other arms of the government (World Bank, 2006). Therefore, it is of significant importance to measure how governments around the world are progressing towards achieving this goal. One of the key reports that monitor the state of e-government development progress is produced by the United Nations, which is based on a metric known as the UN E-Government Development Index (EGDI) (UN 2016).
The next section of this paper provides a brief description of this metric.
The United Nations e-government development index
In 2003, the United Nations started publishing a regular report on the e-government development status of different countries around the world. The EGDI is calculated from data collected in the UN E-Government Survey. The most recent version of this EGDI was published in 2016 and is described in the UN documentation as “measuring the willingness and capacity of national administrations to use information and communication technology to deliver public services”. The overall metric is based on three individual components. First, the Online Service Index (OSI), which measures the maturity of a country’s e-government websites, such as their national website and related portals, and related websites from ministries such as education, labour, social services, health, finance and environment. Second, the Telecommunication Infrastructure Index (TCI), which derives a score for a country’s telecommunications infrastructure based on five indicators: the proportion of Internet users, fixed telephone lines, mobile subscribers, fixed Internet subscriptions and fixed broadband facilities. Finally, the Human Capital Index (HCI), which is calculated based on measures of a country’s adult literacy and education enrolments. Thus, the EGDI has been developed to measure not only the maturity of e-government services in the UN countries, but also the capacity of those countries to deliver online services both in terms of the telecommunications infrastructure and the skills of the potential e-government services participants. In addition, the UN developed an additional index named e-participation index (EPI), which is derived as a supplementary index to the UN E-Government Survey. EPI extends the dimension of the survey by focusing on the use of online services to facilitate the provision of information by governments to citizens focusing on three elements: (1) E-information: Enabling participation by providing citizens with public information and access to information without or upon demand, (2) E-consultation: Engaging citizens in contributions to and deliberation on public policies and services, and (3) E-decision-making: Empowering citizens through co-designing some policy options and co-producing service components and delivery modalities.
The EGDI and its three components are increasingly used by different scholars and government officials in different parts of the key e-government development indicators. The indices scores and ranking positions are used to benchmark/compare and, even in some cases, set ranking improvement targets. For example, the Ministry of Telecom and Mass Communication of the Russian Federation used the UN EGDI to benchmark the Russia’s e-government development against other countries in the region and beyond (Ministry of Communications of Russia, 2017). In addition, Sukhankin (2017) referred to the country’s EGDI ranking position between 2008 and 2015 to argue that Russia has failed to fulfil the goal set in its strategy of becoming one of the world’s top 20 countries during that period. Further, in Greece, the EGDI score and ranking position of the country was used to show how Greece “lags” behind its neighboring EU counterparts (Zafiropoulos, et al., 2012). Further, a number of Middle Eastern countries often quote their ranking positions to demonstrate how they have improved from previous lower ranking positions or aim at set ranking positions to achieve as key objectives in their digital e-government strategies. For instance, according to the KSA National Transformation Plan (2016), Saudi Arabia government aims at raising the country’s EGDI ranking from the current position (36) to be among the top five nations by 2030. In the African context, Ducass (2017) used the EGDI scores of the 53 African countries to compare and contrast their e-government development. The author concludes that the Southern and Northern African regions outperformed the Eastern, Western and Middle regions.
Despite the popularity of the EGDI and its ranking systems, which cannot be underestimated, a number of scholars voiced their critics about the approach used to measure the e-government development using EGDI. For example, Whitmore (2012) argues that there is a need to modify the way the EGDI is calculated and suggested the use of factor analysis to ensure that the index fully measures what it is supposed to measure. Also, Kabbar and Dell (2013) suggested a revised EGDI called E-Government Development by GDP (EGDGDP) that incorporates the Gross Domestic Product (GDP). They argue that the adjusted EGDGDP provides a better assessment of the countries’ e-government development as it measures a country’s performance relative to what would be expected of that country by GDP rather than the absolute measure currently given to each country.
A number of researchers investigate the digital divide gap among different regions and groups of counties using the limited available Internet penetration, number of uses and broadband coverage statistics (Chen and Wallden, 2004; Mauro, 2005; Menzie, et al., 2007). Another group of researchers used socio-economic indicators such as ICT expenditure to measure the digital divide gap between the haves and have-nots (Norris, 2001; Chinn and Fairlie, 2006; United Nations, 2012; Cruz-Jesus, et al., 2012). While these studies provided useful information about the global digital divide among specific regions/countries; there is a need for more e-government focused digital divide studies using a coherent set of statistical measures such as the one provided by the EGDI.
Both the wide use and popularity of the EGDI and its voiced critics, as well as the limited number of studies focusing on the digital divide among worldwide counties using global statistical measures provided the motivation for undertaking this study. The next section of this paper describes the aim of the research and the research methods used in this investigation.
Research Design
Aim
The aim of this study is to investigate whether there have been significant changes in the EGDI, and subsequent e-government development rankings of the 191 countries participated in the United Nations surveys during the past decade. In addition, the study investigates the gap between the haves and have-nots among the counties participated in the UN survey.
Research Methods
To meet the research objectives, first, Pearson Product-Moment correlation analysis was conducted using the 2005 and 2016 survey dataset (UN, 2005; UN 2016), including all e-government development indices (EGDI, OSI, HCI, TCI and e-Participation index). The correlation analysis was performed using SPSS version 24 to detect and measure the association between the 2005 and the 2016 indices scores for each country.
Second, to better understand the correlation analysis results obtained, the study employed the Cluster Analysis technique which enabled the researcher to identify the hidden structures and natural groupings (segments) that may exist in the dataset. Cluster Analysis is an explorative analysis that seeks to identify structures (segments) within homogenous groups of cases hidden in the dataset, Punj and Stewart (1983). Further, Cluster Analysis is used to identify groups of cases that would otherwise not be apparent (IBM, 2017).
The results of both the correlation and cluster analysis are described in the next section.
Analysis, Results and Discussion
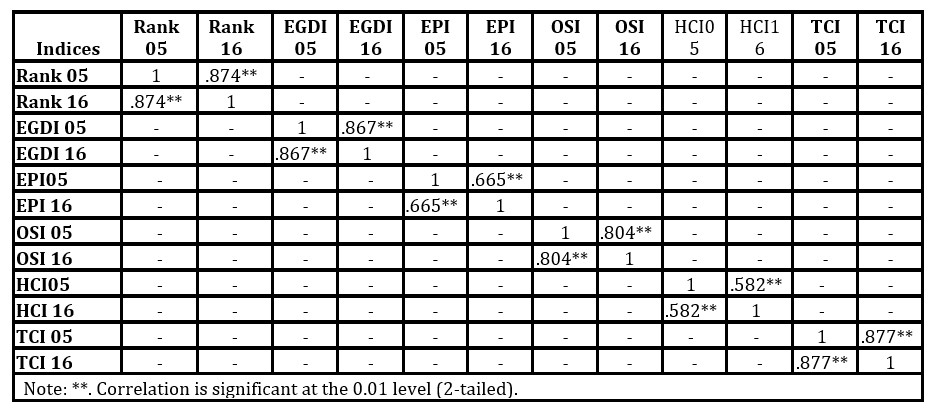
Using the 2005 and 2016 UN survey dataset, the Pearson Product-Moment correlation analysis results showed a strong positive correlation between each comparable pair of e-government indices as shown in Table 1. In the case of the country Rank, EGDI, TCI and OSI, the R2 was quite high (0.7639, 0.7517, 0.7691 and 0.6464 respectively). On the other hand, a weak R2 for EPI and HCI was detected (0.4422 and 0.3387), indicating a weak correlation between the two indices.
It is noticeable that the indices related to the provision of online services (TCI and OSI, as well as the Rank and the EGDI that are derived from these two indices) were higher than the indices focused on measuring the usage of these services and their users (EPI and HCI). This result suggests that the EGDI and the subsequent ranking are more driven by the provision of e-government services rather than the actual usage, as the more variation observed in EPI and HCI seems to have a little impact on the EGDI and the country ranking over the past decade.
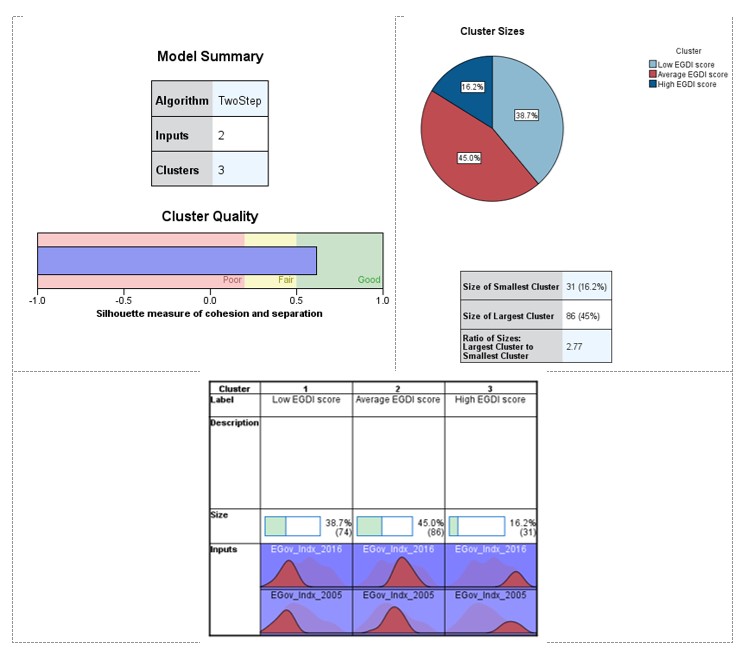
In addition, as mentioned in Section 3 above, to better understand the correlation analysis results, a two-step method of cluster analysis was performed, using SPSS 24.0 to segment the 2005 and 2016 UN survey data. The cluster analysis was performed using the entire dataset of the 191 countries surveyed. The clusters were built using the EGDI index score for each country as the input variables, and all of the EGDI sub-components (OSI, TCI and HCI) and the EPI were used as the evaluation fields. The model summary presented in Figure 1 shows that the solution obtained by SPSS is adequate as indicated by the silhouette measure of cohesion and separation measure. In addition, the cluster size results provide an indication of the quality of the solution, where the ratio of sizes of the largest cluster to the smallest cluster is (2.77), and no single factor is predominant.
Table 1: Correlation between 2005 and 2016 e-government development indicators (N=191)
Also, the cluster analysis results reveal that the dataset is naturally grouped into three distinct segments. The biggest cluster represents 45.03% (N86) of the participants followed by 38.74% (N74) and 16.23% (N31).
Figure 1: Model Summary and Cluster Sizes.
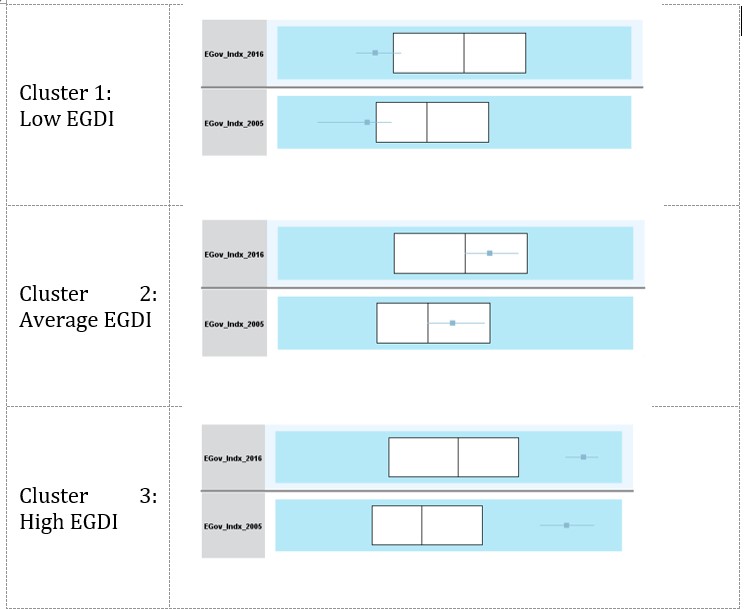
On one side of the spectrum lies the “Leaders” and on the other side lies the “Laggards”, with the “Average performing” countries in between. The Leaders group is represented by Cluster 3; it is not surprising that countries belonging to this group recorded higher EGDI compared to countries in the remaining two clusters, both in the 2005 and 2016 surveys. In contrast, the Laggards group represented by cluster 1, showed a lower EGDI score compared to countries in other clusters in 2005 and 2016; it was clear that the members of this cluster lag behind other countries in all the indices. The third group of countries, represented by cluster 2, holds neither a very high nor a very low score in all the indices. The cluster comparison results shown in figure 2 clearly show not only a strong correlation between EGDI score in 2005 and 2016 but also suggests that the gap between these groups is growing creating an e-government development digital divide (see Figure 2). It seems that the haves who did well in 2005 continue to do well now while the have-nots who were struggling back in 2005 (despite the improvement they made in e-government development during the past ten years as shown by their improved EGDI score), they still belong to the same group.
Figure 2: Cluster Comparison.
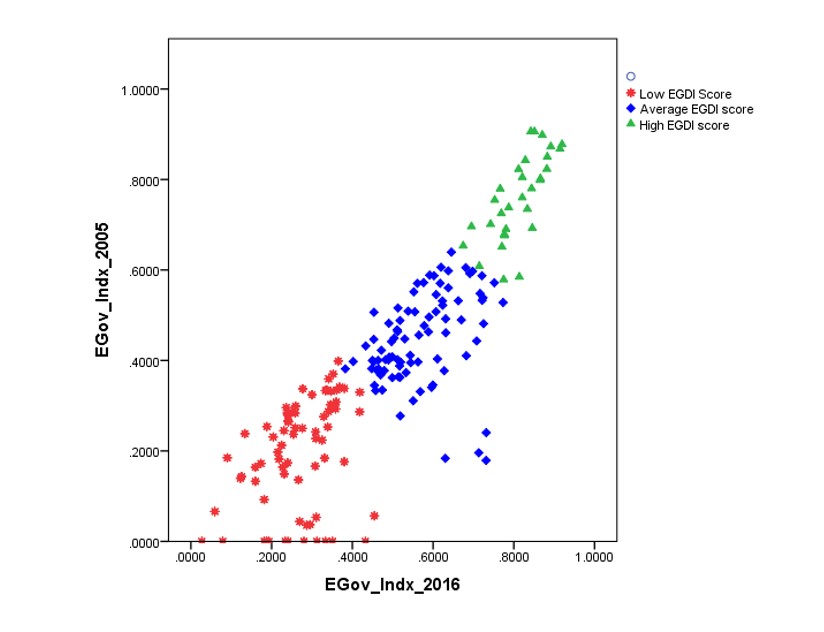
Finally, the graphical representation of the three clusters shown in Figure 3 shows a linear progression, confirming that those who did well in 2005 are still doing well in 2016 and the opposite is true for the struggling countries. A closer look at the movement of countries between clusters revealed that the vast majority of the countries (N144) out of the 191 countries, representing (75.39%), did not make any change of their clusters during the past ten years (i.e. each country remained in the same cluster). Out of the 47 countries representing (24.61%) that changed their clusters, only 3 countries (Liechtenstein, Monaco and Serbia) have improved their classification from “Laggards” to “Leaders”, representing (1.57 %). The majority of the other 44 countries either improved their position to the next cluster (N32) or went back one cluster (N12) to the next cluster, representing (16.75%) and (6.28%) respectively.
It is clear from the results presented in this section that the overall e-government development order and ranks of countries as measured by the popular EGDI have not seen huge disruptions between 2005 and 2016. In fact, the segmentation results mirror the worldwide country classification proposed by WESP (2014), where all the countries of the world are classified into one of three broad categories: developed economies, economies in transition and developing economies. It seems that because of the way e-government development is measured, countries are predestined to fall into its respective economic classification.
Figure 3: Countries Clusters according to their 2005 and 2016 EGDI.
Conclusion
The movement towards e-government resulted in the development of many electronic government (e-government) initiatives that aim to enhance the delivery of government services to citizens and improve interactions with business and industry. In 2003, the United Nations Department of Economic and Social Affairs (UNDESA) started to measure the e-government development across the world using a range of indices and presented the rank of each country in a biannual report. Many government officials use the UN ranking system to set e-government development objectives and targets. The segmentation analysis conducted in this study revealed that the majority of the countries participated in the UN survey retained the same cluster that they were in back in 2005, indicating that there has not been a significant change in countries’ positions over the past decade. The majority of the countries that were ranked high in 2005 survey are still leading in 2016, and the countries that were struggling in 2005 are still struggling today, therefore, the EGDI score given to countries need to be used carefully by both government officials and e-government promoters.
Be´langer, F. and Carter, L. (2009). The impact of the digital divide on e-government use, Communications of the ACM, Vol. 52 No. 4, pp. 132-135.
Chinn, M.D. and Fairlie, R.W. (2006).ICT use in the developing world: an analysis of differences in computer and internet penetration, IZA Discussion Paper No. 2206, IZA, Bonn.
Ducass, A. (2017). ‘E-Gov Development in Africa.’ The Electronic Journal of e-Government15 (2) pp. 59-62.
Janowski, T. (2015). ‘Digital government evolution: From transformation to contextualization,’ Government Information Quarterly, 32(3), 221-236.
Kabbar, E.F & Dell, P. (2103). Weaknesses of the E-Government Development Index. In Uesugi, S. (Ed.),IT Enabled Services. Springer, ISBN: 978-3-7091-1424-7, pp. 111-124.
KSA National Transformation Plan. (2016). National Transformation Plan, [Online], [Retrieved December 07, 2017], http://vision2030.gov.sa/en/goals
Mauro F. Guillén, Sandra L. Suárez (2005). Explaining the Global Digital Divide: Economic, Political and Sociological Drivers of Cross-National Internet Use, Social Forces, Volume 84, Issue 2,Pages 681–708, https://doi.org/10.1353/sof.2006.0015
Menzie D. Chinn, Robert W. Fairlie (2007). The determinants of the global digital divide: a cross-country analysis of computer and internet penetration, Oxford Economic Papers, Volume 59, Issue 1, Pages 16–44, https://doi.org/10.1093/oep/gpl024
Norris, P. (2001).Digital Divide: Civic Engagement, Information Poverty and the Internet Worldwide, Cambridge University Press, New York, NY.
Punj, G., & Stewart, D. W. (1983). ‘Cluster Analysis in Marketing Research: Review and Suggestions for Application,’ Journal of Marketing Research, 20(2).
Sivarajah, U., Irani, Z., &Weerakkody, V. (2015). ‘Evaluating the use and impact of Web 2.0 technologies in local government,’ Government Information Quarterly, 32(4), pp. 473-487.
UN (2005). United Nations Global E-government Readiness Report 2005: From E-government to E-inclusion. New York.
UN (2016). United Nations e-government survey 2016: e-government in support of sustainable development. New York.
United Nations (2012), United Nations e-Government Survey 2012: E-Government for the People, United Nations, New York, NY
Whitmore, A. (2012). ‘A statistical analysis of the construction of the United Nations E-Government Development Index,’Government Information Quarterly 29 (1),pp. 68-75.
World Bank (2006). A Definition of E-Government,[Online], [Retrieved December 07, 2016],http://web.worldbank.org/
Zafiropoulos, K., Karavasilis, I., &Vrana, V. (2012). ‘Assessing the Adoption of e-Government Services by Teachers in Greece,’ Future Internet, 4(4), 528-544.