Bucharest University of Economic Studies, Bucharest, Romania
Volume 2022,
Article ID 915166,
Journal of e-Learning and Higher Education,
13 pages,
DOI: 10.5171/2022.915166
Received date: 18 February 2021; Accepted date: 4 August 2021; Published date: 3 January 2022
Academic Editor: Radu D. Stanciu
Cite this Article as:
Ion-Dănuț Lixandru (2022)," University Marketing using the Howard-Sheth Paradigm", Journal of e-Learning and Higher Education, Vol. 2022 (2022), Article ID 915166,
DOI: 10.5171/2022.915166
A fundamental premise for understanding and forecasting the functioning of a system, modeling is a method that aids in the development of any phenomena, without question. Marketing modeling is a concept that is seldom utilized in university marketing. Any organization’s marketing activity necessitates the use of this technique since specific occurrences must be precisely identified. Good judgments and effective tactics are directly connected to the modeling process, which is straightforward to grasp. Using the Howard-Sheth behavior model, this article examines the degree to which university products may be used to recruit students. An examination of the most significant behavioral elements that influence the acquisition choice is presented in this article. It was determined that this approach could be applied by creating a decision tree, subjecting it to a sensitivity analysis and correlating the most influential elements to notice differences among respondents. As a consequence of the analysis, a new element was added to the model.
Keywords: Marketing, University Marketing, Marketing Models, Consumer Behavior
Introduction
The current situation of the educational environment, as well as the role that higher education plays in the contemporary society, which is constantly changing, puts us in the situation of generating a series of questions that can help us to know, whether educational institutions can lead to a much wider development of society. In this circumstance, questions can arise such as: can higher education institutions attract a larger number of students, relative to the competitive environment? Do they (universities) use all the resources and tools necessary to optimize their own activities to attract students? To what extent can these institutions change the decisions to choose university programs / products?
Mishra (2018) sees as the foundation of marketing, in higher education, the optimal use of resources by analyzing data and making the most beneficial decisions, in order to properly understand current and future students and to reach their level of expectations. A forecasting model helps to an important extent any organization, especially a university, to be able to analyze its own consumers, students, in order to establish its own strategies to attract them and complete the process of offering value.
Modeling In University Marketing
As Strong (2014) states, decisions depend on how to understand a situation, to know the directions of the variables in a game, and their strategic application is closely related to the decision maker’s use of the model. Coughlan, et al. (2010), attribute the modeling process in marketing to the questions “how?” and “why?”, considering that they are the basis for describing consumer behavior, segmentation, industry, and competition characteristics, and also considers that analytical models are strategic in that they try to explain certain phenomena and help to make good decisions and achieve maximum profitability.
Observationally, this role can also be attributed to the modeling process in university marketing, but studies to demonstrate the applicability of modeling in educational organizations are very limited, although with the help of modeling, valuable information can be obtained.
Coughlan, et al. (2010) consider that an analytical model can generate a number of problem-solving techniques, can attack problems from a real perspective, can help where other marketing tools fail to help us make decisions, and of course it can make very quick decisions that can definitely help any organization.
If we think from the perspective of the authors mentioned above, the existence of a model to substantiate decisions in higher education institutions is absolutely necessary. Referring to the previous questions (“how?” and “why?”), we can imagine what impact the explanation through a model of the purchasing decision-making process or a pricing model could have, as well as models for establishing promotion budgets in the university environment.
In order to observe the contribution of modeling in university marketing, we ordered the testing of a behavioral model, which can generate a series of strategic options, namely the Howard-Sheth model.
Howard-Sheth Model
In the article written by Xinhui and Han (2016), after an analysis from the perspective of the rational and irrational consumer, the factors influencing the decisions of different types of consumers, starting from the Howard-Sheth model, it is revealed that such a behavioral model gives various marketing possibilities and causes irrational behavior to prevail.
Prasad and Jha (2014) and Kurunathan and Shanmugathas (2017) describe the Howard-Sheth model as a model that sums up the learning of consumer attitudes and perceptions as a result of the application of stimuli. At the same time, the model, as noted by Kalpana and Shibu (2016, pp. 387-388), calls into question the decision-making process in the circumstance of lack of information about the product. In the same way, I can add, to those mentioned above (Kalpana and Shibu, 2016), according to the model, the other two situations in which the decision maker may be, namely having sufficient or partial information about the product.
According to the model discovered by John Howard and Jagadish Sheth, in 1963, the processes of consumer thinking from a decision-making perspective are explained.
The model contains 4 main blocks with variables, such as inputs – stimuli manifestations, perceptual variables, learning variables and outputs. These blocks present on the one hand endogenous variables (inputs, perceptual and learning), exogenous variables, and on the other hand, in the output block, we find behavioral manifestations.
The authors of this model, divide consumers into three types:
– those who have a lot of information and the purchase decision is rather based on a routine behavior: their decision-making route is a simple one, which does not require much effort. They have a strong predisposition on the brand and have well-defined selection criteria, and the evaluation of alternatives is unlikely. The probability of acquisition is high, and their decision-making process is in the form of:
INTENTION -> PURCHASE
CONSUMER TYPE 1
– those who do not have enough information and in the decision-making process other variables intervene: their decision-making path is a bit more complex and has a greater effort for the consumer, to form their attitude towards the product/service. The consumer, in this position, must outline his choice criteria and evaluate his alternatives. The probability of acquisition is lower compared to that of type 1 decision maker and their decision-making process is of the form:
ATTITUDE -> INTENTION -> PURCHASE
CONSUMER TYPE 2
– those who have no information at all and the decision has a number of unknown variables: the route of the decision has several paths, here they have not defined any selection criteria or relevant information, in practice, they are in the early stages of the decision. The probability of acquisition is lower than that of type 2 decision maker, and their decision-making process is of the form:
Although apparently a relatively well-organized, and observationally correct model, the Howard-Sheth model has little uncertainty about the links between its variables. Farley and Ring (1970, made a study applied to 2200 people and showed that the limits of this model are the reduced possibility of operationalizing some variables.
In order to verify its incidence in university marketing, as well as the possibility for it to generate information to help the good substantiation of strategic decisions, I conducted research that serves to test this model.
Research Methodology and Coordinates
Although apparently a relatively well-organized, and observationally correct model, the Howard-Sheth model has little uncertainty about the links between its variables. Farley and Ring (1970), made a study applied to 2200 people and showed that the limits of this model are the reduced possibility of operationalizing some variables.
Identifying the decision-making problem and the purpose of the research
Knowledge of the decision-making process, the foundation of consumer behavior and purchase, or purchase intention, is a major factor that can determine the market success of any organization, especially an educational institution.
The purpose of this research is to test the relevance of the Howard-Sheth model in university marketing, as well as to explain the purchasing decision-making process from its perspective, and to delimit the processes underlying the determination of the purchase intention.
Identifying research objectives and hypotheses
At the level of objectives, the present research aims to:
O1. Determine the most important variables in the model, for each decision maker category;
O2. Check the process (direction) for each of the types of decision makers given by the model;
O3. Verify and measure the factors of physical, mental and social influence.
Regarding the research hypotheses, they start from the following premises:
H1. The strongest influences on the decision are represented by the exogenous variables;
H2. In most cases, the probability of a positive decision to choose the university product is higher for type 1 decision makers;
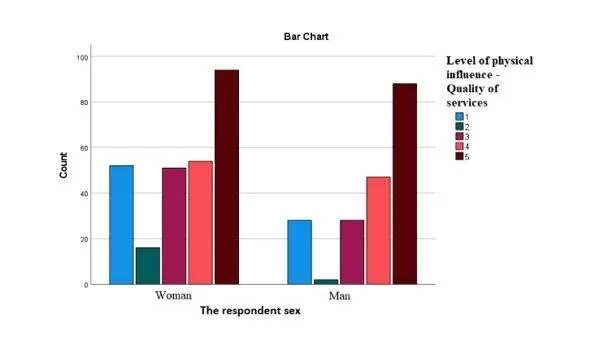
H3a. The strongest factor of physical influence is represented by the level of quality of services provided and (H3b) shows a statistically significant difference depending on the sex of the respondents;
H4a. The strongest psychic influence factor is represented by the level of the purchase price and (H4b) and presents a statistically significant difference depending on the sex of the respondents;
H5a. The strongest factor of social influence is represented by the family and (H5b) presents different volatilities depending on the sex of the respondents;
Estimating the value obtained from information and choosing the sources of information
Following the research, it is estimated that, through the degree of relevance, relevance and sufficiency of the data, it will be established the extent to which the applicability of the model is timely and favorable in the process of establishing university marketing strategies. The major influence of research data will be able to improve the quality of services in universities, but especially the way of predicting the behavior of potential consumers, which can help increase the adaptability of universities, depending on their needs.
In addition to the value of the research objectives, the study can provide important information regarding the respondents’ considerations regarding the university’s strengths and weaknesses, elements that can easily be transformed into data about external opportunities and threats, and also strategies may change depending on these results. Therefore, an analysis of the sensitivity of the variables in the model as well as the modification of the variables in favor of the university, not only improve the chance to choose the university product, but also offer a perspective on the activity of the organization.
Taking into account the resources, as well as the objectives and purpose of the research, it will have as a source of information students, who are direct carriers of the information needed for the study.
The article is a plus in university marketing for the contribution it brings to the knowledge of the decision-making process of purchasing university products. At the same time, it contributes to the development of the modeling process in university marketing, a field almost not touched by this area, and draws a direction for modeling research.
Research coordinates and sample size
Modal coordinates:
In order to achieve the objectives, a questionnaire with a number of 19 questions was created, which results in a number of 46 variables to be studied.
The questionnaire was applied to the students, after completing the act of purchasing the university product (bachelor’s program)
Sample size:
In establishing the sample size, the 95% probability of guaranteeing the result was taken into account (t = 1.96), the standard error ± 3.2%, respectively the population that presents the characteristics, more specifically, those who passed the baccalaureate exam, in 2019 (Edu.ro, 2019), a number of 84,833 graduates.
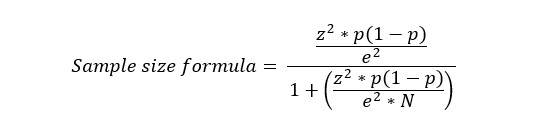
To determine the sample size, the following calculation formula was used:
Where:
N = population size
z = confidence level
e = standard error
p = standard deviation
Information processing, analysis and interpretation
The processing and analysis of the information was performed with the help of the IBM SPSS Statistics program, where several types of analysis of the questions were made by which the relative frequencies were established according to the researched variables.
Regarding the main analysis method, I used the decision tree method, a method not found in university marketing, much less in behavioral modeling used in university marketing. This method uses technology that helps divide large groups with different characteristics into small groups with similar records (Al Ghoson). The method is used in many fields and, of course, quite relevant. It finds the most important variables of a model, based on the reduction of the model, the more variables it has, the more important it is for the model (Song & Lu, 2015).
According to the calculations using the aforementioned formula, the sample size is 928 people. Given the research resources, it was addressed to 460 people, using a comprehensive sampling method, and the people were chosen from current students.
Results and Discussions
According to the analysis, regarding the first objective, the results are presented in the following form:
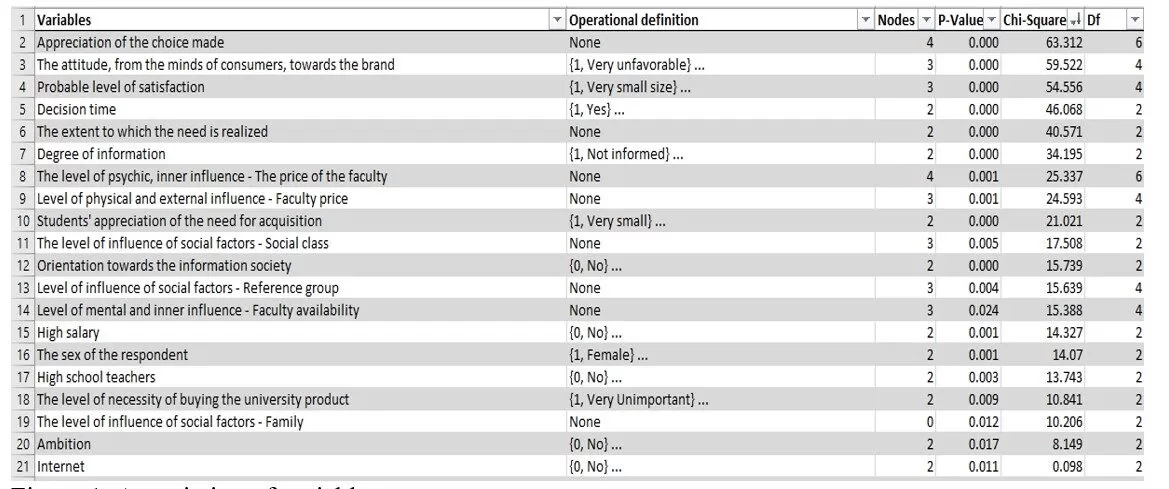
Figure 1: Association of variables
As can be seen in figure 1, after analyzing all the variables used in the model (46 variables), a series of 20 variables were generated showing an association with the decision variable. The figure reports in descending order, having as a reference element the chi-square association coefficient, the degree of relationship between the variable used as the center of the decision and the strongest influences on it.
Following the analysis, it can be noted that the strongest variable is the awareness of the benefit of the university product, with a chi-square association coefficient of 63,312, which shows that there is a significant difference between the two variables depending on the final decision chosen, making the purchase, thinking again or refusinge the purchase.
To verify the association differences of the variables, I performed a sensitivity analysis for the first variable. Following the analysis, we noticed that the degree of association between variables decreases at similar changes and increases at maximum or minimum changes of the decision value. In other words, when all decision makers tend to go in the same direction of the decision, the degree of association decreases, and when there is a clear distribution of answers / decision, the degree of association increases.
Consistent with the first research objective, I can say that most variables that have a major influence on the decision, are endogenous in nature as seen in fig. 1, therefore, the H1 hypothesis is rejected.
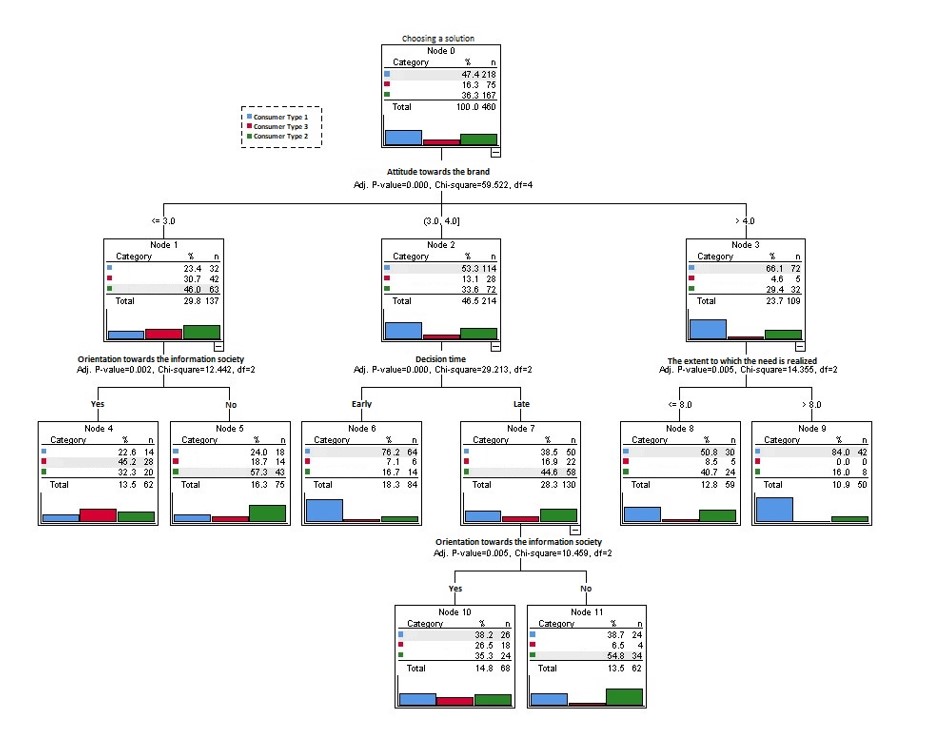
In order to test hypothesis 2, I created, with the help of the analysis in SPSS, a decision table for all types of decision makers. The analysis contained all 46 variables, which were reduced to a number of 4 variables, which shows the highest probability of choice for the types of decision makers. According to the analysis, a series of 11 nodes were generated, which contain the variables with maximum probability of winning for each type of decision maker.
CONSUMER TYPE 1
The road of type 1 decision maker passes through nodes 9, 6, 8, 11, 10, 5 and 4, as can be seen in figure no. 2. Therefore, for type 1 decision-maker who is aware of the need, on a scale of 1 to 10, above level 8, and the attitude towards the brand is very favorable, the probability of buying the product is 84%. The same type of decision maker for whom the brand is an important asset to the indifferent, in a proportion of 76.2%, will make the decision in a not very short time, and the probability that those who consider their need is a real one, on a scale from 1 to 10, below the level of 8, inclusive, and considers the brand to be a very important element, it is 50.8%. In the case of the variable that states the orientation towards the information society, the probability of choosing the university product is 38.7 percent. Those who do not have inclinations towards the new society make the decision slowly and consider the brand as an important component in decision making. The decision maker gained 38.2 percent in the case of those who support information development, the gain originated from the category of those who made the decision in a very short period, and they also believe that the brand is an essential element. To a lesser extent, 24% and 22.6%, respectively, is the probability of acquisition in the case of those who have created a less favorable image of the university product brand and who are oriented towards the knowledge society (24%) or not (22.6%).
CONSUMER TYPE 2
As shown in figure 2, the gains for type 2 decision maker are in the case of nodes 5, 11, 8, 10, 4, 6, and 9. The highest probability of acquisition (57.3%), in the case of those undecided , is in the right of those who evaluate the brand of the product as unfavorable and are not oriented towards the information society, followed by those who have a favorable attitude towards the brand, make the decision relatively difficult, over time, and are not oriented towards the information society (54 , 8%). A gain from type 2 decision maker can come to a good extent (40.7%), from those who consider the image of the product to a very large extent and consider that its need is on a level (from 1 to 10) 8 or below 8. The next probability (35.3%) of the purchase of the product, comes from the one who considers the brand favorable or indifferent, makes the purchase decision more difficult in terms of time and is company-oriented informational. 32.3% is the probability that the one who has a less favorable attitude towards the brand is oriented towards the information society. The percentage drops to 16.7% in the case of those who quickly decide to purchase and have a favorable attitude towards indifference to the brand. Type 2 decision makers, who consider the brand to be a very strong element in decision making and are aware of the need at a level above 8 (on a scale of 1 to 10), have a 16% probability of making the purchase.
CONSUMER TYPE 3
The profile of decision maker 3, who has the lowest product purchase probabilities, has gains in nodes 4, 10, 5, 8, 6 and 11. The probability that those who do not have enough information (decision maker type 3) to buy the product is relatively low, but those with a higher probability are those who have a less favorable opinion towards the brand and who are oriented towards the information society (45.2%). The next ones who are liable to become buyers, with a probability of purchase of 26.5%, are those who are oriented towards the information society, make the purchase decision quickly and have a favorable to indifferent brand attitude. With an acquisition probability of 18.7%, there are those who have adopted an indifferent or unfavorable position on the brand and are not oriented towards the information society. The level of achievement of the purchase reaches the percentage of 8.5% in the case of those who consider that the image of the product is very important and are aware of the need at a level of 8 and less than 10 maximum. Those who make the decision quickly and consider that the brand of the product, for them, to be indifferent to important, have a purchase probability of 7.1%. Also, among those who have an indifferent to favorable attitude towards the brand are distinguished with a probability of 6.5% those who do not believe in the benefits of the information society and make the acquisition decision in a longer time.
Figure 2: Decision tree
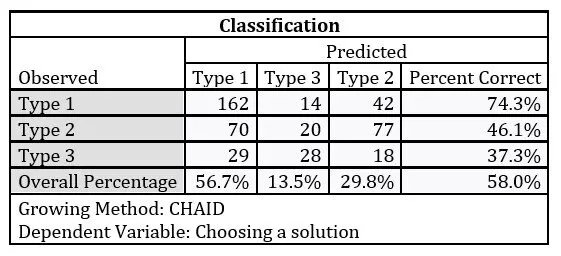
In order to observe the difference between the types of decision makers, we have generated a classification that shows in front of which there is a greater possibility to buy the university product. As we see in table 1, the highest probability of acquisition is next to type 1 decision maker, with a percentage of 74.3%, followed by type 2 with 46.1%, respectively type 3 with 37.3%.
Table 1: Acquisition probabilities
According to the previously mentioned results, we can confirm the hypothesis (H2), according to which the acquisition probabilities are decreasing depending on the type of decision maker, as can be seen in table 1.
Consistent with the results obtained in the analysis, and with objective number 3, I established the most important factors of physical, mental and social influence through their individual research and I noticed that they may differ depending on the sex of decision makers, and the most important factors are the following:
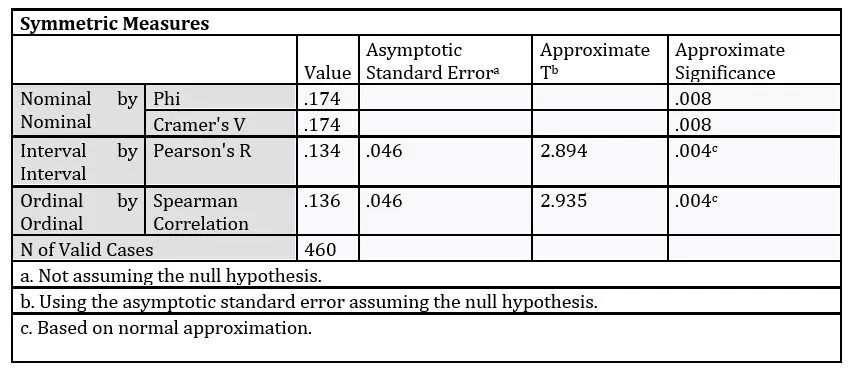
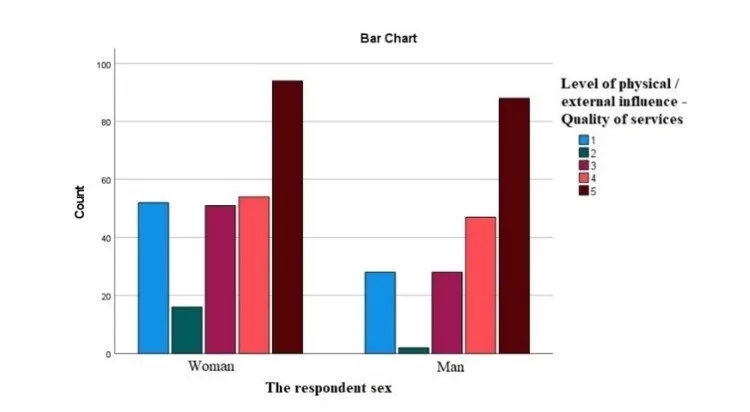
Table 2: Statistical indicators – physical influence – respondent sex
Figure 3: Correlation – physical influence – sex of the respondent
We can consider, with the help of the Phi coefficient, with the value of 0.174 (shown in table 2 and figure 3) that there is a positive link between the two variables of very low intensity, therefore, we can reject the H3b hypothesis, which claims that there are noticeable differences between the sexes of the respondents regarding the most important physical influence, and at the same time we can accept the H3a hypothesis, which predicts the quality of services as the most important factor of physical influence.
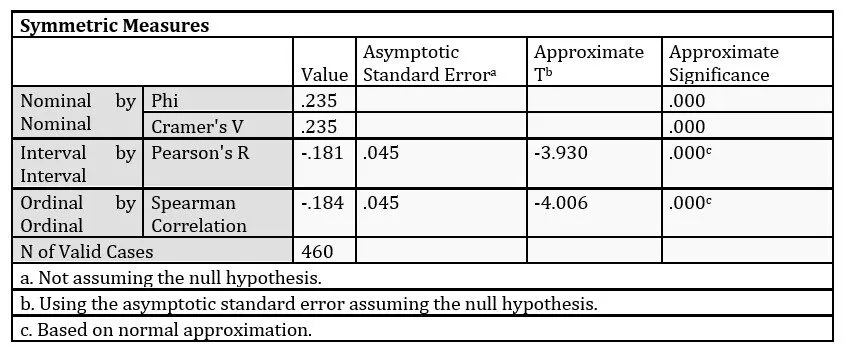
An extremely important element in choosing a product is the product of competitors, which can have a positive role in our favor, as shown by the analysis that shows that the distinctive/ differentiating elements are taken into account to a significant extent. Also, here we observe regarding the Phi coefficient, which has the value of 0.235 (table 3 and figure 4) as it shows us that between the variable Respondent Sex and the Level of psychic influence – distinctive elements, there is a positive connection, but a weak connection. Therefore, we can refute both the H4a and H4b hypotheses, which claim that the most important element of psychic influence is price and that there is a statistically significant difference between the sex of the respondents and the influence exerted on them.
Table 3: Statistical indicators – mental influence – respondent sex
Figure 4: Correlation – psychic influence – sex of the respondent
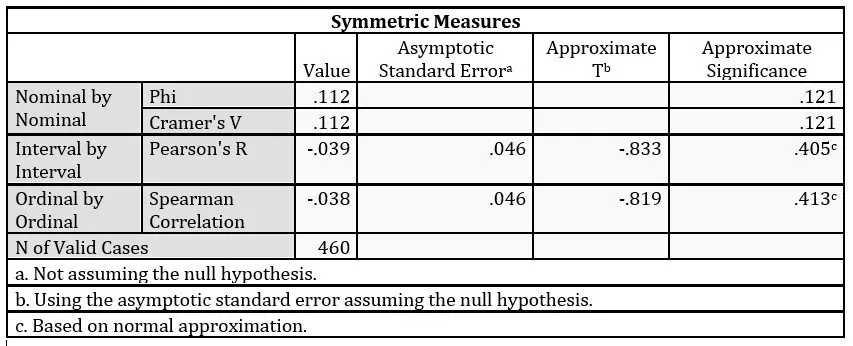
The same analysis, as in the other two cases, as we can see in table 4 and figure 5, I used to determine the most important factor of social influence, as can be seen is the social class, according to the percentage of influence of 11.2%, calculated in correlation with the variable Sex respondent. At the same time, as we can see in table 7, the Pearson correlation coefficient, with the value of -0.039 shows us that between the variable social class and sex of respondents there is a negative correlation, almost non-existent, calculated at a 95% confidence interval, which indicates that the relationship between the two variables is not statistically significant. According to the previously mentioned results, we can refute the hypotheses H5a and H5b, which support the idea that the family is the most important factor of social influence and that there are significant differences, at the level of choices, between the sexes of the respondents.
Table 4: Statistical indicators – social influence – respondent sex
Figure 5: Correlation – social influence – sex of the respondent
It goes without saying that the most important aspects of the paper are related to determining the most important influences on purchasing behavior, resulting from the Howard-Sheth model, which demonstrates its applicability in the case of a university product. At the same time, the determination of the degree of influence, at percentage level, on the acquisition, for the most important variables, represents a piece, a sine-qua-non component in the current marketing, all the more in the case of university marketing.
The relevance of the article is attributed to the changes in university marketing, which, along with generations of consumers, students, need to be constantly updated to meet the most important goal of marketing, namely, creating greater consumer satisfaction, in the best conditions. The biggest changes, as we saw in the previously mentioned results, can occur at the level of influencing factors, and if they are not noticed and at the same time modified in a positive sense, the organization may suffer.
Possible discussions on the subject can be brought around the reasons and criteria for choosing the product, on the dynamics of the types of decision makers in terms of personality, perception in relation to the ever-changing society, and, perhaps even around the idea of determining and eliminating the risks of decreasing the probability of acquisition.
Conclusion
What results from the series of findings in the results section is the applicability of the Howard-Sheth model, and the timeliness and relevance of this information may demonstrate that it is appropriate to create a set of strategies consistent with the behavior and segments of the consumers analyzed.
Even if, according to the results, there is not a very high incidence and degree of influence for all the variables included in the model, in the most important influence variables, we find both elements of inputs – stimuli, perceptual variables, learning and output variables. As can be seen in table 1, each of the types of decision makers respects their probability of acquisition, which is another pro argument of applicability. At the same time, the analysis of the correlation of the most important influencing factors of social, mental and physical nature, which shows that there are no statistically significant differences between the sexes of the respondents, can offer an advantage to the university in creating strategies.
In the current conditions of the university market, understanding the behavior of their own consumers can offer a wide range of opportunities and expose their consumers to easily predictable choices for universities. This offers a huge advantage for organizations that use new technologies and behavioral analysis techniques to attract, connect and retain customers responsibly.
It is worth mentioning that, as the research results show, focusing on determining the most important influencing factors and, subsequently, increasing confidence in each of them, can lead to exceptional purchasing results.
The same analysis, used to determine the degree of association between independent variables and the dependent variable (decision), and its result, can generate the degree of influence of all independent variables, percentage, and then, depending on its resources, the educational institution can address a series of strategies to help it increase the extent to which the consumer wants the purchase.
At the same time, an attempt to revise the Howard-Sheth model may be beneficial given the addition of new, more current stimuli. As the decision-making tree shows, students are largely oriented towards the information society, and this phenomenon is specific to our days, an era of information technology that increasingly influences the behavior of individuals. Observationally, the Internet influences consumers both at the level of information and at the mental level (through the communities created there and their individuals), and this fact cannot be ignored by an organization, especially by an educational institution, in a technology-dependent society and especially young people who are most subject to the persuasion of this virtual environment.
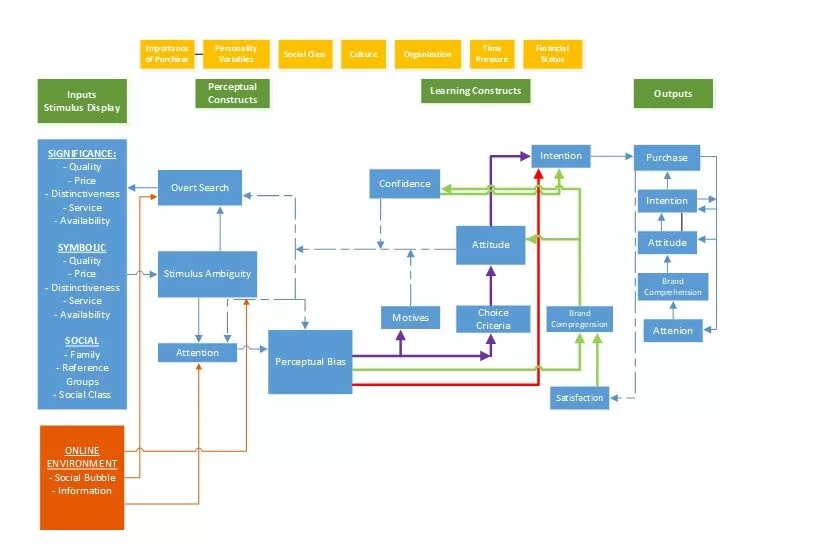
To conclude, we came to the idea that considering one of the most representative nodes in the decision tree, namely the orientation towards the information society and the context in which the main consumers (young) are today, we decided to add in the block of entries a new element, namely the Virtual Environment, as we can see in figure 6, with two sub – elements of great importance for current consumers – the social bubble and information. The first stimulus, the social bubble, can be translated through the group of friends and organizations with which consumers interact in the virtual environment and who can change their decision, and the second stimulus, information, refers to the notions that are considered relevant by them, regarding the product.
Figure 6: Adaptation of the Howard-Sheth model
References
Al Ghoson, A. M. (n.d.). Decision Tree Induction & Clustering Techniques In SAS Enterprise Miner, SPSS Clementine, And IBM Intelligent Miner – A Comparative Analysis. International Journal of Management & Information Systems – Third Quarter 2010 Volume 14, Number 3, 14(3). doi:https://doi.org/10.19030/ijmis.v14i3.841
Coughlan, A. T., Choi, S. C., Chu, W., Ingene, C. A., Moorthy, S., Padmanbhan, V., . . . Zhang, J. Z. (2010). Marketing modeling reality and the realities of marketing modeling. Marketing Letters, 21(3), 317-333. doi:DOI 10.1007/s11002-010-9110-5
ro. (2019). Bacalaureat 2019, sesiunea iunie – iulie: rezultate finale după soluționarea contestațiilor. București: Ministerul Educaţiei și Cercetării. Retrieved from https://edu.ro/bacalaureat-2019-sesiunea-iunie-iulie-rezultate-finale-dup%C4%83-solu%C8%9Bionarea-contesta%C8%9Biilor
Farley, J. U., & Ring, W. L. (1970). An empirical test of the Howard-Sheth model of buyer behavior. Journal of
Marketing Research, 7, 427-438. Retrieved from http://www.jstor.org/stable/3149635
Kalpana, R., & Shibu, N. S. (2016). INFLUENCE OF FEW VARIABLES ON CONSUMER BUYING BEHAVIOUR. International Journal of Management, 7(7), 387-394. Retrieved from http://www.iaeme.com/ijm/issues.asp?JType=IJM&VType=7&IType=7
Kurunathan, D., & Shanmugathas, S. (2017). EXPLORING THE MODEL FOR CONSUMER CHARACTERISTICS LINKED WITH TECHNOLOGY MARKETING. INTERNATIONAL JOURNAL OF BUSINESS, SOCIAL AND SCIENTIFIC RESEARCH, 6(1), 27-36. Retrieved from http://www.ijbssr.com/currentissueview/14013237]
Kurunathan, D., & Shanmugathas, S. (2017). Exploring the Model for Consumer Characteristics Linked with Technology Marketing. INTERNATIONAL JOURNAL OF BUSINESS, SOCIAL AND SCIENTIFIC RESEARCH, 6(1), 27-36.
Prasad, R. K., & Jha, M. K. (2014). Consumer buying decision models: A descriptive study. International Journal of Innovation and Applied Studies, 6(3), 335-351.
Song, Y.-t., & Lu, Y. (2015). Decision tree methods: applications for classification and prediction. Shanghai Archives of Psychiatry, 27(2), 130-136. doi:http://dx.doi.org/10.11919/j.issn.1002-0829.215044
Strong, H. (2014). Marketing and Management Models: A guide to understanding and using Business Models. (N. Malhotra, Ed.) New York: Businesss Expert Press.
Xinhui, C., & Han, D. (2016). A meta-analysis of consumer irrational purchase behavior based on Howard-Sheth mode. Journal of Business and Retail Management Research, 10(3), 69-80.