Faculty Development Program Alumnus, University of North Florida
Faculty of Economics and Finance, Saint-Petersburg State University of Economics, Sadovaya, St. Petersburg, Russia
Volume 2018,
Article ID 783590,
Journal of Economics Studies and Research,
19 pages,
DOI: 10.5171/2018.783590
Received date: 5 February 2018; Accepted date: 30 May 2018; Published date: 18 July 2018
Cite this Article as:
Konstantin B. Kostin (2018), “Investment Attractiveness Assessment of Global Russian Companies", Journal of Economics Studies and Research, Vol. 2018 (2018), Article ID 783590, DOI: 10.5171/2018.783590
This study investigates the effects of value-based management framework adoption for assessment of investment attractiveness in one of the most promising developing markets in Russia. One of the most attractive sectors of the Russian economy is selected for the analysis: the retail grocery sector which displays sustainable growth and has significant growth potential. The relevant value drivers are determined, and value creation is investigated. The value-based management model for investment attractiveness assessment is proposed and applied. Our analysis shows that implementation of value-based management principles leads to growth and greater investment attractiveness of the companies for potential investors.
According to Glen Arnold (Arnold, 2013), value-based management (VBM) could be defined as “a managerial approach in which the primary purpose is long-run shareholder wealth maximisation. The objective of the firm, its systems, strategy, processes, analytical techniques, performance measurements and culture have as their guiding objective shareholder wealth maximisation.” Value-based management interlinks the valuation of the shares of a company with its strategy, organizational and financial situation. It is a holistic management approach which focuses on working towards the value or in other words, maximizing shareholder value. Value-based management focuses directly on creating value. The value is created by pursuing the goals that support value creation (Hundal, 2015). An important notion that relates to the VBM approach is that the shareholders’ wealth creation objective is not necessarily in conflict with interests of other stakeholders. Even though VBM is mainly focusing on shareholder value maximization, it is important to understand that other stakeholders are very important in this approach as well.
Value is the key factor in investing. Investments are done in the expectation that value of the investment is growing so that for the risk taken a compensation is gained. We argue that the company’s ability to create value for its shareholders is the main measure that should be considered in a market economy. Value takes into account the long-term interests of all stakeholders in a company. Maximizing shareholder value seems to create good outcomes for all the stakeholders, which tells us about the importance of the value creation (Koller, et al., 2010). When companies are creating a real value, there will not be fear of value-destroying investments. On the contrary, when the value is forgotten, market bubbles and financial crises are more likely to develop. Koller et al. mention that behind the economic crises which emerged in 2007 was the unpleasant fact that value was underrated and not taken seriously.
According to certain research findings, Russia, being part of the BRICS counrties, is one of the most prosperous markets for investment, offers ample business opportunities along with a consumer market hungry for new products, brands, and services, which, most importantly, is ready to “digest” them. Russia is among the world’s fastest-growing economies in terms of domestic market size (Kostin, Adams, Samli, 2015). Consumer purchasing power in Russia is four to eight times greater than in China, India and certain European countries (USDA, 2013).
Economists from various institutions (The Economist Intelligence Unit, OECD and the Central Bank of Russia) believe that after two years of recession the Russian economy and the Russian GDP will experience times of economic recovery and growth which would open up new investment opportunities.
One of the fastest growing market sectors in Russia, representing one of the highest investment potential is the grocery retail (Kostin, Denslow, 2015). The grocery retail industry is rapidly developing, becoming more effective, less fragmented and more accessible to consumers in Russia. The Russian grocery retail market at the end of 2015 constituted 172 billion dollars and is forecasted to grow to 285 billion of dollars by 2020. The comparative data on European and BRIC grocery retail market is presented in Figure 1.
Figure 1: Largest European & BRIC grocery retail market by 2020 ($USbn) (Created by author based on the data acquired fromLenta, 2017)
Our empirical investigation is focused on detecting value-based management principles and practices adoption by selected Russian companies representing one of the most dynamically developing marketing sectors in Russia. Our analysis is focused on the retail grocery sector of Russia as a recepient of VBM principles and practices. We argue that once the VBM principles and practicies are permanently adopted by global Russian companies, the quality of corporate governance, the transparency, economic growth and the investment attractiveness of companies in Russia will further increase.
The next section reviews the literature on value drivers and value creation in value-based management. The setup of the analytical model is explained in the subsequent section. The empirical results based on value metrics calculations are presented and discussed in the section after that. The final section provides a summary.
Value Drivers and Value Creation
Maximizing shareholder value is an important corporate objective, but it is too distant and undetailed from the operating management view. It is important to “translate” corporate objectives to the operational level. Managers have to know which factors are creating most value and which factors to focus on. These factors are called “value drivers”, and they are the primary focus of companies that are maximizing shareholder value. Value drivers ensure that strategy relates strongly to the practical operations (Lek, 2017).
Value drivers are those economic variables that are significantly contributing to the company’s growth and overall success. There are many different opinions of the value drivers and the number of the drivers that researchers find to be the most vital vary. Turner (1998) has identified eight value drivers. These are: sales growth rate, operating profit margin, income tax rate, incremental investment in working capital, incremental investment in fixed capital, replacement of fixed capital, cost of financing and the planning period. The key drivers of the VBM framework are usually derived from sales, costs and assets (Akalu, 2002). As mentioned, value drivers are different depending on the industry and the key drivers often vary between companies in the same industry.
A value driver is something that adds value to a product, service or brand. In practice value drivers are those activities or capabilities that enhance profitability, reduce risk, and promote growth. Hence, focusing on value drivers leads towards the company’s strategic goals (Rouse, 2016). In VBM the strategic goals are mainly associated with shareholder value. Value drivers affect the company’s bottom line or profit and the main benefit of a value driver is that it provides a competitive advantage to a business in its industry. In practice, value drivers can be for example great brand awareness or very advanced technology.
In VBM it is especially important to understand those factors that are really creating the firm’s value. Finding and understanding those key value drivers helps companies to focus on the right things, when targeting value creation. Through the key value drivers firms can add value. Value drivers are also helping people in the lower positions of organization to clearly understand what they are targeting.
Koller (Koller, 1994) emphasizes that the important issue about key value drivers is that even though they are a seemingly small part of the total business, they have a big effect on the results. In case of VBM the result is increased business value. The second issue is that these key value drivers should be measurable and actively monitored by the management. Those good drivers are also good to review regularly (Koller, 1994).
There are many different ways to determine value drivers and most of the researchers describe value driver as some kind of competitive advantage. Alfred Rappaport (Rappaport, 1998) has a different view and he identified seven value drivers that affect shareholder value. These are:
Rate of sales growth
Operating profit margin
Income tax rate
Investment in working capital
Fixed capital investment
Cost of capital
Value growth duration
The guiding principle of value creation is the company’s core competence and competitive advantage. Sustainable fast growth is possible when the company has a clear and well-defined competitive advantage (Koller et al. 2010). To focus directly on creating value, companies should set goals in terms of discounted cash flow value or some other value metrics. Discounted cash flow value is directly measuring value creation, considers long-term view and the need to manage the company’s balance sheet. That’s why it is widely utilized (Koller, 1994). Value creation requires that the company is working successfully and in harmony with shareholders and all the stakeholders.
Koller (Koller, 1994) mentions also the company’s need of nonfinancial goals, i.e. goals that target customer satisfaction, product innovation, and employee satisfaction for example. Those are important signals for the staff about the company’s interests. Such goals do not contradict the value maximization. The most prosperous companies are usually just those that are doing well in these areas. Nevertheless, those nonfinancial goals must be carefully considered so that they do not damage the company’s financial circumstances (Koller, 1994).
Arnold (Arnold, 2013) has created a three-step model of value-based management for shareholder value creation, presented in Fig. 2. First step is creating awareness for the whole organization about mission that will create value for shareholders. Second, create the measures for value creation at all organizational levels and the measures should be understood and accepted by everyone. Third, make sure that all managers in the company are working towards the objective of value creation (Arnold, 2013).
Figure 2: The Three Steps of VBM (Created by author based on the data acquired from Arnold, 2013)
Well implemented value-based model leads to superior results in value creation. For example, Compass Group, a British multinational contract foodservice, cleaning, property management and support services company has reached very good results in comparison with average FTSE100 (Arnold, 2013). This shows us that even for a large and successful company VBM can offer remarkable benefits. In Russia VBM is not so widely utilized and there could be immense value enhancement opportunities by means of VBM. As far as the Russian financial background is concerned, the use of VBM is still somehow considered a new practice. Some corporations are acting like pioneers (according to a survey conducted by KPMG in 2010 (Sibru, 2012), an estimated 25% of Russian companies apply value-based management in operational practice), focusing on the maximization of firm’s value and on satisfaction of proprietors. There are several reasons which explain the lack of VBM adoption in Russia, quite effectively pointed out by Zhabin and Kandrashina (Zhabin, Kandrashina, 2009): Russian corporations are often built on the interpenetration between investors and managers, and the feeling of mistrust towards managers is a widespread attitude in the country, along with the fear of losing control of the firm. VBM could therefore provide a “bridge” between principals and agents, improving their interaction for companies’ sake, moreover there’s still room for VBM implementation for many operational and tactical purposes: from the evaluation of investment plans (through value-based indicators and criteria) to the gap diminishment in divided organizational structures (Sirbu, 2012). These are just some general possible application areas, but a large gamma of positive aspects (different for each business sector) requires futher empirical investigation.
We can state that the shift towards the value-based management adoption in the Russian Federation is progressing and we attempt to quantitatively measure the effects of VBM adoption by the global Russian companies operating in the retail sector and relate these effects with the economic growth of the companies and their attractiveness for investors.
Model Set Up And Data
Value Metrics
Economic Value Added – EVA
The technique of Economic Value-Added (EVA) has been widely used and popular in finance and accounting research. EVA is proved to be an excellent performance measurement technique in comparison with the traditional measures like Return on Invested Capital (ROIC). The Economic Value Added is a popular tool used to estimate the value created by a firm.The economic value added (EVA) is an estimate of a firm’s economic profit or, in other words, the value created in excess of the required return of the company’s shareholder. The idea is that value is created when the return on the firm’s economic capital employed exceeds the cost of that capital (Investopedia, 2017).
In order to calculate the value of the index, we cosidered utilizing two different but equivalent formulas:
EVA = (ROIC – cost of invested capital) * Invested Capital (1)
EVA = NOPAT – WACC * Invested Capital (2)
In our analysis we used the second formula because it was more relevant given the available dataset.
The net operating profit after tax (NOPAT) values were derived from the finanical reports of the respective companies. The weighted average cost of capital (WACC) was devised according to the formula, thus
(Total Equity / Total Debt + Total Equity) * Cost of Equity + (Total Debt / Total Equity + Total Debt ) * Cost of Debt * (1 – tax rate)(3)
The cost of Equity and the Cost of Debt had been calculated as follows:
weighted average of the Russian Central Bank interest rate for each year
+ 3% premium for the Cost of Equity, under the assumption of “BB” (stable) rating by S&P
+ 2,20% premium for the Cost of Debt
the corporate profit’s tax rate in Russia of 20%
EVA is a numerical indicator that allows investors to understand the consistence of gap between profit and expenses, since a positive value (EVA>0) implies the ability of the firm to create value, while negative values (EVA<0) means that the firm under evaluation destroyed value in the respected time period.
As far as comparison with other indicators is regarded, EVA provides a more realistic depiction of the corporation’s results, due to inclusion of both operating and capital costs. The main advantage of EVA is the enhancement of likelihood of goal-congruent behaviors by managers, thus they need to strive for investment projects with EVA>0, which are viewed favorably by shareholders as well. On the other hand, it could be regarded as a financial indicator with a short-term orientation.
Market Value Added – MVA
The concept of Market Value Added was developed by Stern Stewart. This basic metric is focusing on the relation between the total invested capital in the business and the current market value of the company. This metric shows how well the available capital has been utilized. A positive MVA indicates positive value creation and respectively negative MVA indicates negative value creation, value has been destroyed (Arnold, 2013). Market Value Added is the figure that explains the difference between the market value of a company and the capital contributed by investors, both bondholders and shareholders. In other words, it is the sum of all capital claims held against the company plus the market value of debt and equity.
It is calculated as (Investopedia, 2017):
MVA = Market Value of Equity + Market Value of the Debt – Book Value of the Capital Employed (4)
A company’s MVA is an indication of its capacity to increase shareholder value over time. A high MVA is evidence of effective management and strong operational capabilities. A low MVA can mean the value of management’s actions and investments is less than the value of the capital contributed by shareholders.
Companies with a high MVA are attractive to investors not only because of the greater likelihood they will produce positive returns but also because it is a good indication that they have strong leadership and sound governance. MVA can be interpreted as the amount of wealth that management has created for investors over and above their investment in the company. Companies that are able to sustain or increase MVA over time typically attract more investment, which continues to enhance MVA.
For the sake of simplification, we’ve been considering that the market value of the debt equalls the book value. Therefore in our case, MVA was computed by subtracting the owners’ equity from the market capitalisation. The MVA calculations were performed only for the current year as the MVA value also reflects the achievements of the previous years.
Free cash flow – FCF
Free cash flow (FCF) is a measure of a company’s financial performance calculated as operating cash flow minus capital expenditure. FCF represents the cash that a company is able to generate after spending the money required to maintain or expand its asset base. FCF is important because it allows a company to pursue opportunities that enhance shareholder value.
FCF is an assessment of the amount of cash a company generates after accounting for all capital expenditures, such as buildings or property, plant and equipment. The excess cash is used to expand production, develop new products, make acquisitions, pay dividends and reduce debt. Specifically, FCF is calculated as (Investopedia, 2017):
EBIT (1-tax rate) + (depreciation) + (amortization) – (change in net working capital) – (capital expenditure) (5)
Some believe that the finance focuses only on earnings while ignoring the real cash that a firm generates. Earnings can often be adjusted by various accounting practices, but it’s tougher to fake cash flows. For this reason, we believe that FCF gives a much clearer view of a company’s ability to generate cash and profits.
However, it is important to note that negative free cash flow is not bad in itself. If free cash flow is negative, it could be a sign that a company is making large investments. If these investments earn a high return, the strategy has the potential to pay off in the long run.
The Free Cash Flow is the company’s available cash flow calculated as the difference between positive operating cash flow and the cash flow for investment on fixed assets. So, we can interpret this figure as the remaining amount of money deriving from operating activities, after the investments on fixed assets that, in the non FCF theory, increase the market value of the company.
Earnings before Interest Depreciation & Amortization Margin – Ebitda Margin
The EBITDA MARGIN is a measure widely used in order to assess the company’s cash flow. It is defined by the Earnings before Interests, Taxes, Depreciation and Amortization. The EBITDA MARGIN is a means that allows to evaluate whether a company produces profit or loss in its operating business (Investopedia, 2017).
EBITDA MARGIN is one indicator of a company’s financial performance and is used as a proxy for the earning potential of a business. EBITDA MARGIN is essentially net income with interest, taxes, depreciation and amortization added back to it over total revenues. EBITDA MARGIN is often used in valuation ratios and compared to enterprise value and revenue. We choose this particular indicator while it can be used to analyze and compare profitability between companies and industries given that it eliminates the effects of financing and accounting decisions.
Operating Income Before Depreciation & Amortization – OIBDA
OIBDA is a financial metric whose main purpose, as far as investors are regarded, is the check of a firm’s operating efficiency, through the focus on core operations. It differs from EBITDA MARGIN because it excludes non-operating profit (or loss) in the index computing, such as investment in intangible assets, tax deductions and all the non-operating expenses. Calculations are performed accoding to the following formula (Investopedia, 2017):
OIBDA = Net operating profit + Depreciation + Amortization (6)
The focus on corporations’ daily operations allows the OIBDA to be considered as a quite trustworthy indicator of the real value of the company, which could be extremely useful for investors.
Proposed Model
Therefore, cosidering the developed framework we propose the following model presented on Fig. 3, which we are going to apply in subsequent sections towards VBM implementation and investment attractiveness determination.
Figure 3: VBM implementation and investment attractiveness determination model
(Created by author)
The relevant data for the calculations were derived from the financial statements of the respective companies. In our opinion the application of the described value measurement indicators and techniques combined determines the investment attractiveness of companies under investigation and provides better justification of conclusions drawn in the relevant section.
Companies under Investigation
The model proposed in the previous section was applied to the retail sector – one of the most promising and advanced market segments in Russia (Kostin, Denslow, 2015). The biggest players – largest and most successful companies operating in the retail sector in Russia were selected for investigation: Magnit, X5 Retail Group, Dixy Group, O’Key Group and Lenta.
The brief overview of the companies under investigation is presented below.
“Magnit” is the Russian market leader by the number of food stores and their geographical coverage. The company’s chain of stores included 14 059 stores as of December 31, 2016, of which: 10 521 are convenience stores, 237 hypermarkets, 194 “Magnit Family” stores and 3 107 “Magnit” Cosmetic stores.
“Magnit” retail chain operates in 2 495 locations in Russia. The vast covering territory lies west and east from Pskov to Nizhnevartovsk, north and south from Arkhangelsk to Vladikavkaz. The majority of stores are located in Southern, North Caucasian, Central and Volga Federal Districts. There are “Magnit” stores in Northwestern, Ural and Siberian Districts. The company opens its stores both in cities and small locations. Approximately two-thirds of stores are located in towns with the population less than 500 000 people. The company has developed the distribution network of 34 distribution centers for more effective storage of goods and optimization of their transportation to the stores. It also owns the large fleet of 5 861 vehicles. “Magnit” retail chain is the leading retailer in Russia by sales. The revenue of the company for 2016 is 1 069 205,85 million rubles. The company is also a major employer in Russia. The total number of “Magnit” employees exceeds 260 000 people. “Magnit” retail chain was awarded with the “Attractive employer of the year” title multiple times (Magnit, 2017).
X5 Retail group is Russia’s second largest food retailer which operates four brands (Pyaterochka, Karusel, Perekrestok, Perekrestok Express) in distinct market segments which appeal to a wide range of shoppers and budgets. Each format maintains its own commercial, marketing, finance, HR, security and business development functions. While Pyaterochka organizes its own logistics, logistical operations for Perekrestok and Karusel are shared. In 2016 X5’s total store count exceeded 9,100. The revenue in 2016 constituted 1 033 667 million rubles (X5 Retail Group, 2016).
DIXY is Russia’s third largest national food retailer with revenue of 311 bln. rubles in 2016. The Victoria supermarket division generates 13% of revenues and the compact hypermarkets division under the Megamart brand accounts for around 7% of revenues. As of 31, March 2017, the Group operated 2 729 stores. Dixy group is present in Russia’s Central, Northwestern and Urals Federal Districts: it sells food and non-food products to customers in 758 cities and towns across Russia (DIXY, 2017).
O’Key Group is the 4th largest national hypermarket chain by revenue, which constituted 175 471 million rubles in 2016. The company employes over 25500 employees. As at September 10, 2016, the group operated 159 stores across Russia: 73 hypermarkets, 37 supermarkets and 49 discounters stores (O’Key, 2017) and London stock exchange online resource (OKEY, 2017).
Lenta is a price-led, distinctive hypermarket group in Russia. Lenta operates 195 hypermarkets in 78 cities across Russia and 53 supermarkets in the Moscow, St. Petersburg, Novosibirsk and the Central region of Russia. Lenta has more than ten million active loyalty cardholders and approximately 93% of all sales in Lenta stores are tied to their loyalty card program. Lenta employs around 45 635 full time employees as of 31 December 2016. Lenta’s sales constituted 306 billion rubles in 2016 (Lenta, 2017).
Estimation Results
The investigation results will be discussed in accordance with the developed framework.
EVA Indicator
Figure 4 presents the results of EVA calculations based on financial data for selected companies: Magnit, Lenta, Dixy, X5 Retail Group and O’Key.
Figure 4: EVA for selected companies. (Calculated by author based on financial data of the selected companies)
As we can conclude from this chart, Magnit is the only company that, according to the calculated EVA index, is performing positively and could be considered attractive to the investors according to this indicator. Within the five year timeframe taken into consideration, Magnit has recorded a continuous increase in performance with its peak in 2015.
All the other retail companies have performed rather poorly according to the calculations, especially in the case of X5 Retail Group where there is indication of undermined wealth. Nevertheless, these data could give unfair representation of the company performance, since according to our research the company had heavily invested in fixed assets in order to enlarge its network of stores in Russia and hence increase its marketshare which would contribute to superior returns in the mid to long run. Obviously this approach is part of a managerial strategy aiming at creating stable wealth for the investors. Another important point to consider is the macroeconomic situation in Russia, highlighted by wide fluctuations of the interest rates in the recent past which had definitely contributed to the increase in the cost of capital and the cost of debt for all companies under investigation. We suggest that Magnit is currently the most appealing investment according to the EVA framework for the global investors.
The seemingly value destructive performance of the other companies under investigation, namely X5 Retail Group, Dixy Group and O’KEY could be attributed to different reasons. As reported above, X5 Retail Group is investing significant resources into the broadening of its network of stores. Our evaluation of such management strategy is positive, as pursuing it in the long run would allow them to rely on greater and stabler capital base. We could not justify O’KEY’s negative performance according to the EVA index with a specific strategy such as for X5 Retail Group. The company, according to the EVA index, is destroying wealth. Our suggestion would be to boost sales and simultaneously increase the efficiency of the operating activities because the related costs undermine the net operating profit.
Dixy Group is performing poorly with the exception of the year 2014. The company explains in its report that after a period of “wild opening” in order to expand its market share, it is now pursuing the strategy targeting the improvement of efficiency of the network and the enhancement of the service quality. In the last period, for instance, the Group had closed 89 stores and opened only 16, but the average selling space grew by 2%. We could conclude that on one hand the company improves operations’ efficiency, and on the other hand, enhances the shopping experience quality for its customers investing in marketing research and related activities. The pursuit of this strategy puts Dixy Group in a favorable position as far as investment attractiveness is concerned in the midium to long run.
Lenta is performing very well if we take into account the capital invested in fixed assets. In fact, the company owns approximately 82% of the real estate used in its operating and administrative activities. On the chart we observe positive performance during the years of 2013 and 2014. Since 2015, the company capitalized on investing in real estate. This strategy had decreased the value of the EVA indicator during the year 2015. But that does not necessarily mean that the shareholder value is undermined. The previous performance of the company has always been positive and the diminishing EVA could be attributed to the significant investment in real estate in order to have full control and higher potenial profit margins in the long run.
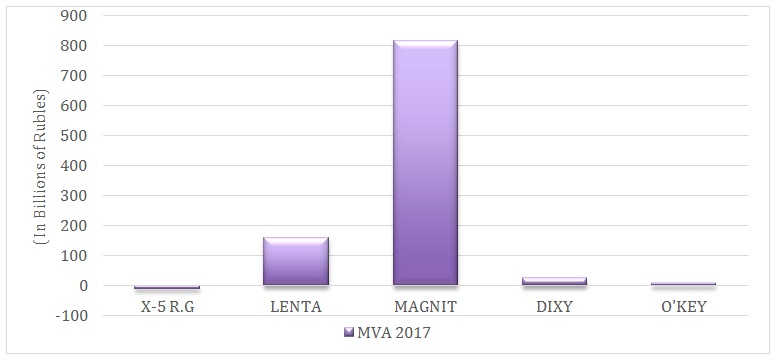
MVA Indicator
Figure 5 presents the results of the MVA calculations based on financial data for selected companies:
Figure 5: MVA for selected companies. (Calculated by author based on financial data of the selected companies)
From the data analyzed we conclude that X5 Retail Group has trouble creating positive value from the market. This is mainly due to the low short-term attractivness of the company under current situation according to our analysis. As was already mentioned, the X5 Retail Group is following the strategy aimed at expanding their market share. In order to reach that goal, they are heavily investing in fixed assets. We believe that this strategy would pay off especially if the the Group capitalizes on the franchising expansion model in order to leverage the investments in fixed assets and hence increase its income and investment attractivness in the mid to long run.
Lenta, O’KEY and the Dixy Group are performing positively meaning they are creating market value. Their performance, even though in the case of Dixy and O’Key Groups the results are insignificant, highlights superior managerial decisons. These companies are all in a somewhat similar situation in terms of their strategic goals, but just two of them are able to create significant market value: Lenta and Magnit. Magnit positions, thanks to their stability and to the efforts of the previous years, appear to be the most appealing from the investment stand point.
FCF indicator
Figure 6 presents the results of the FCF calculations based on financial data for selected
Figure 6: FCFs for selected companies. (Calculated by author based on financial data of the selected companies)
From the chart we could conclude that the cash flow and investment are very well managed by Magnit. The company’s management was focusing on the stable growth of the group since its inception, investing in the development of the network year after year. 2014 was the last year the company heavily invested in the network development and in the development of the logistics system. From 2015, the company relies on higher amount of cash that can be distributed to the investors or used for the development of new projects.
X5 Retail Group is following the strategy adopted in the past which aims at broadening and consolidating their network. In the last two years the Group had opened around 2000 new shops which have obviously negatively influenced the FCF figure. Lenta is in the similar situation as the X5 Retail Group. The aim is to strengthen the network and to capitalize on establishing efficient logistics. Dixy Group and O’KEY after a period of quick growth are now consolidating the market positions heavily investing in fixed assets. According to FCF the most attractive company is Magnit.
EBITDA MARGIN Indicator
Figure 7 presents the results of the FCF calculations based on financial data for selected companies:
Figure 7: EBITDA Margin (%) for selected companies. (Calculated by author based on financial data of the selected companies)
On the graph we can see how Lenta and Magnit Group are more efficient compared to the competitors and hence are able to create higher earnings (before interest, taxes, depreciation and amortization). The higher the EBITDA Margin, the smaller a company’s operating expenses in relation to total revenue, increasing its bottom line and leading to a more profitable operation. The higher the EBITDA Margin, the higher is the capital the company can use to cover other expenses, hence the higher the possible return for investors. According to this index, Lenta and Magnit are more attractive investments and X5 Retail Group, Dixy Group and O’KEY in our opinion should concentrate on cutting their operating expenses.
OIBDA Indicator
Figure 8 presents the results of the OIBDA indicator calculations based on financial data for selected companies:
Figure 8: OIBDA for selected companies. (Calculated by author based on financial data of the selected companies)
Unlike EBITDA, OIBDA does not incorporate non-operating income. Magnit is, as in accordance with the previous indicators, the best performer due to its stability, efficiency and market position. The X5 Retail Group is performing well also, displaying an upward trend in the operating income. Lenta is on the growth path, although concentrating more on operation income generating activities in order to ensure higher shareholder value. The Dixy Group and O’KEY on the contrary are performing still positively but rather poorly, displaying worse results in comparison with the previous years. Dixy Group and O’KEY have to follow the long-term strategy adopted by the management which in the future years would result in the growth of this indicator.
Comparative Benchmark Analysis
As the main benchmark for indicator evaluation, we chose the world’s largest and leading retail US based company “Walmart”, a recognized and successful VBM adopter (Walmart, 2017). For benchmarking purposes, all the indicators are split into three categories, corresponding to good performance, average performance, and below average respectively (please see Table. 1).
Table1: Comparative analysis of VBM indicators (Calculated by author based on Bloomberg, 2017, Damodaran, 2017, Morningstar, 2017, Reuters, 2017, Yahoo, 2017, selected companies financial data).
According to the matrix depicted in Table. 1, we could conclude that as far as the EBITDA MARGIN indicator is concerned, Lenta and Magnit appear to be quite successful VBM-adopters: the same is true for their OIBDA indicator performance and, to a lesser extent, to EVA evaluation. The MVA calculations look good for all the companies involved (except for X-5 Retail Group), while the FCF indicator shows that the Russian retailers still have room for improvement: except for a single year (2014) in X-5 Retail Group and Magnit performance, the overall performance seems to be below average, and we could state that VBM adoption should still be progressing, if we focus on FCF indicator. Thefore, according to our analysis if we were to rank the investment attractiveness of the global Russian grocery retailers based on adherence to value based management adoption our ranking is presented in Table 2.
Table 2: Company ranking based on VBM implementation and investment attractiveness determination model application (Calculated by author)
Summary
Our study investigates the effects of value-based management framework adoption in one of the most promising developing markets of Russia. The analytical framework is proposed based on the following VBM indicators: EVA, MVA, FCF, EDITDA MARGIN, OIBDA.
One of the most attractive sectors of the Russian economy is selected for the analysis: the retail grocery sector which displays stable growth and has significant growth potential. The top performing companies from this market are selected for the analysis.
We discuss implications of value-based management principles application and use the proposed framework to assess the investment attractiveness of the selected companies. The relevant ranking of the companies is presented with the justification to support the findings. In essence, based on our findings we advocate that deeper adherence to VBM principles leads to economic growth and greater investment attractiveness of the companies for potential investors.
References
Akalu, M. (2002) ‘Measuring and Ranking Value Drivers,’ Tinbergen Institution Discussion Paper, pp. 1-13.
Bloomberg, (2017), ”Bloomberg the Company & Its Products,’ Bloomberg. [Online],[Retrieved April 28, 2017], https://www.bloomberg.com/europe
CBR, (2017), ”The Central Bank of the Russian Federation,’ CRB. [Online], [Retrieved March 21, 2017], https://www.cbr.ru/eng/
Damodaran A., (2017), ”Cost of Capital by Sector (US)’. [Online], [Retrieved April 18, 2017], http://pages.stern.nyu.edu/~adamodar/New_Home_Page/datafile/wacc.htm
DIXY, (2017), ” Company Overview,’ DIXY. [Online], [Retrieved April 282017], http://www.dixygroup.com/who-we-are/company-overview.aspx?sc_lang=en
DIXY, (2016), ”DIXY group announces financial results for the full year of 2015,’ DIXY. [Online], [Retieved March 15, 2017], http://www.dixygroup.com/~/media/Files/D/Dixy/financial-results/2015/FY2015/DIXY%20GROUP_IFRS_FY2015_ENG.pdf
Estimating a synthetic rating and cost of debt, (2017) [Online], [Retrieved March 10, 2017], http://pages.stern.nyu.edu/~adamodar/New_Home_Page/valquestions/syntrating.htm
Investopedia, (2017), ”Market Value Added – MVA,’ Ivestopedia. [Online], [Retrieved March 17, 2017], http://www.investopedia.com/terms/m/mva.asp
Hundal, S. (2015) Economic Value Added (EVA), Agency Costs and Firm Performance : Theoretical Insights through the Value Based Management (VBM) Framework. Jyväskylä: Finnish Business Review.
Koller, T. (1994) What is Value-Based management? McKinsey Quarterly.
Koller, T., Goedhart, M. & Wessels, D. (2010). Valuation Measuring and Managing the Value of Companies (5th Edition). s.l.:McKinsey & Company.
Kostin, K., Adams, R., Samli, C. (2015), ‘Assessing business opportunities in BRIC countries,’ AIMS International Journal of Management (AIJM) 9 (3), 167-182.
Kostin, K., Denslow, D. (2015),’ Problems and prospects of small business development in the US and in Russia,’ AIMS International Journal of Management (AIJM) 9 (3), 183-200.
Lek, (2017), ”Identifying and Managing Key Value Drivers, L.E.K.,’ Lek. [Online], [Retrieved March 5, 2017], http://www.lek.com/sites/default/files/Volume_I_Issue_1.pdf
Lenta, (2017), “Lenta” for today – the most interesting active in commission, available for purchasing on mossburgh,’ Prime. [Online], [Retrieved March 30, 2017], http://1prime.ru/experts/20170217/827165307-print.html
Magnit, (2017), [Online], [Retived April 11, 2017], http://magnit-info.ru/en/about/today/
Morningstar, (2017), [Online], [Retived April 15, 2017], http://www.morningstar.com/
Sirbu, A., (2012). ‘Economic Value Added (EVA) approach in Russia. Concepts. Approaches. Instruments,’ Review of International Comparative Management, 13(2), 305 – 321.
Turner, R., (1998) ‘Projects for Shareholder Value: The Influence of Project Performance Parameters at different Financial Ratios,’ Project Management, 4(1), 70-74.
USDA Foreign Agricultural Service Report. (2013) Update of Food Processing Sector in Russia. Gain report number: RSATO1305.
Zhabin A.P., Kandrashina E.A. (2009) Value-based management in the practice of Russian management, paper for Vestnik Samara State University of Economics.