Volume 2020,
Article ID 148990,
Journal of Economics Studies and Research,
20 pages,
DOI: 10.5171/2020.148990
Received date: 7 May 2020; Accepted date: 3 August 2020; Published date: 7 October 2020
Academic Editor: Marioara Ilea
Cite this Article as:
Ewa Wiktoria Babuśka (2020), “ Some Aspects of The Polish Economy in Transition on the Basis of The Polish Oil and Gas Joint Stock Company", Journal of Economics Studies and Research, Vol. 2020 (2020), Article ID 148990, DOI: 10.5171/2020.148990
The purpose of this article is to present some aspects of the Polish economy in transition on the basis of a Polish Oil and Gas Joint Stock Company (Polskie Górnictwo Naftowe i Gazowe Spółka Akcyjna – the Polish abbreviation of the name is PGNiG SA). PGNiG SA is the largest company in Poland that deals with the exploration and production of natural gas and oil. It is one of the leading companies in the country’s fuel and gas industry and it is important for Poland’s energy security and the growing Polish economy. The novelty of the paper is an attempt to characterize the Polish economy during the ongoing systemic and economic transformation and to indicate that its development is possible due to the positive financial condition and dynamic operation of large business units. The article puts forward the thesis that the driving force behind the development of the Polish economy and its crucial catalysts are the strong enterprises, which are of strategic importance for the Polish State and with a large share of the State Treasury, such as the PGNiG SA. To verify the thesis, the financial situation of PGNiG SA was analyzed using the preliminary and indicator analysis of the financial statements for 2014-2018 period as a method. Oil and gas price trends affecting the company’s results and its investment projects were also presented. The financial situation and business activities of PGNiG SA have been assessed positively, so it was concluded that it is, and will be, a driving force of the Polish economy.
JEL classification: G30, G39, M41
Keywords: Polish economy in transition, energy security, financial statements, preliminary analysis and indicator analysis of financial statements, oil and natural gas.
Introduction
The Polish economy has been in a transitional period for 30 years. Recently, the Polish economy has been classified as one of the advanced economies. The strength and stability of a country’s economy depends on many factors. One of them is big and strong enterprises of strategic importance which constitute a driving force for the economy. The purpose of this article is to present some aspects of the Polish economy in transition on the basis of a Polish Oil and Gas Joint Stock Company. PGNiG SA is the largest company in Poland that deals with the production of oil and natural gas. The novelty of the paper is an attempt to characterize the Polish economy during the ongoing systemic and economic transformation, drawing the attention to the fact that the development of the Polish economy is possible due to the dynamic operation and good financial condition of large business entities. The article assumes that the driving force behind the development of the Polish economy and its vital catalysts are strong national enterprises of strategic significance. In Poland, PGNiG SA (with 71.9% of its shares owned by the Treasury) can be seen as a model example of such enterprises. The company operates in the oil and gas industry, and its mission is to ensure Poland’s energy security and diversify the sources of these raw materials supplies to prevent the country from overreliance on gas and oil supplies from only one source. The theoretical part devoted to the characteristics of the Polish transformation is based on a review of the subject’s literature. The empirical part, spanning the assessment of the company’s financial situation, is based on its financial statements and their analysis. In the retrospective research, the data from the financial statements of PGNiG SA for the 2014-2018 period has been gathered and analyzed. The 5-year period is sufficient to check how the structure of the company assets and liabilities has changed, how its revenues and costs differed in particular years and what directions cash flows had in the analyzed years. In order to compare between the financial data and to assess the state and the development activities of the company, both preliminary and ratio analyses of the financial statements were used as a method. The financial situation of PGNiG SA is also affected by economic and political factors, so the trends in oil and gas prices, and the investment projects extending the scope of its activities, as well as market reach were also analyzed. The motivation for writing this article was to emphasize the role of PGNiG SA in ensuring Poland’s energy security and to present the picture of the company’s financial situation as one of the important determinants of the development of the Polish economy. The article tackled this issue within the scope of the background of changes in the Polish economy to date and in terms of its future development. In short, the research background is the Polish economy in transition, while the research motivation is to indicate the possibility of developing this economy by maintaining large, domestic enterprises stimulating this economy as the property of the Polish state, and this is shown in the example of PGNiG SA.
The characteristics of the Polish economy in transition
The Polish economy has been undergoing a system transformation since 1989, moving from socialism to capitalism, from the so-called “planned” or “socialized economy” to the free market economy. The socialist system was imposed in Poland after the World War II, when the country was incorporated into the Eastern Bloc, dominated by the USSR. The transformation period has not ended yet and has brought not only all kinds of defects, mistakes, scandals and costs, but also numerous advantages and social, economic and political benefits. On 1st of May 2004, Poland joined the European Union in order to be able to act in the community of the European states and in the common European market, and to regain its due place in Europe, to which it has belonged for a thousand years. The accession was preceded by long-term pre-accession negotiations, and depended on Poland’s ability to meet numerous requirements. The EU was enlarged not only by Poland, but also by the Czech Republic, Hungary, Slovakia, Estonia, Lithuania, Latvia, Slovenia, Malta and Cyprus. Only the last three countries did not have the socialist economy. Among these countries, Poland is the largest. The 16th anniversary of Poland’s accession to the EU, which was celebrated in 2020, provides an opportunity for summarizing the costs and the benefits of this deed and for reflecting on the state of the Polish economy. However, this aspect, though largely determining the Polish economy, lies beyond the framework of this paper.
The problems of the Polish economic transformation have been analyzed by many Polish economists, and their evaluations have always differed significantly. The main authors who tackled this issue include, most of all, the transformation maker Balcerowicz (1992, 1997) and critics of the way it was introduced: Kołodko (1990, 1992, 1999, 2007) and Kowalik (1997, 2007). A critical evaluation of the transformation was also presented by Kieżun (2013), who pointed at a number of pathological phenomena in the Polish transformation. The above mentioned author believes that it was a mistake to open wide the borders for trade, especially for free imports as a way of fighting inflation, which, in the situation of great imbalance between the internal market and the global market, led to the bankruptcy of many domestic producers, to the liquidation of the Polish industry and to a quick growth of unemployment. It was also a mistake to leave the overwhelming majority of the domestic bank sector to the foreign capital. Jarmołowicz and Piątek (2013) presented theoretical foundations of the economic transformation and showed the course and the results of the shock therapy in the example of Poland. Another evaluation of the transformation, 25 years after its implementation, was presented by Gomułka (2016), who discussed the positive and negative effects of the transformation to the market economy. He stated that some popular and negative evaluations of the transformation simply contradict the facts. He also indicated the reforms and policies that are necessary for Poland to continue the process of catching up with the most advanced countries in order to bridge the civilization gap. In a wider context and a longer time horizon, the Polish economic system was described by Swadźba (2007, 2009, 2019).
The Polish economy was also analyzed by foreign authors. The work by Kiss, Danis and Cavusgil (2012) on international research on entrepreneurship in emerging markets shows that emerging economies comprise various countries in terms of geography and development levels. The research on entrepreneurship conducted in 51 emerging economies indicated that the most frequent ones were in China (23), Russia (14), Poland (11) and Taiwan (10). The greatest attention was paid to Europe and Central Asia, with the most frequent research being conducted in Russia, Poland and Hungary, then in East Asia and in the Pacific, where the research on China, Taiwan, South Korea and Singapore dominates. Additionally, the underground gas storage containers and their role in ensuring energy security were presented by Nagy and Siemek (2009). The influence of the liquefied natural gas terminal on the distribution network and gas bunkering in Poland was discussed by Chłopińska and Gucma (2018). The Polish gas market was compared to the European markets by Niewiński, Badyda and Kopałka (2017). Poland’s energy security and the opportunities, threats and the tasks it brings were analyzed by Czerniewicz (2015). The causes of the decreasing gas prices were discussed by Furman (2019). Also, the www.pgnig.pl website provides a lot of information on the gas market in Poland.
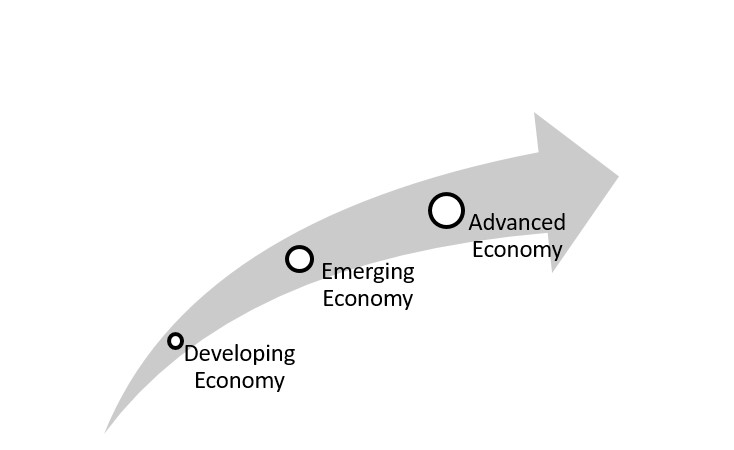
Over than 30 years after the political and economic transformation, the state of the Polish economy today can be evaluated through the following question: What type of economy can it be classified as: the developing economy, the emerging one or the advanced economy? The distinction of economies according to the state of economic development, whether it is an economy in the early stage of growth (developing), an economy at a higher stage of development, i.e. emerging (promising growth), or an already advanced economy (the highest degree of growth) is shown in Figure 1 below.
Figure 1: Division of economies according to the level of their development
Source: own elaboration.
In September 2018, the Polish economy was officially considered as an advanced economy in the FTSE Russell index (belonging to London Stock Exchange – LSE), where it was positioned on the 23rdplace. Along with obvious benefits, this situation may also bring some threats, since in the previous group of economies, Poland was the leader and now it is at the end of the list. In the author’s opinion, the advanced economy is the one in which there is a large share of processed products intended for the acquired markets. It is an economy that has something to export and the customers to buy it, and the Polish economy currently does not meet these requirements. This issue, however, remains open for discussion and is beyond the scope of this article. Since the Polish economy officially joined the group of advanced economies, it has been widely accepted that it can develop thanks to strong domestic enterprises of strategic importance. The paper adopted a thesis that the driving force behind the development of the Polish economy and its vital catalysts are big and strong national enterprises of strategic significance, such as companies from the “fuel and gas sector”, including PGNiG SA. This company should guarantee energy security of Poland, therefore its asset, financial situation and its financial results, which it published in its financial reports, as well as the prospects for its activities, shall be presented in this article as a justification of the proposed thesis.
Polish Oil and Gas Joint Stock Companyanalysis and assessment based on its financial statements and market data
Financial statements present the property and financial situation of the company and the financial result of its activities, which may be profit or loss. For this reason, they are the basis for control and analysis of company’s operations. Financial statements allow us to draw reliable conclusions about the company’s activities to date, assess its current activities and forecast its future. The purpose of financial statements is replicating the company’s overall financial standing in accordance with the overriding principle of providing a true and fair view. The goal of the general purpose financial reporting is formulated in the “Conceptual assumptions for financial reporting” and the goal of financial statements in IAS 1. The two sets of rules are about the usefulness of financial information, however the first of them indicates the usefulness of information for investors, lenders and other creditors (IFRS, 2016, par.C1, p.34), while the second for a wide range of users (IFRS, 2016, par. 9, p.844). Financial reports or the complete financial statements under IAS 1 create an internally coherent and logical whole, and contain: the balance sheet (statement of financial position), profit and loss account (statement of profit or loss and other comprehensive income), statement of changes in equity, cash flow statement and notes.
The statements are often described in the literature and in legal documents, and above all, in IFRS which are created to meet the global accounting standards (Tweedie, 2015, pp. 147-166). Financial reports are used to disclose the financial results from the company’s operations due to changes in the value of assets and equity. The reports are ordered sets of information about the entity and they are drawn up for a given period, especially annually, using the required formulas for description and presentation, and they are based on the accounting books. On top of the accounting records and cost accounting financial reporting is an integral part of accounting since financial reports are its final product. Each of these parts is important, but recently, financial reporting has gained importance as the information contained in financial statements is used by many users, mainly managers and investors, to make important economic decisions. The accounting discipline itself can be considered as theory (Hendriksen, van Breda, 2002, pp.37-44). According to Jaruga (1991, pp.12-13), accounting is now considered as social and applied science, i.e. it is not pure theory or art. The development of the financial accounting theory is presented by Jones (2015, pp. 1-11). Financial reports detail the entities’ operating results required to prepare them, their current standing and future prospects for a wide range of users (Brigham and Houston, 2015, p. 67).
In this part of the paper, following a brief description of the financial statements, the financial statements of PGNiG SA for the 2014-2018 period were analyzed. In order to conduct the preliminary analysis and the ratio analysis of the financial statements and to present the results of the research in a more convincing way, some tables containing appropriate reported data in PLN million and the calculated analytical ratios were made. Balance sheets (reports on the financial situation), profit and loss accounts and cash flow statements of PGNiG SA for the 5- year period were analyzed in particular. In this context, the following research detailed theses were adopted: 1) the political and economic activities of the European countries and the risk posed by oil and gas prices in the world have a significant influence on the company’s activities, 2) aiming at ensuring Poland’s energy security, PGNiG SA is involved in investment activities, thanks to which, it consolidates its position in the domestic market and implements the strategies of entering foreign markets. The proposed theses were positively verified on the basis of analyzing the changes in the prices of oil and natural gas in recent years, analyzing the financial indicators, examining the investment activity shown in the cash flow statements, and analyzing the current political and economic events.
Preliminary analysis of the financial statements of PGNiG SA for 2014-2018
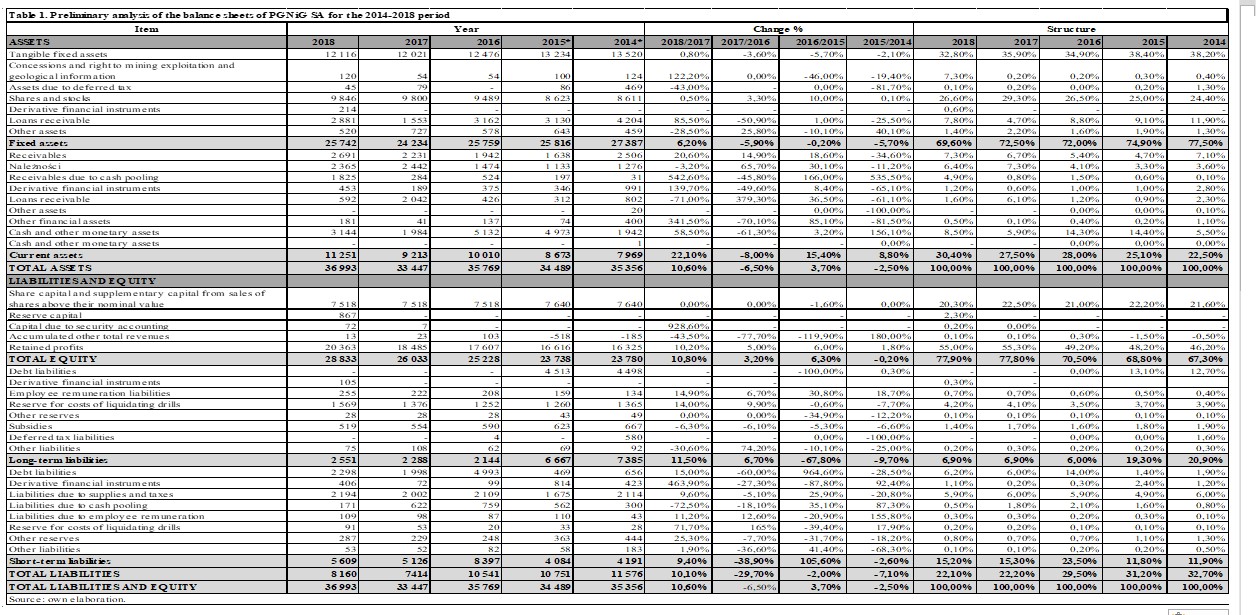
The three tables below (No 1, No 2 and No 3) contain PGNiG SA balance sheets, profit and loss accounts and cash flows in the 2014-2018 period. Table 1, presenting the preliminary analysis of assets and liabilities, shows that on 31st of December 2018, the balance amount was PLN 36,993 million, and was the highest in the analyzed period. It increased by 10.6% compared to the balance amount as of 31st of December 2017, which amounted to PLN 33,447 million and was the lowest in the analyzed period. The amount from 2017 was 6.5% lower than that at the end of 2016, reaching PLN 35,769 million, and 3.7% higher than the balance amount at the end of 2015, which was PLN 34,489 million. The balance total sum from 2015, on the other hand, was 2.5% lower than the amount of PLN 35,356 million recorded at the end of 2014. The PGNiG SA assets oscillate around PLN 35 billion. The fluctuations observed in the sum of assets and liabilities were not high. Fixed assets of the balance sheet account represented, on average, 70% of the balance sum, whereas the current assets – 30%. The sum of fixed assets in 2018 was PLN 25,742 million, and compared to 2017, it grew by 6.2%, whereas in previous years, there had been some decreases. The biggest share of fixed assets in 2018 (just like in previous years) was occupied by tangible fixed assets, interests and shares, as well as loans granted. The current assets in 2018 accounted for 30.4% of the balance sum (in 2017: 27.5%, in 2016: 28.0%, in 2015: 25.1%, in 2014: 22.8%). The current assets value grew from PLN 7,969 million in 2014 to PLN 11,251 million in 2018, which constitutes a 41% rise. The biggest share in the current assets in 2018 was occupied by cash and other monetary assets (8.5%), stocks (7.30%), receivables (6.40%), and cash pooling (4.90%). The granted loans, derivative finance instruments and other financial assets had a relatively small share in the asset structure. In 2018, the liabilities structure was composed of 78% by own capital, 8% – long-term liabilities and 15% – short-term liabilities. The share capital grew from PLN 23,780 million in 2014 to PLN 28,833 million in 2018, which constituted a 21% growth. The own capital is composed of share capital and reserve capital from sales of shares above their nominal value and in the overwhelming part – retained profits.
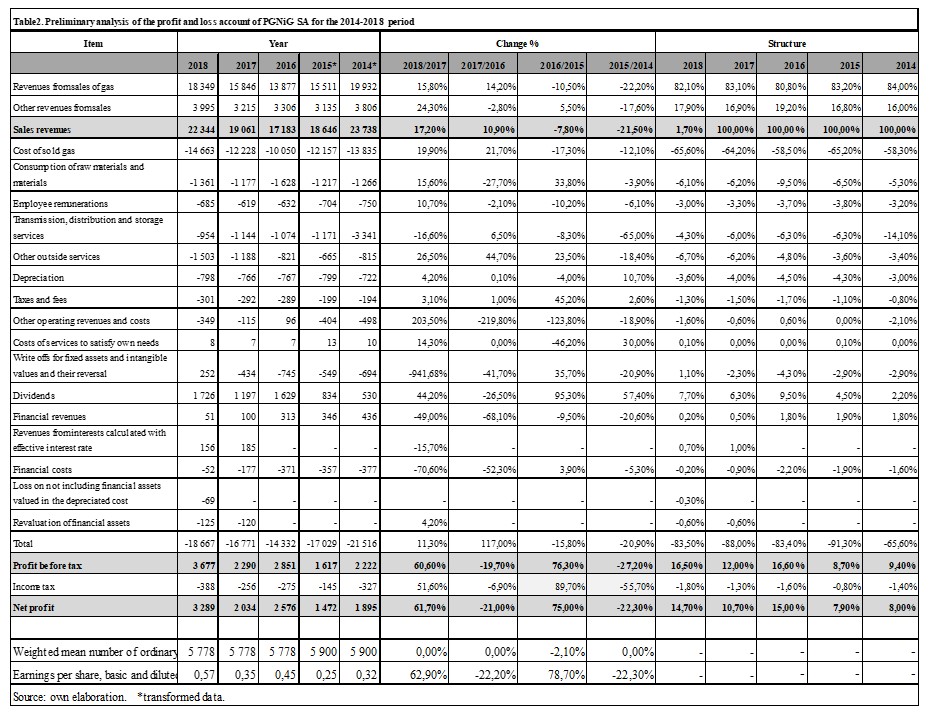
Table 2 presents the preliminary analysis of the profit and loss account in PGNiG SA for the 2014-2018 period. It can be seen that the company presents the profit and loss account in the comparative variant. As for the sales revenues, it distinguishes between revenues from sales of gas and other revenues. Other operating revenues and costs, as well as financial revenues and costs are presented in one column, without marking these groups. In the whole analyzed period, regarding the company’s net profit, the biggest one was PLN 3,289 million in 2018, then PLN 2,576 million in 2017, and the lowest one PLN 1,472 million – a year earlier. Revenues from sales from 2014 to 2016 showed a downward trend, same for costs by nature and total costs, other operating revenues and costs, as well as financial revenues and costs. Sales revenues decreased by 7.8% in 2016 compared to 2015, whereas in the 2015 compared to 2014 by 21.5%. 2017 marked the increase in the revenues from sales by 10.9% compared to 2016, and in 2018 by 17.2% compared to 2017. In 2018, revenues from sales amounted to PLN 22.344 million, but did not reach the level of 2014 PLN 23,738 million.
The revenue structure is dominated by the revenues from sales of gas, accounting for over 80% in all the analyzed years (the lowest ratio – 80.8% was in 2016, the highest – 84% in 2014). The highest revenues from sales of gas, PLN 18,349 million, were recorded in 2018, including methane-rich gas – PLN 17,067 million. In 2016, PGNiG SA started selling this gas outside Poland, therefore revenues from such sales grew significantly. The second strategic product is nitrogen-rich gas, with its sales in 2018 amounting to PLN 1,396 million. The revenues from sales of other services, products, goods and materials in the analyzed years did not reach 20%; in 2018, they accounted for 17.9% of all the revenues. The biggest revenues in this group are obtained by the company from the sale of electric energy and crude oil with gasoline and the right to use the storing installations. Other services include sales of gas, maintenance, transport, geology, mining services and renting real estate properties. The most important cost item is the cost of the sold gas, which covers the cost related to the purchase of gas from domestic and foreign sources, together with a justified part costs of system and transaction fees, and costs of extraction from domestic sources and costs of nitrogen removal. The cost of the sold gas reveals a strong correlation with the revenues from the sales of gas and, analogically, it fell in 2015-2016, only to increase in 2017-2018. The share of this cost in the revenues from the sales of gas was: 69.4% in 2014, 78.4% in 2015, 72.4% in 2016, 77.2% in 2017 and 79.9% in 2018. The second biggest cost item is the consumption of other raw materials and materials. These are mostly costs of energy used for trading purposes, and also other materials. These costs were kept on a similar level in 2014-2015, but grew significantly in 2016 (by 33.8% compared to 2015), whereas their growth in 2017-2018 amounted to 27.7%, and in the 2017-2018 period 15.6%. On the other hand, the costs of transmission, distribution and storing services, which decreased significantly from PLN 3,341 million in 2015 to PLN 1,171 million in 2014 (by 65%) in the next years oscillated around PLN 1 billion. The costs of other outside services are, most of all, costs of re-gasification, costs of written off negative drills, costs of other geological, search, renovation and exploitation services, etc. The company also obtained high revenues from dividends from affiliated entities.
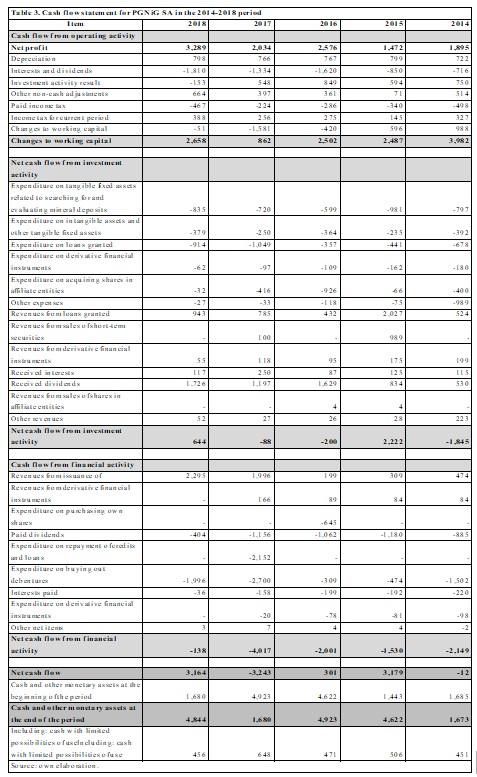
Table 3 presents the cash flows in PGNiG SA in the 2014-2018 period. The company makes the report on cash flows using the direct method. In all the analyzed years, the net profit was shown. This profit was corrected in cash flows from the operating activity with standard corrections. The flows from the company’s operating activity were positive each year. They were mostly affected, apart from the financial result, by interests and dividends. Other important items also included: results of the investment activity and depreciation. The financial result in operating activity flows in 2018, was corrected by –PLN 601 million, in 2017 by –PLN1,172 million, in 2016 by –PLN74 million, in 2015 by –PLN1,015 million and in 2014 by –PLN2,087 million. The positive cash flows from the operating activity must be interpreted positively, especially as PGNiG SA has an established position in the market and has been a major player in this market for many years. Positive flows from the operating activity occur in all the analyzed years, so there are no claims that the company ever had, even temporarily, financial problems. The cash flows from the investment activity were positive in 2018 and 2015, and negative in 2017, 2016 and 2014. In 2018, the balance was PLN 644 million. The biggest revenues came from the dividends from affiliate entities (PLN 1,726 million) and from given loans (PLN 943 million). The biggest expenditure was incurred not only for giving loans (–PLN 914 million) and for tangible fixed assets related to seeking and evaluating mineral deposits (–PLN 835 million), but also for intangibles and other fixed assets (–PLN 379 million). The net cash flows from the financial activity in all the analyzed years were negative, however, in 2018, they amounted to only –PLN 138 million, whereas in 2017, they were –PLN 4,017 million, in 2017 –PLN 2,001 million, in 2015 –PLN 1,530 million and in 2014 –PLN 2,149 million. This type of flows is mostly affected by the dividend, which was paid out in each analyzed year. The total net cash flows should also be evaluated as beneficial. In 2018, 2016 and 2015, they were positive, whereas in 2017 and 2014, they were negative. The highest positive flows – exceeding PLN 3 billion – were reported in 2015 and 2018. The negative flows in 2017 represent the lowest in the whole analyzed period. They affected by the lowest positive flows from the operating activity (PLN 862 million) and the highest negative flows from the financial activity in the whole period (–PLN 4,017 million due to the repayment of credits and loans in the amount of PLN 2,152 million). In 2014, the total net cash flow was –PLN 12 million. However, taking into account the high flows from the operating activity and the expenditure on investment and the fact that a significant item then was the expenditure on buying out debentures, the negative net cash flows in 2014 definitely do not reveal the bad situation of the company. Moreover, in each year, the company obtained a positive financial result. This is a very beneficial situation, taking into account positive cash flows from the operating activity in all the analyzed years. This means that the company is profitable in conducting its core operating activity, and also obtains profit, taking into account all the investments, as well as expenditures and revenues from the financial activity.
Ratio analysis of PGNiG SA’s financial statements for 2014-2018
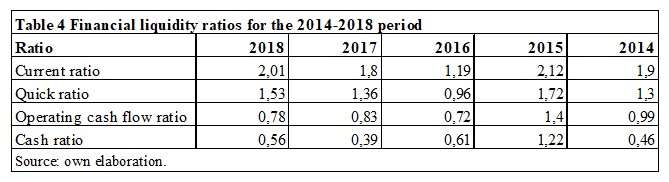
The tables below present the most important financial indicators, divided into groups of liquidity, profitability, activity and financial support ratios, calculated for PGNiG for the 2014-2018 period. Table 4 presents the financial liquidity ratios of PGNiG for the 2014-2018 period.
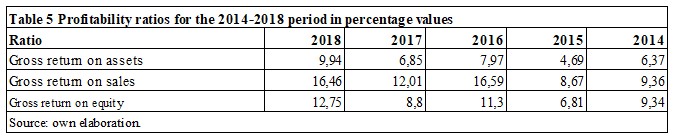
In 2016, all liquidity ratios had lower values, but in 2017 and 2018, they increased, with the exception of cash ratio. 2015 was an exception in the analyzed years, since all ratios had the highest values, and a significant improvement of the financial liquidity was noticeable in that year. High ratios in 2015 were caused by a big growth of cash and other monetary assets – by 156.1% compared to the previous year. This is particularly visible in the cash ratio, which takes into account only the cash item from all the current assets. In 2016, the cash ratio returned to its level from 2014 due to increased short-term liabilities. In 2015, the liquidity ratios could even be higher, however, in current assets, the decline in the value of stocks, receivables, derivative financial instruments and granted loans was observed. Simultaneously, the value of short-term liabilities did not change significantly and the decreases in some items were compensated with increases in other items. High ratios in 2015 may imply insufficient use of cash and other short-term investments. Inappropriate management of cash may particularly be indicated by very high cash liquidity in 2015. In 2018, 2017, 2015 and 2014, the current ratio was on the acceptable level, ranging from 1.5 to 2.0. In 2016, it was lower and reached 1.19, which could imply insufficient liquidity of 3rd degree, however, it was due to the changes in the classification of liabilities due to received loans. The quick and the operating cash flow ratio in 2014, 2016, 2017 and 2018 (with the exception of the quick ratio) was nearly on the model level, close to 1.0. Table 5 presents the profitability ratios obtained by PGNiG SA in the 2014-2018 period.
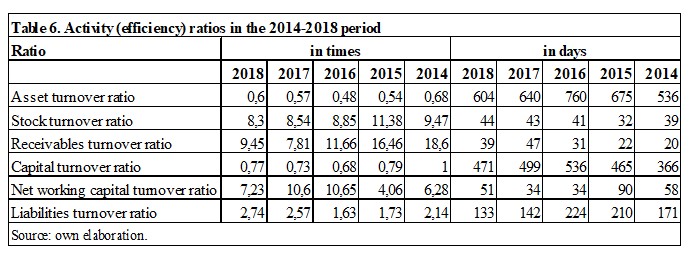
In order to calculate the profitability ratios, the gross financial result was used, since it is deprived of tax burdens and thus can give a more reliable picture of the company’s financial situation. All profitability ratios in Table 5 are positive due to the fact that the company always had profit. The gross return on assets fluctuates from 4.69% in 2015 to 9.94% in 2018. Its average value was 7.2% in the analyzed 5 years. The value of the ratio in 2018 means that from one Polish zloty of the assets, PLN 0.0994 of the gross financial result was generated. It is advantageous that the ratio grew in 2018 compared to the previous year, and less advantageous that it fell in 2015 compared to 2014. The value of the return on assets ratio depends mostly on the profit generated by the company due to the fact that in all the years, the value of assets remained on a similar level and the fluctuations between particular years were not too big. Analogically, as for the return on assets ratio, the profit increased in 2018 and 2016, and it decreased in 2015 compared to previous years. The growth of the return on assets ratio in 2018 must be evaluated positively. The gross return on sales was fluctuating and reached the value of 9.36% in 2014, 8.67% in 2015, 12.01% in 2017, 16.59% in 2016 and 16.46% in 2018. The change between 2014 and 2015 was negligible – the value of the ratio depends directly on the revenues from sales, which in 2015, fell by 21.5%. A significant change was brought about in 2016 compared to 2015, when the ratio nearly doubled. This is caused by a slight decline of the revenues from sales and a very large increase of the financial result. Revenues from sales fell by 7.8% in 2016, whereas the financial result grew by as much as 76.3%. The growth was caused by considerably lower costs of the gas sold and the transfer, distribution and storage services. What is more, in 2016, the company received a very high dividend from affiliate entities (PLN 1,629 million, compared to PLN 834 million in 2015). The decrease of the revenues and the growth of the result significantly increased the return on sales ratio, which should be evaluated positively, but the essential influence of the value of the received dividend on the ratio cannot be ommited. The significant growth of the dividend may result from the good management of the company and the successful investment in affiliate entities as well as a good economic cycle in the industry. 2018 witnessed a growth of both revenues from sales (by 17.2%) and the gross profit (by 60.6%), whereas in 2017, the revenues grew by 10.9% and the profit fell by 19.7%. In this situation, the gross return on sales ratio in 2018 was 16.46% and in 2017 – 12.01%. The return on equity ratio had the highest value in 2018 and amounted to 12.75%, whereas in 2017, it was on the lowest level – 8.8%. In 2016, it was 11.30%, a year earlier 6.81%, whereas in 2014, it was 9.34%. The changes in the values in 2014 and 2015 were very small, so this ratio for the given years depends directly on the financial result. In the next years, own capital grew and the profitability ratio was expected to fall, but the growth of the financial result in 2016 and 2018 was big enough to enable the ratio to grow in these years, analogically to the return on sales ratio. The comparison of the liquidity ratios and the profitability ratios confirms the antinomy between these ratios, which is best seen in the figures for 2015, when the liquidity ratios reached the peak values and the profitability ratios hit the all time bottom. Table 6 shows the activity (efficiency) ratios that PGNiG SA had in the 2014-2018 period.
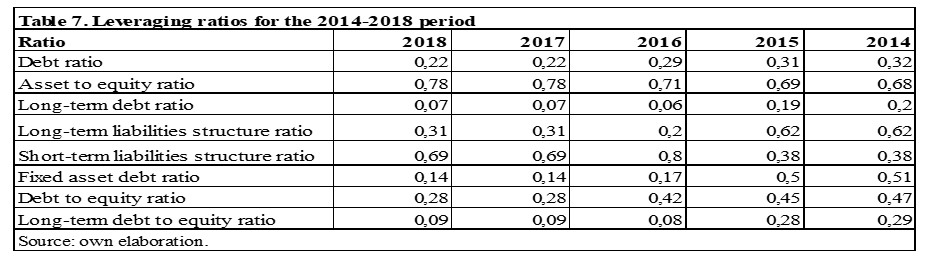
The asset turnover ratio calculated in times decreased from 0.68 in 2014 to 0.60 in 2018, while the ratio in days grew from 536 days in 2014 to 604 days in 2018. The values of the ratios in the analyzed years indicate that less and less revenues from sales were obtained from the possessed assets. Since the value of the assets did not change significantly, the ratio was mainly affected by revenues from sales. The asset turnover ratio cannot be evaluated positively. The stock turnover ratio in times reached the lowest value in 2018, and also lower values in 2017 and 2016, while the peak value was obtained in 2015, and a relatively higher value was achieved in 2014. The ratio in days had the opposite values. The lower values of the ratio in times and the higher ones in days point at the higher degree of freezing stocks in the company. The decline of the ratio in times and the growth of the ratio in days were caused by both lower revenues and increased stocks in 2016-2018. In 2015, the company enjoyed a relatively short period of stock turnover, which was a beneficial situation. The receivables turnover ratio in times was falling: from 18.60 in 2014 to 11.66 in 2016, 9.45 in 2018 and 7.81 in 2017. However, the receivables turnover ratio in days was increasing. The lower values of the turnover ratio for 2016-2018 might indicate lower effectiveness in collecting receivables. Due to this fact, it would be advisable to analyze the age structure of the receivables for deliveries and services as well as the allowance for bad debts. For example, the total value of overdue receivables in 2016 decreased by PLN 8 million, whereas the value of the receivables that are over than 3 months overdue increased by PLN 14 million. The allowance for bad debts decreased from PLN 319 million in 2015 to PLN 309 million in 2016 that is by PLN 10 million. Compared to the company’s revenues from sales in these years, the amounts of overdue receivables and the changes in the allowance for bad debts do not have much influence on the company’s result and financial liquidity. Therefore, the trend shown by both ratios should not be evaluated as very unfavorable. The equity turnover ratio decreased its value in the analyzed period from 1.00 in 2014 to 0.68 in 2016. It also had lower values in 2015 and 2017-2018. As in the case of the asset turnover ratio, the value of this ratio was affected by the decreasing revenues from sales. Additionally, in 2016, its decline was affected by the equity growth of 6.3%. The declining value of the equity turnover ratio means that capital is not used as efficiently as it could. The net working capital turnover ratio had the lowest value in 2015, then grew significantly in 2016 and maintained its value in 2017. This was affected by the decrease of the net working capital related to the growth of short-term liabilities in 2016, caused by the changes in the classification of debt liabilities. The lower efficiency may also be confirmed by the growth of the liabilities turnover ratio in days from 2014 to 2016, which accounts for a bigger number of days after which liabilities are paid. 2017 and 2018 witnessed some improvement of this ratio. The management efficiency ratios in 2014-2018 depended mostly on revenues from sales, which had been falling from 2014 to 2016 and then grew in 2017 and 2018. The fall in revenues accompanied by a slight change of balance sheet items may indicate lower efficiency of operations. This is a vital issue and the board of the company must take it into consideration in the next years of its activity. Table 7 presents leveraging ratios of PGNiG SA for the 2014-2018 period.
The debt ratio had similar values: 0.32; 0.31; 0.29, respectively in 2014, 2015 and 2016. In 2017-2018, the value of the ratio fell to 0.22, which was due to the repayment of credits in loans in the amount of PLN 2,152 million in 2017. The ratio is not high – it is lower than the asset to equity ratio, which means that the company is only slightly dependent on external financing. The advantage of the asset to equity ratio over the debt ratio must be evaluated positively. The company enjoys greater financial independence, since the assets are covered by the equity rather than by external capital (liabilities). The long-term debt ratio had been decreasing since 2014. According to the model interpretation, it should slightly differ from the total debt ratio. In 2016-2018, the difference between these two indicators, however, was quite significant, which means that the company was focusing on short-term liabilities. This results in greater maturity of liabilities up to 12 months. The debt structure ratio did not change in 2014 and 2015, but it transformed in 2016, maintaining the advantage of short-term liabilities over long-term ones in 2017-2018. This transformation was caused mainly by the change in the classification of debt due to the obtained loan, which was paid back in 2017. In the note to the single financial report for 2016 “Events after the date of the balance sheet”, the company informed that it paid the loan of EUR 500 million given to it by PGNiG Finance AB on time. This means that the sudden growth of the short-term liabilities structure ratio does not reveal the bad situation of the company. Moreover, the lack of significant changes and the advantage of long-term liabilities over short-term ones in total liabilities in 2014 and 2015 should be positively viewed. The fixed assets debt ratio was maintained on a similar level in 2015 and 2016, and then it fell in 2016 due to the loan liabilities described above. In 2017 and 2018, it experienced further decrease. It never exceeded the level of 1, which indicates the lack of significant threats to the long-term financial security of the company. The debt to equity ratio decreased from 0.47 in 2014 to 0.42 in 2016, and the long-term debt to equity ratio fell from 0.29 to 0.08 in the same period. In 2017 and 2018, these ratios amounted to, respectively, 0.28 and 0.09. Such ratios show that the company is not much burdened with liabilities and long-term liabilities. Moreover, own capital exceeds the total liabilities and long-term liabilities and has the value below 1, which must be clearly evaluated positively.
Economic and political factors
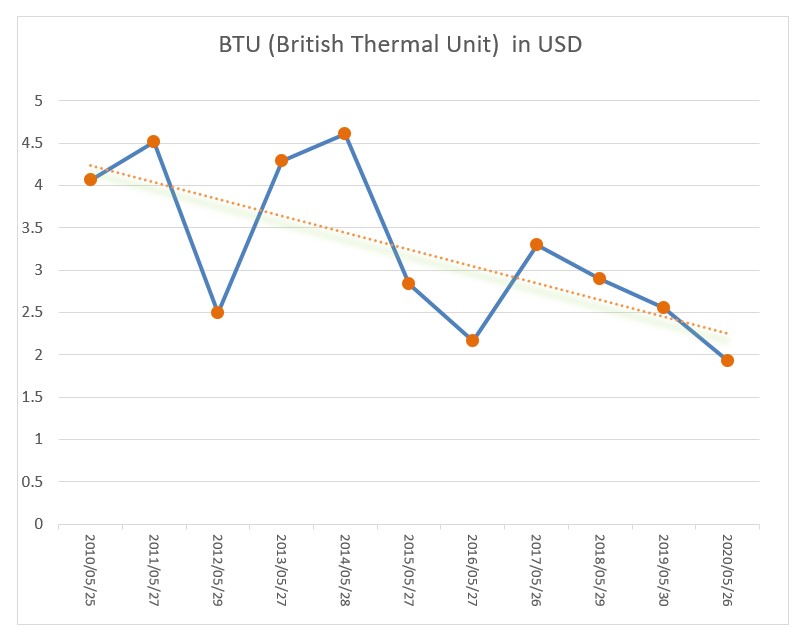
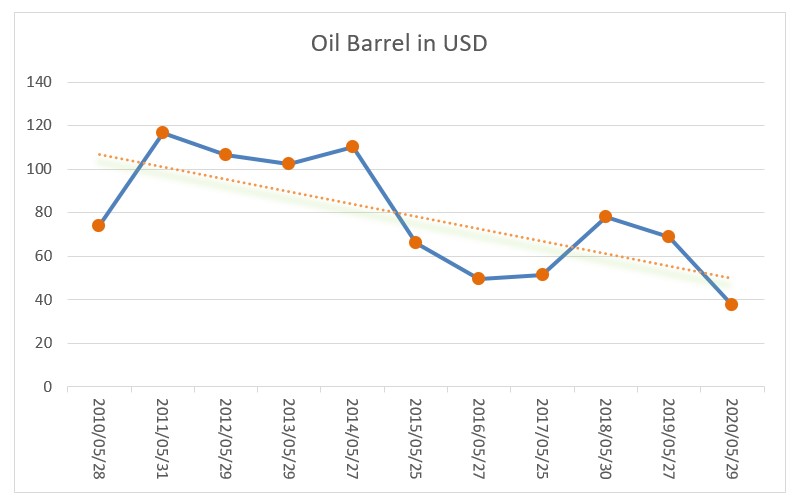
The financial situation of PGNiG SA is also affected by economic and political factors. There is no doubt that such a large company is susceptible to external risks, which may appear in the next years and which cannot be identified directly from financial reports. Such risks may significantly affect the financial and asset situation of the company. The financial situation of PGNiG SA may largely depend on trends on the natural gas and crude oil markets. Figures 2 and 3 show the prices of natural gas and Brent crude oil. High fluctuations of rates can be observed over the past ten years 2010-2020, but there is a clear downward trend. Comparing May 2010 to May 2020, the price of natural gas fell by 52,58%, whereas the price of crude oil – by 49,03%. The two figures show heavy dependence of PGNiG SA on changing the prices in raw material markets. The most profitable segment of the activity is trading and storing (82% of total revenues from sales). As seen from the financial report data, revenues from sales are decreasing and the volume of natural gas sales is growing – this clearly confirms the influence of prices on the natural gas market. In conclusion, it can be said that the financial situation of the company depends heavily on the prices of natural gas in global markets.
Figure 2: The price of natural gas in USD/million BTU
Source: own elaboration.
Figure 3: The price of Brent crude oil in USD/barrel
Source: own elaboration.
PGNiG SA is a strategic company belonging to the Treasury and the most important company for the energy security of Poland. The Yamal-Europe pipeline, connecting Europe and the Russian Yamal peninsula, where natural gas deposits are located, goes through Poland. PGNiG owns 48% shares in the company, which owns EuRoPol GAZ S.A. pipeline. The same percentage of shares is owned by the Russian state concern excavating natural gas – Gazprom. This means that PGNiG must cooperate with the Russian enterprise. The construction of the Nord Stream 2 pipeline constitutes a major threat to the company. In 2010, the Nord Stream pipeline was opened, connecting Russia and Germany. It omits Poland, going straight through the Baltic Sea. Even that pipeline accounts for the deterioration of the energy security of Poland. Poland must obtain hydrocarbons in the East since its own supplies are not sufficient (Czerniewicz, 2015). The agreement, thanks to which the construction of Nord Stream 2 was to start, was signed in 2015. The construction was objected by the Polish Office of Competition and Consumer Protection in 2016. However, this did not stop the plans of building another line of the pipeline. Nord Stream 2 was to be put into use at the end of 2019, but its construction has not yet been completed and is being prolonged due to many reasons, including political ones. The Nord Stream 2 gas pipeline may pose a significant threat to PGNiG SA, which wants to diversify its sources of gas and oil supplies not only from the east but also from other directions, including the north and west. Focusing on one source of supply of such important raw materials as crude oil and natural gas is not desirable by PGNiG SA, as it may cause economic dependence. The goal of this company is to obtain supplies of raw materials from various sources. Lower diversification of the sources of supplies by concentrating on one supplier may lead not only to economic overdependence, but also to political one. It is important, therefore, to keep the gas bunkers full – in Poland at the end of 2016, the level of gas filling was 77%, whereas the European average was 66% (The Report of the Board of PGNiG S.A. and GK PGNiG S.A. for 2016). PGNiG SA faces a daunting challenge of maintaining gas supplies, becoming the company which does not pursue the financial result growth, but which ensures energy security for Poland.
The construction of another line of the Nord Stream pipeline should provide the company with some impetus to make new investments and, as a result, to become more independent with external supplies. Due to natural reasons, which are beyond the control of PGNiG, it is practically impossible to increase production in the domestic market. It is hard to expect the discovery of new gas deposits, but the works on the already developed deposits can be expanded. A good solution here could be to develop production in other countries. The PGNiG Capital Group invests in deposits in other countries, namely in Norway, Pakistan, Libya, Germany and Iran. It also conducts seismic work in some European and African countries. The investment expenditure in the search and excavation segment in Poland in 2016 amounted to PLN 830 million, whereas projects implemented in Norway cost PLN 343 million. The shares in search and excavation concessions in the Norwegian Sea, the Northern Sea and the Barents Sea are owned by PGNiG Upstream International, which is 100% owned by PGNiG. In the context of the efforts made to become independent from external sources of supplies, investments in deposits in Poland and Norway must be evaluated positively.
Conclusions
Based on the review of PGNiG SA’s financial statements for the 2014-2018 period, the financial situation of the company was evaluated as positive, the company assets have been increasing, reaching now the value of PLN 36,993 million. In all the analyzed years, the company generated net profit – the highest in 2018 – PLN 3,289 million. In each analyzed year, the company achieved substantial positive flows from its operational activity, which confirms its good financial standing. In 2018, the net cash flow was positive and amounted to PLN 3,164 million, of which the flow from the operational activity was PLN 2,658 million and from investment activity – PLN 644 million, compared to the negative flow from the financial activity – minus 138 million. Such relations between the flow directions in particular types of activity indicate the mature stage of the company operations and the assessment of its situation caused by cash flow. The earned profits and the means from positive cash flows are allocated by the company for investment and for payments of the dividend to its shareholders. The financial indicators are generally correct, the solvency ratios demonstrate that the company is able to pay its current liabilities. The paper also examines how the price of natural gas in the markets accounted for the decreasing revenues from sales in 2014-2016. This only confirms the significant influence of market prices of gas on revenues from sales and the serious risk over which the company, unfortunately, has no influence. Nevertheless, since 2017, the revenues from gas sales have been growing, and in 2018, they amounted to PLN 18,349 million.
To conclude, the financial situation of PGNiG SA can be evaluated positively. PGNiG SA is a strategic company owned by the Treasury and has the greatest influence on the energy security of Poland. The completion of the Nord Stream pipeline and the plans to build the second line – the Nord Stream 2, encourage the board to invest – not only in utilizing the deposits in Poland, but most of all – abroad. The aim of the company should not be only to obtain profits and positive cash flows, which was accomplished in the analyzed years, but most of all to ensure the energy security of Poland. The investment in Norwegian fields should be assessed positively, especially in the context of ensuring the diversification of supplies from various sources. Also, the talks with Norway and Denmark concerning the construction of the Baltic Pipe must be seen as a positive aspect. The pipeline will allow the company to transport gas directly from the deposits of the Norwegian continental shelf (where PGNiG has obtained concessions for exploitation) to Poland. Thanks to this, Poland will not be dependent on supplies from only one eastern direction, which should lead, among others, to greater competition in the European market, and thus to cheaper gas for domestic customers. Therefore, it is necessary to conduct investment activities aimed at building the Baltic Pipe and to monitor the construction of Nord Stream 2 continuously.
To conclude, Poland lies in the middle of Europe, so a strong Polish state and its stable and dynamically developing economy can guarantee the strength and development of other European countries and the whole of Europe. However, it should be also noted that in the current situation of the announced Covid-19 pandemic, the Polish economy has slowed down a bit, like other world economies, and has to make up for losses and meet new challenges in order to return to its normal state and pace of development. Recently, the Polish government is considering the possibility of merging three large domestic companies from the fuel and gas industry, namely: Polish Oil Concern “Orlen” SA (PKN Orlen SA), Lotos Group SA and PGNiG SA. These companies are of strategic importance for the Polish economy. PKN “Orlen” is a leading petrochemical company in the Polish market. It has refineries in Płock, Jedlicze, Trzebinia and abroad in the Czech Republic and in Mazeikiu in Lithuania. The Lotos Group is the second largest petroleum consortium in Poland engaged in the exploration and production of crude oil, its processing as well as wholesale and retail sale of high-quality petroleum products. Lotos consists of over a dozen companies and has over 30 percent share in the wholesale fuel market and almost 10 percent in the retail market. The creation of a single strong domestic entity is to help protect the companies from acquisition attempts, strengthen their competitiveness in international markets and be more active in searching for gas deposits. According to the President of PGNiG, the project of consolidation of Orlen with Lotos and PGNiG results from the growing position of Poland in Europe and the world and the need to create strong companies that will face the international competition. Poland should consolidate its fuel and gas sector in the model of European big consortia such as British BP, Dutch Shell or Italian ENI. The consolidation of the three above-mentioned companies is to guarantee the creation of one powerful, multi-energy consortium in Poland, which must be present not only in the energy market, but also in the alternative fuels market. This is the direction of PGNiG’s strategy, which is now being adapted to the current needs of the situation in Poland and Europe. This is primarily about the market of new alternative fuels, not only the development of CNG and LNG, i.e. the development of compressed and liquid natural gas, but also to enter the biomethane market very strongly, to enter the market of hydrogen technologies and, in general, to start operations in the field of renewable energy sources. Poland and PGNiG are also to have a stronger presence in international markets in the area of exploration and production.
The limitation of this paper lies in focusing the whole research only on one Polish company PGNiG SA. However, it is now a leading company in the entire fuel and gas sector in Poland, therefore its financial situation and plans for the future have been described in detail. Using the preliminary and index analysis of PGNiG SA’s financial statements for 2014-2018, the thesis that strong enterprises can be the driving force behind the development of the Polish economy was positively verified.
Notes
The Advanced Economy: The division of economies into developing, emerging and advanced economies was applied inter alia by Colwell and Narayanan (2010) in the model of conditional entrepreneurship policy. For each of the distinguished economies, they proposed a transformation policy and a policy of improvement and described activities for implementing these policies. Botev, Égert and Jawadi (2019) also use this division of economies in their paper.
The 23rdplace: FTSE Russell stated that the index of advanced markets includes 37 Polish companies. PKO Bank Polski is in the group of large companies. Medium companies include: PKN Orlen, Grupa Lotos, PGE, PGNiG, KGHM Polska, Bank Pekao, PZU, BZ WBK, mBank, LPP, Dino Polska, CD Projekt, Cyfrowy Polsat. The small companies include: Bank Millennium, AmRest Holdings, Bank Handlowy. JSW, Alior Bank, CCC, Play Communications, Orange Polska, Grupa Azoty, Enea, Tauron Polska Energia, Kernel Holding, Kruk, Asseco Poland, Budimex, Eurocash, Ciech, Energa, PKP Cargo, Lubelski Węgiel Bogdanka, GPW, Boryszew, Neuca. Poland had waited for this promotion since 2011. This is the result of the continuous growth of the capital market in the country and the constant growth of the GDP. Thanks to it, Poland has become the biggest economy in Central and Eastern Europe and the only economy in the region classified as an advanced market (2018). https://www.money.pl/gospodarka/wiadomosci/artykul/dolaczylismy-do-elitarnego-grona-polska,23,0,2416663. html) access on: 23.07.2020.
Costs of Re-Gasification: The appearance of the re-gasification costs in 2016 was associated with the opening of the LNG terminal in Świnoujście and the contract concluded with Polska LNG SA, valid until 2034, according to which, PGNiG undertakes to restore the gas from the liquefied to the gas form.
The Direct Method: Cash and other monetary assets shown by PGNiG in the report on the cash flow at the beginning of the period differ from the balance of cash and monetary assets at the end of the previous period. There is also a difference between the state of the funds shown in the report on cash flow and the balance of the funds in the report on the financial situation. The difference is attributed to the contract signed in 2014 on managing cash inside the group (the cash pooling contract).
Accounting Act of September 29, 1994, consolidated text Journal of Laws of 2019, item 351, 1495, 1571, 1655, 1680, of 2020, item 568, as amended.
Balcerowicz, L. (1992), 800 dni. Szok kontrolowany, Polska Oficyna Wydawnicza „BGW”, Warszawa, 1-334.
Balcerowicz, L. (1997), Socjalizm, kapitalizm, transformacja szkice z przełomu epok, Wydawnictwo Naukowe PWN, Warszawa, 1-352.
Botev, J., Égert, B. Javadi, F. (2019), The nonlinear relationship between economic growth and financial development: Evidence from developing, emerging and advanced economies, International Economics 160, 3-13.
Chłopińska, E., Gucma, M. (2018) ‘The Impact Of A Liquefied Natural Gas Terminal On The Gas Distribution And Bunkering Network In Poland,’ Scientific Journals of the Maritime University of Szczecin, 53(125), 154-160.
Colwell, K. & Narayanan, V.K. (2010) ‘Foresight In Economic Development Policy: Shaping The Institutional Context For Entrepreneurial Innovation,’ ELSEVIER Futures, 42, 295-303.
Conceptual Assumptions of Financial Reporting (2016) [in;] International Financial Reporting Standards, SKwP, IFRS, Warszawa, par. C1, 34.
„Dołączyliśmy do elitarnego grona. Polska krajem rozwiniętym” (2018). [Online]. money.pl/ [Retrieved May 02, 2020] https://www.money.pl/gospodarka/wiadomosci/artykul/dolaczylismy-do-elitarnego-grona-polska,23,0,2416663.html
Gomułka, S. (2016), Poland’s economic and social transformation 1989-2014 and contemporary challenges, Central Bank Review 16, 19-23.
Furman, T. (2019), „Dlaczego ceny gazu spadają?” [Online]. Parkiet. [Retrieved May 02, 2020], parkiet.com
Hendriksen, E.A., van Breda, M. F. (2002), Teoria rachunkowości, Wydawnictwo Naukowe PWN, Warszawa, 37-44.
IAS 1 (2016), Presentation of Financial Statements, IFRS, SKwP Warszawa par. 9.
Jarmołowicz, W., Piątek, D. (2013), Polska transformacja gospodarcza. Przesłanki – przebieg – rezultaty. In: W poszukiwaniu nowego ładu ekonomicznego, edited by S. Owsiak and A. Pollok, Polskie Towarzystwo Ekonomiczne, Warszawa, 71-89.
Jaruga, A. (1991), Niektóre wyznaczniki rozwoju rachunkowości, w: Współczesne problemy rachunkowości (edited by A. Jaruga), PWE, Warszawa, 12-13.
Kieżun, W. (2014), Patologia transformacji. Wydanie uzupełnione. Wydawnictwo Poltext, Warszawa, 1-439.
Kiss, Andreea N., Danis, Wade M., Cavusgil, S. Tamer (2012), ‘International Entrepreneurship Research In Emerging Economies: A Critical Review And Research Agenda,’ ELSEVIER Journal of Business Venturing, 27, 266–290.
Kołodko, G.W. (1992), Transformacja polskiej gospodarki – sukces czy porażka?, Polska Oficyna Wydawnicza BGW, Warszawa, 1-197.
Kołodko, G.W. (2000), ‘From Shock to Therapy. Political Economy of Postsocialist transformation’, Oxford University Press, New York.
Kołodko, G.W. (2007), Polskie drogi i bezdroża transformacji, Wydawnictwo Uniwersytetu Ekonomicznego, Kraków, p. 3-4.
Kowalik, T. (1997) ‘Społeczne Koszty Transformacji,’ Opinie i Ekspertyzy KP Unii Pracy, Zeszyt 3, Warszawa.
Kowalik, T. (2007) ‘Blaski i Cienie Transformacji Polskiej,’ In: Futuryzm Miast Przemysłowych. 100 lat Wolfsburga i Nowej Huty. Ha!art, Kraków 2007, 270-273.
IAS 1 (2016), Presentation of Financial Statements, IFRS, par. 9.
Jones, S. (2015) Development of Financial Accounting Theory [in:] The Routledge Companion to Financial Accounting Theory, ed. by S. Jones, Routledge Taylor & Francis Group, London and New York, 1-11.
Nagy, S., Siemek, J. (2009) ‘Podziemne Magazyny Gazu i ich Rola w Gospodarce Gazowej’, Rynek Energii, 4, 8-13.
Niewiński, G. M., Badyda, K., Kopałka, J. (2017), ‘Funkcjonowanie Polskiego Rynku Gazu Na Tle Europy,’ Nierówności Społeczne a Wzrost Gospodarczy, 50 (2/2017) DOI:10.15584/nsawg.2017.2.13
PGNiG (2014), Rynek gazu w Polsce [Online] Available from: pgnig.pl
Swadźba, S. (2007), Integracja i globalizacja a system gospodarczy Polski. Konsekwencje dla Polski, Wydawnictwo Akademii Ekonomicznej w Katowicach, Katowice.
Swadźba, S. red. (2009), Systemy gospodarcze. Zagadnienia teoretyczne, Wydawnictwo Akademii Ekonomicznej w Katowicach, Katowice.
Swadźba, S. (2019), System gospodarczy Polski w latach 1918-2018, Economic Studies NO 1 (95) 2019 Repozytorium Uniwersytetu w Białymstoku DOI: 10.15290/oes.2019.01.95.02.
The Report of the Board of PGNiG S.A. and GK PGNiG S.A. for 2016 and Individual Annual Report
Tweedie, D. (2015), Standard setting, politics and change management: a personal perspective [in] The Routledge Companion to Financial Accounting Theory, edited by S. Jones, Routledge Taylor & Francis Group, London and New York, pp. 147-166.