Department of Management , College of Business Administration – Prince Mohammad Bin Fahd University, Al-Khobar, Kingdom of Saudi Arabia
Volume 2021,
Article ID 106613,
Journal of Economics Studies and Research,
9 pages,
DOI: 10.5171/2021.106613
Received date: 28 October 2020; Accepted date: 1 February 2021; Published date: 15 March 2021
Cite this Article as:
Yousif Abdelrahim (2021), “Tribalism in Tribal Countries: How Does It Cause Corruption?", Journal of Economics Studies and Research, Vol. 2021 (2021), Article ID 106613, DOI: 10.5171/2021.106613
This study examines the relationship between tribal factors of ethnic fractionalization, group grievance, gender inequality, indigenous population, and the country’s level of corruption. This study also explains how tribalism causes corruption in 132 countries worldwide. The author used the least-squares multiple regression analysis and secondary data from the Global Economy, the Corruption Perception Index, the World Bank Group, the Human Resource Development, Economic Commission for Latin America and the Caribbean, and the Historical Index of Ethnic Fractionalization Dataset the Economist Study as evidence of gender inequality, corruption, indigenous population, group grievance, ethnic fractionalization, political instability, and indigenous population to test the four hypotheses. The study results suggest that ethnic fractionalization, gender inequality, and group grievance have an influential and significant relationship with the country’s level of corruption. However, the indigenous population seems to have no significant relationship with the country’s level of corruption.
Keywords: Tribalism Index, tribal corruption.
Introduction
According to Transparency International (TI) (https://www.transparency.org/en/ pre ss/one-in-four-people-in-africa-pay-bribes-survey-says), approximately130 million Africans paid bribes in 2019 alone; either to get access to essential services or to escape penalty by the court and /or the police. The costs of corruption (i.e., the exploitation of power for personal gain) are evident and acknowledged. Recently, Global Financial Integrity (www.gfintegrity.org/) reported that $1.1 trillion were lost to corruption in the world’s developing countries in 2013. For example, $ 25.50 billion were lost to corruption in Iraq between January 2011 and December, 2014. What makes many countries in the Middle East and North Africa (MENA) along with other African countries to be the most corrupt countries in the world is still a dilemma. Since corruption impacts a country’s economy, growth and the quality of people’s lives, scholars need to study corruption from different angles. Tribalism Index (TI), developed by the USF Global Initiative on Civil Society and Conflicts (http://usfglobalinitiative.org/tribalism-index/) has long recognized that tribalism (i.e., the perceptions of gender inequality, perceptions of grievance, linguistic and ethnic fractionalization) is one of these angles that plays an important role in corruption. Previous studies such as Abdelrahim’s (2019, 2020) empirically found a positive relationship between tribalism and corruption which confirms the TI findings.
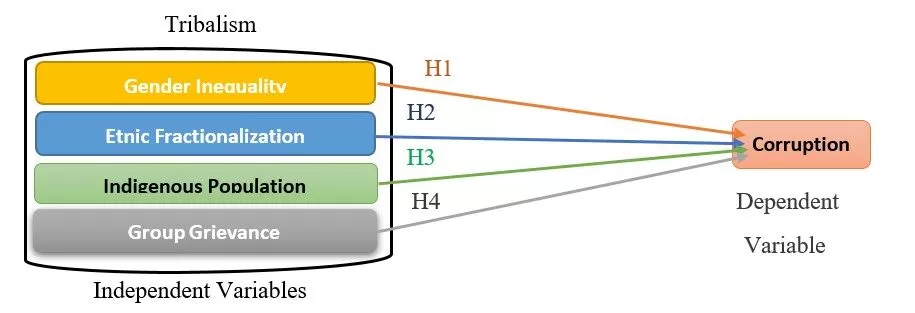
However, social science in general and the management field, in particular, have been Slow-moving to conduct meaningful research in the area of tribalism and corruption that explains why tribalism causes corruption. Tribalism and corruption issues have hardly been addressed in most of the management’s top journals. Hence, it is critical for the management field to become involved in scholarships that may help academics and practitioners to better comprehend the many aspects of tribalism and a country-level of corruption. That leads to one research question; why does tribalism cause corruption? This study fills the gap in the literature by answering the above-mentioned question through empirically examining the relationship between the critical factors (i.e., indicators/components) of tribalism (i.e., the perceptions of gender inequality, perceptions of grievance, linguistic and ethnic fractionalization) and corruption (Figure1). The findings of this study could also benefit educators and policymakers to understand the dynamics of tribalism and focus on tailoring specific educational programs and policies that help reduce corruption.
Literature Review and Hypotheses Development
Figure1: The conceptual framework for the relationship between tribalism and corruption
Corruption
According to Transparency International (2020), corruption is the exploitation of power by government and nongovernment administrators, officers, and key employees for a personal gain. The act of corruption includes illicit enrichment, misusing government property, bribery, hiring relatives and friends, embezzlement, etc. Researchers such as Seldadyo and De Haan (2005) have identified many reasons cultural, economic, and non-economic factors that cause corruption in countries. Corruption hinders the economic growth, discourages foreign investors, employment, government spending on social programs, and harbors poverty (Šumah, 2018).
Tribalism
Consistent with the tribalism index, the author of this paper defines tribalism at a country-level as the perception of corruption, population demographics, gender inequality, perception of grievance, and linguistic and ethnic fractionalization. Perception of corruption is the extent to which government agencies are corrupt due to favoritism, nepotism, and bureaucracy. Population demographics is how big the indigenous population in society is. Gender inequality is to what extent women are equal to men in education, political empowerment, and health. Perception of grievance is the extent to which groups in a society experience grief), linguistic and ethnic fractionalization (i.e., the extent to which society keeps its ethnic and linguistic patterns). In this article, tribalism’s definition is adopted from the tribalism index, which is the only quantitative measure at the country level in the literature. The author needs to be consistent with the tribalism index scale. The tribalism index is a very valid scale with multiple indicators that capture all or most aspects of tribalism.
Tribalism versus Corruption
The relationship between tribalism and corruption has long been identified by Jacobson and Deckard (2012), and the positive relationship between tribalism and corruption at the country-level has been empirically confirmed by Abdelrahim (2019, 2020). Many researchers have linked tribalism to corruption. Gullette (2007) has conceptualized tribalism as one kind of corruption due to kinship ties. Jacobson and Deckard (2012) relate tribalism to corruption because of kin networks that pressurize government personnel to practice nepotism to help their tribe members get richer. Individuals’ values, and norms could significantly dictate corruption (Theron, 2013). For instance, African tribal officials usually accept gifts as gifts are considered a part of their cultural norms (Theron, 2013). In a tribal collectivistic culture, individuals are responsible for taking care of their relatives and close family members. Social pressure created cultural norms and collective tribal life might cause tribe members to fulfill their cultural obligations through corrupt actions such as favoritism and nepotism.
Gender Inequality versus Corruption
Previous Research has claimed a positive relationship between gender inequality and corruption. For example, gender inequality is associated with a higher perceived level of corruption and differences in critical development outcomes in tribal countries (Branisa and Ziegler, 2013). Prior studies have examined the relationship between gender inequality, (which was measured on the basis of women’s representation at the workplace in a country) and corruption. The greater the representation of women in a country, the lower the level of corruption in the economic and political life (Swamy et al., 2001; Dollar, Fisman, and Gatti, 2001). In addition, gender differentiation in masculine cultures contributes to gender inequality and gender inequality contributes to corruption (Islam, 2004). Moreover, Swamy et al. (2001) found that men and women tolerate corruption differently as men are more tolerant to corruption than women. Finally, Rivas (2013) experimentally showed that men go for corrupt choices habitually more than women. Hence, the author argues that gender inequality is more likely to increase the level of corruption in a country and posit hypothesis 1 (H1:
H1: Corruption in countries with a high level of gender inequality will be higher than corruption in countries with a low level of gender inequality.
Ethnic Fractionalization
Ethnic fractionalization is another factor of tribalism that relates to corruption. The relationship between ethnic fractionalization and corruption was articulated by Cerqueti et al. (2012). Cerquet noted the existing nonlinear relationship between corruption and ethnic fractionalization. Many researchers believe that corruption is high in homogeneous countries and low in countries with intermediate ethnic fractionalization (Svensson, 200). Ethnolinguistic fractionalization seems to be accountable for different kinds of corruption-related phenomena (Shleifer and Vishny 1993). According to the study conducted by Mauro (1995), corruption is high in higher ethnic diverse societies due to the ethnic power structure that facilitates bribery. Since bribery is a form of corruption and ethnic fractionalization causes more bribery, the author expects that countries with high ethnic fractionalization to be highly corrupt and posit hypothesis 2 (H2):
H2: Corruption in countries with a high level of ethnic fractionalization will be higher than corruption in countries with a low level of ethnic fractionalization.
Indigenous Population (Population Demographic)
How big the indigenous population in a society plays a critical role in corruption. The social identity theory has predicted traditional in-group bias (Tajfel & Turner, 1979). The theory also proposed that group members tend to favor the in-group to whom they belong over the out-group members for motives to be in line with group promotion and self-esteem. In addition, research on the social cognition suggests that instinctive tendencies could significantly influence behavior without responsive recognition (Bargh, 1997; Perugini, 2005). The disadvantaged (low-status minorities) out-group minority people frequently show out-group favoritism because of the negative stereotypes among low-status minorities and their struggle for equal rights (Hinkle & Brown, 1990; Mullen et al., 1992). Since indigenous people live collectively in one group, the suggests that the indigenous population practice in-group favoritism. Favoritism has been known for its relationship with corruption by prior research. Favoritism is a kind of corruption that is based on mutual trust and long-term social relations and reciprocity (Lowe et al., 2008). According to Redlawsk, D. P. (2005), corruption is perceived as lawbreaking and corruption is also understood as favoritism among Americans. Following the above discussion, the author would argue that indigenous population is associated with corruption and propose hypothesis 3 (H3):
H3: Corruption in countries with a high level of the indigenous population will be higher than corruption in countries with a low level of the indigenous population.
Group Grievance (Perception of Grievance)
Perceptions of grievance are the extent to which groups in a society experience grief. Grievances caused by indigenous marginalization in some countries such as Nigeria is often a fuel that fans violent conflict (Smith, D. J., 2014). That implies grievances could be one of the factors that motivate the outbreak of violent rebellion, civil war, and political instability in a country. For example, the main motivation for the Libyan violent rebellion is the accumulation of group grievances caused by economic grievances, the lifestyle of the former president family members, absence of political rights, and tribal grievances (Are, W. W, 2013). Rebellion can be explained by severe grievances (Collier, P., & Hoeffler, A., 2004). Violent rebellion causes civil war and civil war is an extreme form of political instability (Ghobarah, H. et al., 2003). Political instability has been known for its contribution to the high rate of corruption in the Economic Community of West African States (ECOWAS) (Lederman et al., 2005; Leite and Weidmann, 1999; Park, 2003). Based on the above the author would argue that group grievance is strongly associated with corruption in some countries and propose hypothesis 4 (H4):
H4: Corruption in countries with a high level of group grievance will be higher than corruption in countries with a low level of group grievance.
Methodology
Data Collection
The author used the following general research model to collect secondary data from different resources and tested the four research hypotheses:
LOC=β0+β1*GI+β2*EF+β3*IP+β4*GG+ ε (1)
Where LOC, GI, IP, EF, GG, ε and PI refer to corruption, gender inequality, indigenous population, ethnic fractionalization, group grievance, error and political instability, respectively. After testing the research hypotheses, the study of the specific model is shown below:
LOC=β0+β1*GI+β2*EF+β4*GG+ ε (2)
PI*GR refers to the interaction between political instability and group grievance. EF2, IP2 and PI2 refer to the impact of ethnic fractionalization, the indigenous population, and political instability at higher levels of EF, IP and PI on corruption.
Dependent Variable
Corruption is the dependent variable measured at the country level. The corruption perceptions index was used as a proxy to measure corruption in 132 countries. The Corruption Perceptions Index (CPI) was developed by Transparency International (TI) researchers and experts rank 180 regions and countries based on perceptions of corruption captured by survey questions in the last two years in twelve different institutions. The CPI combines data from thirteen different sources that surveyed a country’s business people and experts with their perceptions of the corruption level in the public sector. The CPI put together several dimensions of corruption to constitute an index that is available online at https://www.transparency. org/en/cpi/2019/ resu lts/table. Respondents who are experts and business executives answered the CPI survey questions that capture all forms of corruption in the public sector including nepotism, favoritism, bribery, etc. The CPI uses a scale that ranges from zero (highly corrupt) to 100 (very clean). For instance, Denmark ranks first with a score of 87 while Somalia with a score of nine ranks 180.
Independent Variable
Indigenous population, group grievance, ethnic fractionalization, and gender inequality are the study independent variables at the country level. Group grievance is measured by the group grievance index and the dataset for group grievance was borrowed from the Global Economy website at https://www.theglobaleconomy. com /rankings/group_grievance_index/. Gender inequality is measured by gender equality index, and the dataset was borrowed from the Human Resource Development website at http://hdr.undp.org/en/data. Indigenous population is measured by indigenous population index, and the dataset for indigenous population was borrowed from the Economic Commission for Latin America and Caribbean website at https://www.cepal.org/ en/infografias/los-pueblos-indigenasen-america-latina, and the World Bank Group/International World Group for Indigenous Affairs (IWGIA) at their website http://iwgia.org/ima ges/yearbook/2020/IWGIA_ the_Indigenous_World_2020.pdf. Ethnic fractionalization is a variable that was measured by ethnic fractionalization index, and the dataset for ethnic fractionalization was borrowed from the Historical Index of Ethnic Fractionalization Dataset at (HIEF) https://dataverse. harvard.edu/dataset. xhtml?Persi sten tId=doi:10.7910/DVN/4JQRCL.
Control Variable
The literature review shows that a country’s political instability could influence the country’s level of corruption. Political instability increases the level of corruption in the long-term (Nurudeen, Abd Karim and Aziz, 2015). Political instability is measured by the political instability index borrowed from the Economist Study at http://viewswire.eiu.com/site_info.asp?info_ name=social_unrest_tab le&page= noa ds&rf=0. The Economist Study ranks countries at a scale ranges from zero to ten, where zero means a country is highly not corrupt and ten means a country is highly corrupt.
Hypotheses Test
In this research study I examined the influence of four factors of tribalism (i.e., group grievance, indigenous population, gender inequality, and ethnic fractionalization) on the national levels of corruption in 132 countries using the ordinary least-squares multiple regression analysis and controlling for political instability. The least squares regression analysis is used because the corruption variable dataset is normally distributed with appropriate variance. To examine the influence of tribalism factors on levels of corruption, the author controlled for the countries’ political instability and entered all the tribalism factors simultaneously. The author also thought carefully about the indigenous population factor when entering the tribalism variables individually in the regression equations because of the data limitation on indigenous population. The number of tribalism variables in the regressions always kept one, two, or three variables at a time, keeping enough degrees of freedom. For other tribalism factors there was no need for limiting the number of tribalism factors entered in the regression equation since there is a dataset for 132 countries, and therefore, there are no concerns about the degree of freedom.
Results
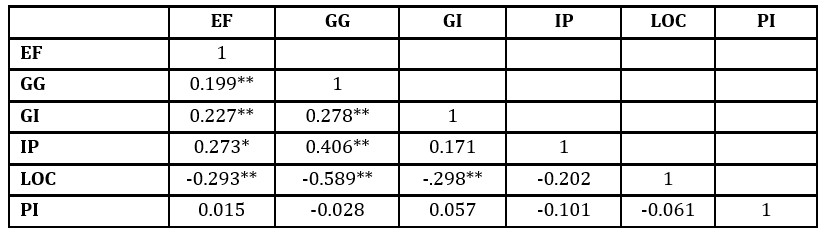
Through the results of the least-squares multiple regression analysis, the study seeks to explain the dissimilarities across nations in the propensity to be corrupt. Table 1 shows the correlations between all the six variables included in the least square regression analysis. Table 2 model 2, 3, and 4 show the inclination of a nation to be corrupt versus tribalism factors and political instability. The cross-sectional data for corruption of all regions and countries under examination were measured as perceptions in all 132 nations.
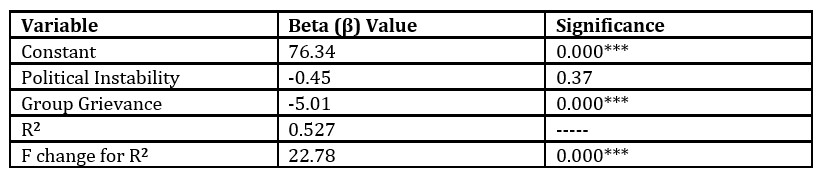
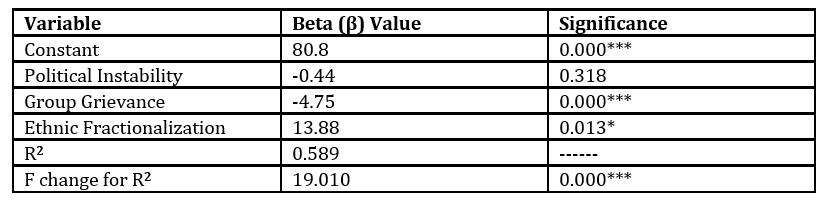
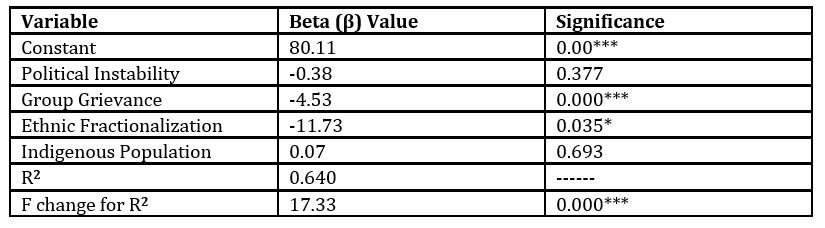
The results from the ordinary least squares suggest group grievance to be the most powerful tribal factor that influences the level of corruption in many nations because it is significant in all of the three regression equations in which it was included. Group grievance appears to have a remarkable relationship with the country’s level of corruption. Ethnic fractionalization is the second most important tribal factor because it has a significant relationship with the level of corruption in two out of four regression models. Gender inequality also has a significant relationship with the level of corruption in one of the three regression models. The tribal factor of the indigenous population appears to have no significant explanatory power in all of the four regression equations. Finally, political instability appears to be a significant control variable in one of the four regression equations.
Table 1: Correlations between all the six variables
Note: *Correlation is significant at the 0.05 level (1-tailed). **Correlation is significant at the 0.01 level (1-tailed). EF= Ethnic Fractionalization; GG= Group Grievance; GI= Gender Inequality; IP= Indigenous Population; LOC= Level of Corruption; and PI= Political Instability
Table 2 model 1: Political Instability Versus Corruption
P*<0.05, P**<0.01, P***<0.001
Table2 model 2: Political Instability and Group Grievance
P*<0.05, P**<0.01, P***<0.001
Table 2 model 3: Political Instability, Group Grievance, and Ethnic Fractionalization
P*<0.05, P**<0.01, P***<0.001
Table 2 model 4: Political Instability, Group Grievance, and Ethnic Fractionalization
P*<0.05, P**<0.01, P***<0.001
Conclusions
The least-squares regression analysis supported three of the four hypotheses. H1, H2, and H4 were supported. Gender inequality, ethnic fractionalization, and group grievance all have a significant effect on the country’s level of corruption. The results showed no significant relationship found between the level of corruption and the indigenous population. H1 is consistent with Branisa and Ziegler (2013) who associated high levels of gender inequality with higher levels of corruption in countries. The relationship between indigenous population and the country’s level of corruption was not supported. The indigenous population might have no significant impact on the country’s level of corruption since indigenous people are highly unemployed and even when they are in the workforce they are more likely to hold non key positions that will allow them to make important decisions and be corrupt. For example, in Australia indigenous employment disparity is still an issue since the unemployment rate among indigenous people is 28% (Taylor, & Hunter, 1998).
Theoretically, research study findings may help scholars explain why tribalism causes corruption in some countries. Researchers could also have a clear idea about which tribal factor contributes the most to the levels of corruption in highly tribal communities and countries worldwide. Practically, the study findings could help educators tailor specific training programs that focus on gender equality and gender differences, and therefore, incorruptness. The research findings might also layout guidance for policymakers to pay extra special attention to ethnic fractionalization with regard to socioeconomic distribution. Finally, the findings may help leaders embrace new strategies that help overcome social instability and group grievance. Future research should investigate why political instability does not significantly impact the country’s levels of corruption in all of the four regression models.
Abdelrahim, Y., 2019. Tribalism and corruption: scale construction and explorations beyond natural culture (Doctoral dissertation, University of Wisconsin–Whitewater).
Abdelrahim, Y., 2020. Tribalism and Corruption: Exploration beyond National Culture. International Journal of Management (IJM). 11(9), 2020, pp. 1067-1091. http://www. iaeme. com/ IJM/issues.asp?JType=IJM&VType=11&IType=9
Bargh, J.A. (1997). The automaticity of everyday life. In R.S. Wyer (Ed.), Advances in Social Cognition (Vol. 10, pp. 1–61). Mahwah, NJ: Erlbaum.
Branisa, B., Klasen, S., & Ziegler, M. (2013). Gender inequality in social institutions and gendered development outcomes. World Development, 45, 252-268.
Campante, F. R., Chor, D., & DO, Q. A. (2009). Instability and the Incentives for Corruption. Economics & Politics, 21(1), 42-92.
Christensen, J. (2018). Refugees & violent group grievance. Journal of human security, 14(1), 13-23.
Cerqueti, R., Coppier, R., & Piga, G. (2012). Corruption, growth and ethnic
fractionalization: a theoretical model. Journal of Economics, 106(2), 153-181.
Collier, P., & Hoeffler, A. (2004). Greed and grievance in civil war. Oxford economic papers, 56(4), 563-595.
Dollar, D., Fisman, R., & Gatti, R. (2001). Are women really the “fairer” sex? Corruption and women in government. Journal of Economic Behavior & Organization, 46(4), 423–429.
Ghobarah, H. A., Huth, P., & Russett, B. (2003). Civil wars kill and maim people—long after the shooting stops. American Political Science Review, 97(02), 189-202.
Gullette, D. C. (2007). Kinship, state, and ‘tribalism’: the genealogical construction of the Kyrgyz Republic (doctoral thesis). https://doi.org/10.17863/CAM.16269.
Hinkle, S. & Brown, R. (1990). Intergroup comparisons and social identity: Some links and lacunae. In D. Abrams & M. A. Hogg (Eds.), Social Identity Theory: Constructive and Critical Advances. Hemel Hempstead: Harvester.
Islam, N. (2004). Sifarish, sycophants, power and collectivism: Administrative culture in Pakistan. International Review of Administrative Sciences, 70(2), 311-330.
Jacobson, D., & Deckard, N. (2012). The tribalism index: Unlocking the relationship between tribal patriarchy and Islamist militants. New Global Studies, 6(1).
Lederman, D., Loayza, N. V., & Soares, R. R (2005). Accountability and corruption: Political institutions matter. Economics & Politics, 17 (1), 1-35.
Lehmijoki, U., & Palokangas, T. (2006). Political instability, gender discrimination, and population growth in developing countries. Journal of Population Economics, 19(2), 431-446.
Leite, C. A. & Weidmann, J. (1999). Does mother nature corrupt?: Natural resources, corruption, and economic growth (Working Paper No. 99/85). International Monetary Fund.
Loewe, M., Blume, J., & Speer, J. (2008). How Favoritism Affects the Business Climate: Empirical Evidence from Jordan. Middle East Journal, 62(2), 259–276. Retrieved from http://www.jstor.org/stable/25482509.
Mauro, P.: Corruption and Growth. Quarterly Journal of Economics, 681-712 (2000)
Mullen, B., Brown, R. & Smith, C. (1992). In-group bias as a function of salience, relevance, and status: An integration. European Journal of Social Psychology, 22, 103–122.
Nurudeen, A., Abd Karim, M. Z., & Aziz, M. I. (2015). Corruption, political instability and economic development in the Economic Community of West African States (ECOWAS): is there a causal relationship? Contemporary economics, 9(1), 45-60.
Park, H. (2003). Determinants of corruption: A cross-national analysis. Multinational Business Review,11 (2), 29-48.
Perugini, M. (2005). Predictive models of implicit and explicit attitudes. British Journal of Social Psychology, 44, 29–45.
Redlawsk, D. P., & McCann, J. A. (2005). Popular interpretations of ‘corruption’and their partisan consequences. Political Behavior, 27(3), 261-283.
Rivas, M. F. (2013). An Experiment on Corruption and Gender. Bulletin of Economic Research, 65(1), 10–42.
Seldadyo, H. and De Haan, J., 2005. The determinants of corruption. The Economist, 66, pp.1-60.
Shleifer A, Vishny R (1993) Corruption. Q J Econ 108(3):599–617.
Smith, D. J. (2014). Corruption complaints, inequality and ethnic grievances in post-Biafra Nigeria. Third World Quarterly, 35(5), 787-802.
Svensson J (2000) Foreign aid and rent-seeking. J Int Econ 51:437–461.
Šumah, Š. (2018). Corruption, causes and consequences. In Trade and Global Market. In Tech Open.
Swamy, A., Knack, S., Lee, Y., & Azfar, O. (2001). Gender and corruption. Journal of Development Economics, 64(1), 25–55.
Tajfel, H., & Turner, J. (1979). An integrative theory of intergroup conflict. In W. G. Austin and S. Worchel (Eds.), The social psychology of intergroup relations (pp. 33–48). Monterrey, CA: Brooks-Cole.
Taylor, J., & Hunter, B. (1998). The job still ahead: Economic costs of continuing Indigenous employment disparity.
Theron, P.M., 2013. Corruption in Sub-Saharan Africa: A practical-theological response. In die Skriflig, 47(1), pp.1-8.
Transparency International, ‘What Is New?’, 18 October 2020 July, available at: https://www.transparency.org/en/what-is-corruption (accessed 18 October 2020).