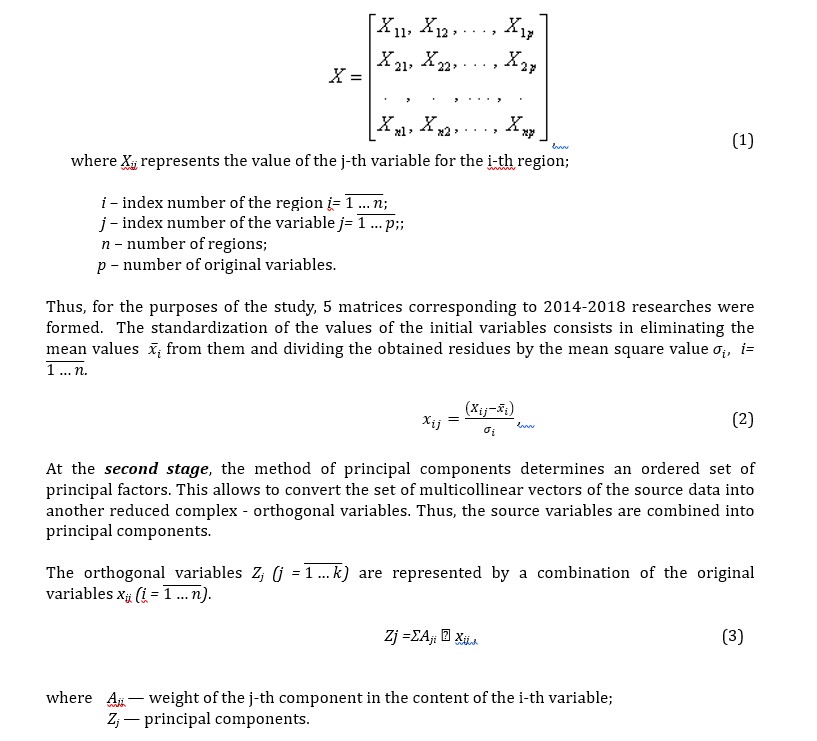
Institute of Economics and Management, Samara National, Research University, Samara, Russian Federation
Volume 2021,
Article ID 126542,
Journal of Economics Studies and Research,
16 pages,
DOI: 10.5171/2021.126542
Received date: 18 August 2020; Accepted date: 17 December 2020; Published date: 22 June 2021
Cite this Article as:
Tatyana S. KOROSTELEVA and Vladimir Y. TSELIN (2021), “Management of Regional Imbalances in the Russian Mortgage Market Using the Principal Components Method", Journal of Economics Studies and Research, Vol. 2021 (2021), Article ID 126542, DOI: 10.5171/2021.126542
The article is devoted to the topic of sustainable development of mortgage instruments in the context of pronounced imbalances in regional development. The analysis was carried out on the example of 85 regional markets of Russia, heterogeneous in terms of the degree of development of mortgage mechanisms in their own territories. The object of the research was the mortgage potential of the regional markets of Russia. The aim of this article is to outline the mechanisms for managing regional imbalances in mortgage development based on the analysis and assessment of the mortgage potential of Russian entities. To achieve this goal, the article substantiates the composition of panel data used for the primary analysis of mortgage potential. The methods of aggregation of local criteria (primary variables) into generalized indicators are determined. In particular, the authors substantiate the application of multidimensional methods of factor analysis, including the method of principal components, to solving the problem of classifying Russian regions. The main factors (main components) of the development of the regional system of housing mortgage lending are highlighted. A comprehensive assessment of the mortgage potential of Russian regions is given and their systematic ranking is carried out. Based on the results obtained, recommendations are proposed for increasing the mortgage potential of the constituent entities of the Russian Federation in the field of state policy. The theoretical significance of the study lies in the development of scientific approaches to assessing and managing regional imbalances in mortgage development, caused by the uneven socio-economic development of regions.
Keywords: Mortgage Potential, Regional Imbalances, Management Decisions, Principal Components Analysis.
Introduction
Mortgage loan is one of the biggest innovations in real estate and the financial sector (Dong, 2015). A developed mortgage market contributes to the growth of the economy due to the prosperous real estate development, more efficient allocation of resources, stimulating the development of housing construction and related industries, creating additional workplaces. Mortgages are one of the main mechanisms for improving the housing conditions of the population. In this regard, the formation of an effective system of mortgage lending is one of the priority directions of the state housing policy in Russia.
Currently, Russian regions are actively developing mortgage lending in their territories. At the same time, the degree of development of mortgage mechanisms in the regions differs significantly, the mortgage market functions unevenly in the territory of the Russian Federation, which is due to the huge geographical length of the country, the historical and national specifics of individual regions. This is also due to the peculiarities of their socio-economic development, namely the quantitative and qualitative characteristics of the economy, social and banking spheres of Russian entities.
Note that regional inequality in mortgage markets is present not only in Russia, but also in other countries with pronounced territorial differentiation, such as Canada, Italy, England, Spain, Greece, China, etc.
In this regard, the very topic of sustainable development of mortgage instruments is very relevant both in Russian and foreign financial and economic literature. At the same time, the relevance of this topic is even more growing in countries with high levels of regional inequality in economic activity, where the uneven socio-economic development of regions causes significant imbalances in the functioning of the housing and mortgage markets.
Literature Review
Scientists around the world are discussing a wide range of problems related to the efficient functioning of national mortgage and housing markets, as well as the impact of these segments on the stability of the banking systems of individual states and the world economy generally. For example, a significant part of modern scientific research, in particular the works of Grodecka-Messi (2019), Lyapina et al. (2020), Ge (2014), Cho and Kim (2012), is devoted to studying the effect of investments in mortgage markets on financial stability. Another part of modern research, for example Zhihua (2020), Kharabara (2017), Korosteleva (2013), is focused on the specific problems to specific territories of the development of mortgage lending. These problems are especially urgent for developing countries, characterized by underdeveloped mortgage instruments in the territories of their states.
However, despite the relatively large amount of research on the topic of mortgage lending development, two aspects remain insufficiently explored in this area. Firstly, this is the problem of regional inequality in the development of mortgage lending, and secondly, the issues of measuring the “depth” of mortgage markets.
Thus, the main studies in these areas are often focused on identifying the specifics of the development of housing markets and mortgage lending in their territories (for example, Davydovich et al., 2019), assessing the impact of this specificity on the state of the housing problem in the whole country (for example, Guzikova, 2017), an analysis of the prospects for the development of this financial and credit instrument (for example, Shkurkin, 2017) in specific (subjects). At the same time, the task of measuring the “depth” of this development in the conditions of socio-economic inequality of their subjects is not set.
In turn, a number of authors study the problem of measuring the depth of mortgage markets in a country context (for example, Kutlukaya and Erol, 2016). Some authors base their models on one or two factors, studying their influence on the resulting variable, which characterizes, from their point of view, the level of development of mortgage lending in the country. For example, a study by Josphat (2013) assesses the effect of interest rates on mortgage financing, Kaplan (1996) measures mortgage activity by two parameters, comparing a variable that measures the percentage of rejected loan applications with a variable that measures the number of loans per 1000 housing units.
Other authors base their models on one or several clusters of factors, for example, Mogaka et al. (2015) analyze the influence of macroeconomic variables (such as the average annual inflation rate, average annual (GDP) growth rate, average annual exchange rate, and the percentage of people employed in the informal sector and others) on the growth of the mortgage market in Kenya. Ghosh (2016) considers banking and economic conditions as regional economic determinants that influence the development of mortgage lending. Kieti and K’Akumu (2018) explain the availability of mortgage lending in several clusters of factors related to the socio-economic factors of households, characteristics of ownership, characteristics of loans and the macroeconomic environment.
In this study, the authors connect the topic of regional development with an assessment of the level of development of local mortgage markets. Despite the fact that the problem of regional inequality in mortgage markets is one of the most interesting and relevant in countries with pronounced territorial differentiation, only a small part of scientific works is currently devoted to its solution.
These include, in particular, the Patatouka study [18], which identifies the disproportions in the development of housing and mortgage markets in the regions of Greece, carries out their simplified assessment, the study of Aranaz et al. [19], where the authors compare the features of retrospective development and assess regional differences in the Spanish mortgage market using the “bundle” methodology, works by Grezina, Ivashkov [20, 21], where the authors, using cluster or factor analysis (or both types of analysis), assess the mortgage potential of Russian regions.
It should also be noted that in addition to the very limited number of studies on assessing regional inequality in mortgage markets, there is another problem. Thus, the emphasis in most studies is placed on the development of methodologies for systematic ranking of mortgage markets, many of which are based on integral criteria. However, researchers often miss the solution of a more important problem – management on the basis of the formed integral criteria of regional mortgage imbalances in order to reduce or eliminate them.
Therefore, this study is aimed at filling the gap in this area of knowledge, and aims to identify the mechanisms for managing regional imbalances in mortgage development based on the analysis and assessment of the mortgage potential of Russian entities. To achieve this goal, the task is to develop a comprehensive criterion for assessing the development potential of regional systems of housing mortgage lending (MHL) in conditions of socio-economic inequality of the regions of the Russian Federation.
Materials and Methods
Data
For analysis and assessment of regional mortgage inequality, as well as modeling a comprehensive criterion for assessing the development potential of regional mortgage lending systems, panel data of state statistics (Rosstat and the Central Bank of the Russian Federation) was used.
In this study, the authors propose the option of moving from particular criteria for assessing regional mortgage potential to a comprehensive indicator. It’s based on 23 primary indicators, divided into 4 functional blocks. In particular, the following were identified: a block of economic indicators (5 indicators), a block of housing indicators (5 indicators), a block of socio-demographic indicators (2 indicators) and a block of indicators for assessing the current development of the mortgage market (11 indicators) (Tselin and Korosteleva, 2020). To increase the reliability of the study, data sets were generated for 85 constituent entities of the Russian Federation, including the Republic of Crimea and the city of Sevastopol, during 2014-2018. Note that in this case the source data for the first, most of the second and half of the third blocks of indicators, are based on the annual statistical compilation of the Federal State Statistics Service of the Russian Federation “Regions of Russia. Socio-economic indicators. 2019”. The initial data for the fourth block is mainly based on the annual statistical compilation of the Central Bank of the Russian Federation “Some information on the residential mortgage in Russia. No. 5, 2013-2017”, as well as the official website of the Central Bank of the Russian Federation (for indicators of 2018). An insignificant part (3 of 23 indicators) was formed on the basis of studies by the Institute for Urban Economics (housing affordability coefficient), the Information and Analytical Portal “All about the mortgage” (the number of existing social mortgage programs), and the “RIA Rating” Rating Agency (share of families who are able to buy a home with a mortgage).
Methodology
To determine the level of the mortgage potential of the region, a methodology was applied based on statistical factor analysis, the principal components analysis.
Principal component analysis is one of the most commonly used methods of reducing the dimension of the initial set of indicators, implemented in most well-known application software sets, for example, Statistica, SPSS and others. Of greatest practical interest is the use of the method for classifying objects, when, based on the analysis of the factor loadings, it is possible to divide the primary variables into groups according to the degree of their influence on the main factors (Orlov, 2016).
The methodology for determining the level of mortgage potential in the region includes the following steps:
The formation of an array of source data and the formation of a matrix of standardized values;
The definition of the main components;
The selection and implementation of the rotation procedure;
The formation of a model for assessing the mortgage potential of the region and the rationale for the analysis of the structure associated with the main components of the primary indicators;
The Formation of a matrix for assessing the mortgage potential of the region;
Determining the class of the mortgage situation in the region based on the matrix for assessing the mortgage potential of the region.
Thefirst stage involves the formation of a matrix of source data for indicators that are presented in the Data section.
Replacing the real, normalized variables xi with a smaller number of variables Zj, ensures the reduction of the initial variables and a decrease in the multicollinearity effect of many factors.
The total multiple dispersion explained by the main components should be at least 70%.
To fulfill this requirement, at the third stage, the rotation procedure of the axes of the main components is performed. The highest values of the group dispersion fraction were obtained using the varimax method.
The varimax method is based on maximizing variances of variable pressure for each factor, which leads to an increase in large and a decrease in small values of factor loads and facilitates the understanding and interpretation of factors. When interpreting a factor, those initial variables are taken into account that have maximum loads on it in absolute value (Zhgun, 2013).
The criterion for a satisfactory solution is usually to obtain an understandable (interpreted) load matrix, and, accordingly, the possibility of a clear meaningful interpretation of the resulting factors.
The selected factors (principal components) are based on the projected model for assessing the mortgage potential of the region at the fourth stage of the proposed methodology.
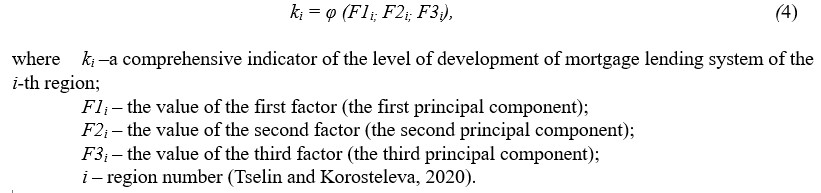
A model for assessing the mortgage potential of a region can formally be represented by the following formula:
where ki –a comprehensive indicator of the level of development of mortgage lending system of the i-th region;
F1i – the value of the first factor (the first principal component); F2i – the value of the second factor (the second principal component); F3i – the value of the third factor (the third principal component); i – region number (Tselin and Korosteleva, 2020).
At thefifth stage of the methodology, a discrete scale is constructed for each of the selected factors, which involves the allocation of three levels of values of the obtained components:
– level A (high value);
– level B (average value);
– level C (low value).
The result of the implementation of the fifth stage is at least a three-dimensional matrix for assessing the mortgage potential of the region, including 27 possible combinations of coordinates in the space of alternatives.
The resulting matrix is a visual tool for assessing the current mortgage potential of the region for regional authorities, as well as a strategic tool for choosing the “desired” position when setting goals to increase mortgage activity in its own territory. The definition of the class of the mortgage situation in the region on the basis of the matrix for assessing the mortgage potential of the region is carried out at the sixth stage of the proposed methodology.
Results
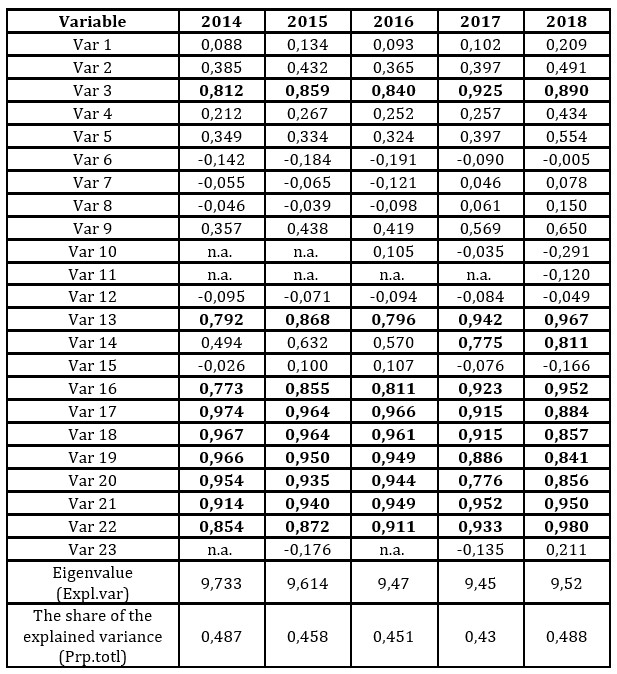
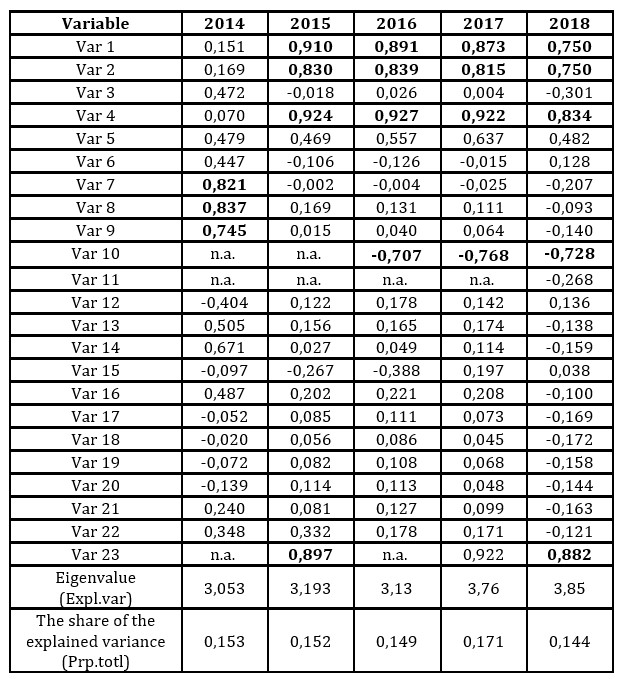
We apply the described methodology to obtain a comprehensive assessment of the mortgage potential of the Russian regions. To do this, we use the Statistica application package. Table 1 presents the results obtained, namely, the matrix of factor loads, which are the correlation coefficients of the initial variables and the first selected factor for 2014-2018. Moreover, the criterion for the formation of the structure of the factor is the strength of the connection between it and the original variables, interpreted as “high” or “very high”.
Table 1: The values of factor loads for the first factor for 2014-2018
Source: authors’ own calculations using the Statistica software package
Note that the entire five-year period of the study of Factor 1 was formed by almost the same composition of the initial variables. At the same time, the following primary indicators showed a high and very high relationship between it and the entire set of source variables:
– Var 3 – the number of economically active population, thousand people;
– Var 13 – the volume of issued mortgage housing loans according to the Central Bank of the Russian Federation (in rubles and foreign currency), thousand rubles;
– Var 14 (for 2017-2018) – the number of issued mortgage housing loans according to the Central Bank of the Russian Federation (in rubles and foreign currency), pcs.;
– Var16 – total debt on housing mortgage loans according to the Central Bank of the Russian Federation (in rubles and foreign currency), thousand rubles;
– Var17 – the number of credit organizations issuing mortgage housing loans, pcs.;
– Var18 – the number of credit organizations attracting refinancing in the secondary market of mortgage lending, pcs.;
– Var19 – refinancing of mortgage housing loans with the sale of a pool of mortgage housing loans (rights of claim for MHLs) without the formation of an additional financial instrument, million rubles;
– Var20 – refinancing of mortgage housing loans with the sale of a pool of mortgage housing loans (rights of claim for MHLs) with a further issue of mortgage-backed securities, million rubles;
– Var21 – the amount of overdue debts on MHLs, million rubles;
– Var22 – the volume of prematurely repaid mortgage housing loans in the reporting period, million rubles.
The obtained results also throughout the entire period of the study demonstrate a rather high proportion of the explained variance for the first factor – from 0.43 (for 2017) to 0.488 (for 2018).
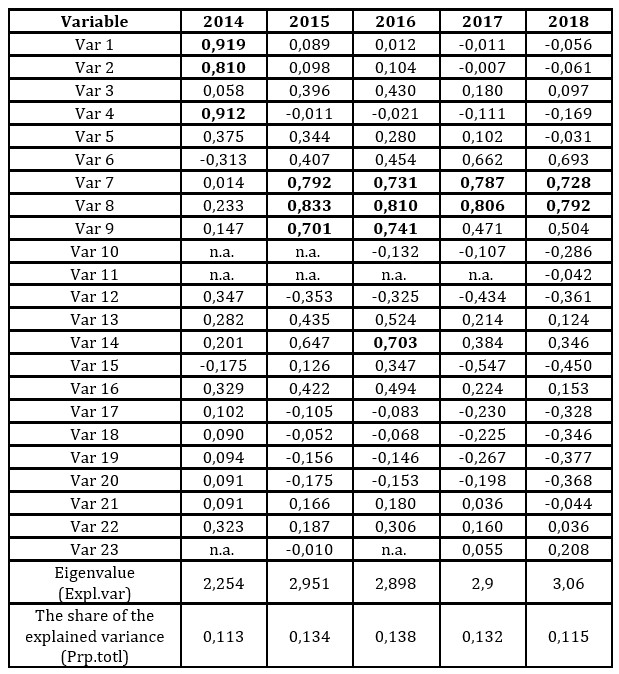
Analyzing the structure of Factor 2 (Table 2), it can be noted that a stable composition of its primary indicators has been observed for the past four years, namely from 2015 to 2018.
Тable 2: The values of factor loads for the second factor for 2014-2018
Source: authors’ own calculations using the Statistica software package
Its composition in the specified time period is formed by such primary indicators as:
– Var1 – GRP per capita, rubles;
– Var2 – average per capita cash income of the population, rubles;
– Var4- average per capita nominal accrued wages of employees of organizations, rubles;
– Var10 – housing affordability coefficient;
– Var23 – the proportion of families who are available to purchase a home with a mortgage, %.
The minimum share of the explained variance for Factor 2 is 0.144 (for 2018), the maximum is 0.171 (for 2017).
As for the structure of the third factor, here the composition of its primary variables is less stable, however, during 2015-2018 two indicators are clearly distinguished in its design (Table 3), namely:
– Var7 – commissioning of residential buildings per 1000 population, sq. m. total area;
– Var8 – commissioning of apartments per 1000 population, units.
Table 3: The values of factor loads for the third factor for 2014-2018
Source: authors’ own calculations using the Statistica software package
The proportion explained by Factor 3 of the variance is from 0.113 (for 2014) to 0.138 (for 2016).
In general, the obtained results prove a stable composition of the initial variables in the structure of the identified factors for almost the entire period of the study. An exception is the structure of the second and third factors for 2014, however, an analysis of the results shows that the second and third factors in 2014 simply changed ranks in terms of the share of the explained group variance of the source variables, preserving the structure. This can be explained by the lack of data on some indicators for 2012, for example, the share of families who are available to purchase housing through mortgages. In turn, the correlation coefficient of this variable with the second factor according to the results of data processing for subsequent periods always has a significant level of statistical dependence in the range from 0.897 (2013) to 0.922 (2015).
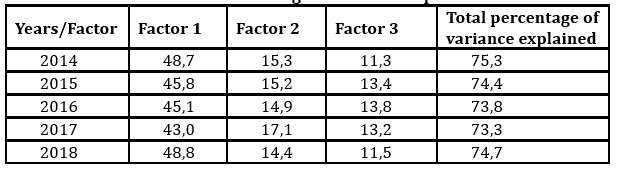
The total percentage of the variance explained by the selected factors is calculated in table 4. For all five years of the study, the multiple variance is higher than 70% and ranges from 73.3 (2017) to 75.3 (2014) percent.
Table 4: Percentage of variance explained
Source: authors’ own calculations using the Statistica software package
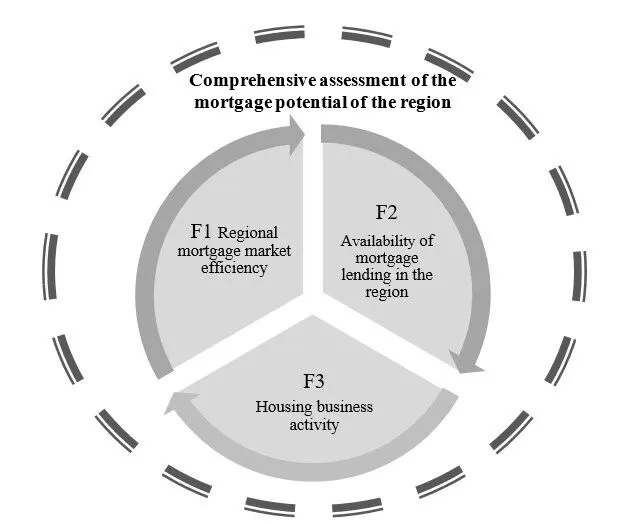
An analysis of the composition of primary variables in the structure of the principal components of the factors selected on the basis of the method allows us to give them the following meaningful interpretation (Fig. 1):
– F1 – an indicator of the effectiveness of the functioning of the regional mortgage market;
– F2 – an indicator of the availability of mortgage lending in the region;
– F3 – an indicator of business activity in the field of housing.
Fig. 1: Meaningful interpretation of the obtained factors
Source: authors’ own elaboration
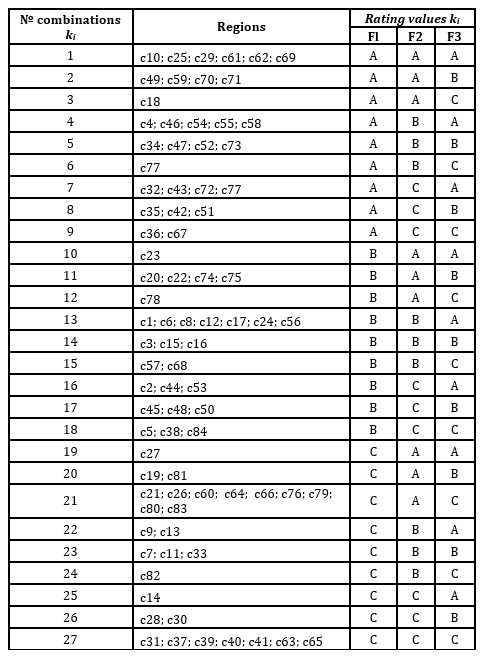
According to the developed methodology for assessing the mortgage potential of regions, at the next stage of the study, a scaling procedure is carried out by levels A, B, C based on the quantile approach. Its application made it possible to divide each of the obtained series of the differential indicator values (F1-F3), including a differential assessment for 85 regions, into three equal groups, where level A forms the first percentile, level B forms the second percentile, and level C forms the third percentile of Russian regions. In turn, the results were tested on the economic indicators of 85 Russian subjects at the last stage of the study. The detailed results of a comprehensive assessment of the mortgage potential of Russian regions for 2018 presented in Table 5. Based on the testing of the proposed methodology, a matrix for assessing the mortgage potential of the entire set of the Russian Federation regions was obtained, including 27 possible combinations of estimates of the differential indicator. Each of the selected cells lists the ordinal numbers of the regions that received one or another rating.
Table 5: Results of a comprehensive assessment of the mortgage potential of the regions of the Russian Federation
Note: «c» is the ordinal number of the subject of the Russian Federation adopted by the authors, for example, c1 –Belgorod region; c2– Bryansk region;…..; с18 –Moscow; …..; с85– Sevastopol.
Source: authors’ own calculations
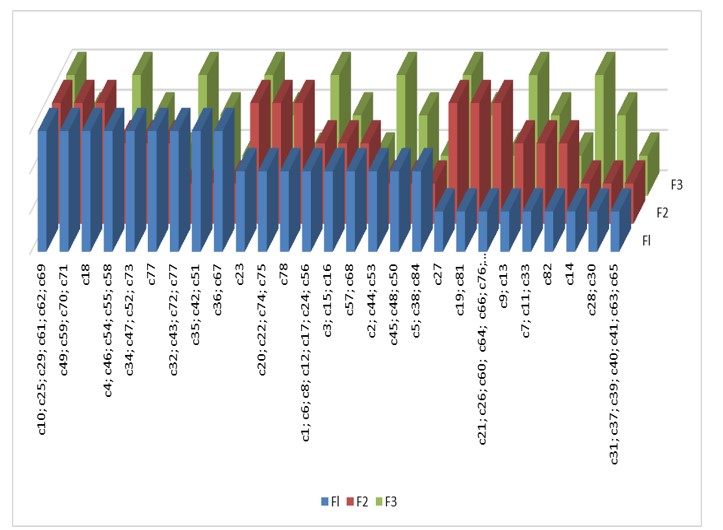
The results of assessing the mortgage potential of Russian regions are clearly shown in Figure 2.
Fig. 2: Illustration of the results of assessments of the mortgage potential of the regions of the Russian Federation
Source: authors’ own elaboration
Discussion
The methodology for assessing the mortgage potential of regions developed by the authors has the following advantages:
Obtaining a quantitative assessment of the mortgage potential of each of 85 Russian entities and its meaningful interpretation;
Possibility of comparing the imbalances in regional mortgage development;
Elaboration of management decisions aimed at the implementation of such a “course” of development, which will not only align the mortgage inequality in Russian regions but also increase the level of mortgage development in the country as a whole.
The last point is the most important advantage of the developed approach over existing analogues. In addition, the administrative decisions obtained on the basis of the model for assessing the mortgage potential of the regions can form the basis of the program of state support for mortgage lending in the regions of the Russian Federation.
Thus, as part of the implementation of state support measures for Russian regions, subsidized mechanisms for financing mortgages can be applied to all regions that received low marks (level C) for one or more components of the differential indicator. At the same time, state aid should have a strictly targeted nature, it should be provided on the basis of such instruments as subventions and subsidies. Within the framework of the projected system, in the current economic conditions for the regions of level “C”, the following management solutions can be proposed to increase the mortgage potential:
For the first component of the differential indicator (F1) – the efficiency of the regional mortgage market:
Subventions to federal (DOM.RF) and regional mortgage operators for funding credit institutions that carry out mortgage lending activities on the territory of regions, through the organization of mortgage loan buyout. Such a redemption can be carried out through cession, as well as the purchase and sale of mortgages. This mechanism will allow credit institutions to carry out the procedure for refinancing mortgage loans in the most simplified and quick manner, which in this case will be carried out without the formation of an additional financial instrument, to be specific the organization of the mortgage securities issue. As a result, banks and other financial and credit organizations will receive an almost unlimited resource for issuing “cheap” loans in the territory of the region and that will inevitably lead to an increase in the key primary components for the first factor: the volume of mortgage loans issued in rubles and pieces, as well as the total volume debt on mortgage loans.
State subsidies for operating expenses for issuing mortgage loans. These costs include the fixed costs of the credit institution such as rental costs, office maintenance, staff salaries, social security contributions, equipment depreciation, etc. Covering part of operating expenses at the expense of the state source of financing will allow credit institutions to reduce interest rates on mortgage loans without lowering the rate of return. The economic effect of the implementation of such a measure is obvious – stimulating the demand for mortgage lending will lead to the growth of the regional housing and mortgage market.
To increase the second component of the differential indicator, specifically the availability of mortgage lending for housing in the region, it is advisable to develop a regional program of targeted assistance to socially significant segments of the population in need of better housing conditions. Such a regional subsidy should be provided to cover part of the monthly mortgage debt service payment. At the same time, the competence to determine the degree of need and the choice of categories of socially significant strata of the population who are entitled to such a subsidy will belong exclusively to the regional authorities. Note that such a measure will allow, first of all, state employees, such as doctors, young scientists, teachers, etc. to compensate for their “lost cash income” and increase their mortgage opportunities. As a result, the share of families with the possibility of obtaining a mortgage loan will grow in the region.
III. An increase in the quantitative assessment of the third component of the differential indicator, namely business activity in the field of housing construction, is possible through the implementation of such measures of state support in the regions as:
The development of project financing, including the use of the interest rate subsidy mechanism for the developer. Such a measure can be implemented on the territory of regions with high construction costs due to the remoteness from logistics centers, high utilities, and social burden, as well as the load on parking spaces, etc., which ultimately increases the cost per square meter of housing being built. Using the mechanism of subsidizing the interest rate for the developer in this context will reduce the selling price per square meter. In turn, an increase in the population’s effective demand for construction projects will ultimately ensure the growth of housing commissioned in the region (Eremenko and Gareev, 2019).
Preparation of construction sites and technical conditions at the expense of the state with their further implementation to the developer. Such a measure will allow the state to shift all the costs associated with the supply of communications and facilities, as well as the resettlement of citizens, often from dilapidated housing located in the territory of the proposed development of the region with low construction activity. In the proposed model, the state, for example, represented by the Housing and Mortgage Fund or the regional Ministry of Construction, prepares a construction site using its own financial resources with its further implementation at a “fair” price to the developer, including through the auction mechanism. The practical implementation of such a measure will remove the extra burden from construction companies, thereby reducing the cost per square meter of housing for the region’s population. In addition, the participation of the state in the organization and preparation of sites for the development of residential neighborhoods will make it possible to transfer the issues of citizens’ resettlement from dilapidated housing located in the built-up areas to a civilized channel, as well as to solve the problem of infill development, which has become urgent today in the most regions of the Russian Federation.
Note that if a region received several low scores for the differential indicator components, assistance should be provided to improve each component. At the same time, according to the results of the financial period, it is possible to redistribute aid between the components of the differential indicator. In this regard, it is necessary to constantly monitor the results of the growth policy of the mortgage market in the regions.
It should also be noted that in order to increase the effectiveness of measures to support the mortgage market, financial resources can be provided to the regions on the terms of co-financing of regional mortgage programs. The co-financing scheme will make it possible to fully involve regional authorities in the process of continuous work aimed at achieving the effectiveness of the mortgage mechanisms being implemented. In this setting, the model of state support for mortgage markets, projected on the basis of the developed differential indicator, will also acquire stimulating character.
Conclusions
Based on the study, the following results were obtained:
A methodology for assessing the mortgage potential of regional markets has been developed. Using the method of principal components is proposed as a basic method for the formation of a comprehensive indicator for assessing the mortgage potential of a region.
Based on the Statistica application package, five data arrays were processed for 85 regions of the Russian Federation for 2014-2018. A three-factor model is obtained, the structure of each of the main components of the factors identified by the method is substantiated, their meaningful interpretation is given.
The results of the assessment of 85 regions’ mortgage potential in the Russian Federation were obtained, the disproportions of their mortgage development were quantitatively and qualitatively assessed.
Recommendations are given for increasing the mortgage potential of regions with low ratings (level C). These areas, together with the proposed approaches to their practical implementation, can serve as the basis for a model of state support for regional mortgage markets.
In general, the proposed approach will make it possible not only to assess the “depth” of regional mortgage markets based on the calculation and subsequent assessment of a complex indicator characterizing the level of the region’s mortgage potential, but also to methodologically substantiate options for management decisions aimed at the growth of mortgage lending both within individual regions and in the whole country.
Acknowledgments
The reported study was funded by the Russian Foundation for Basic Research, project number 20-010-00654.
Aranaz, M.F. and Marquez, J.A. (2013), ʻIdentifying Regional Differences in the Spanish Mortgage Market with Sheaf Methodology,ʼ Esic Market Economics and Business Journal, 44(3), 159-177. doi: 10.7200/esicm.146.0443.4i.
Cho, M. and Kim, K.-H. (2012), ʻMortgage market, character and trends. Korea,ʼ International Encyclopedia of Housing and Home, 474-481. doi: 10.1016/B978-0-08-047163-1.00158-2.
Davydovich, A., Kresova, N., Kegeyan, S., Shiganova, V. and Syrkova, I. (2019), ʻHousing market of Krasnodar region: Current conditions and development trends,ʼ Innovative Technologies in Environmental Science and Education (ITESE), vol. 135, EDP Sciences.
Dong, F., Wang, X. and Liu, X. (2015) ʻResearch on China’s Mortgage System,ʼ Proceedings of the 2015 International Conference on Construction and Real Estate Management (ICCREM), Lulea, Sweden, 764-772.
Eremenko M.M. and Gareev I.F. (2019), ʻResearch on the relationship between housing construction and sustainable development of territories,ʼ Russian Journal of Housing Research, 6. (3), 333-376. doi: 10.18334/zhs.6.3.41188.
Ge, J. (2014), ʻWho creates housing bubbles? An agent-based study,ʼ Proceedings of the 14th International Workshop on Multi-Agent-Based Simulation, vol.8235 LNAI, 143-150.
Ghosh, A. (2016), ʻDo real estate loans reflect regional banking and economic conditions,ʼ Journal of financial economic policy, 8(1), 37-63. doi: 10.1108/JFEP-09-2015-0050.
Grezina, M.A. (2011), ʻEconomic and mathematical methods for making managerial decisions in the field of mortgage lending,ʼ. Izvestiya SFedU. Engineering sciences, 11 (124), 51-60.
Grodecka-Messi, A. (2019), ʻSubprime borrowers, securitization and the transmission of business cycles,ʼ Canadian journal of Economics-Revue Canadienne d’Economique, 52 (4) 1600-1654. doi: 10.1111/caje.12414.
Guzikova, L. (2017), ʻHow do Housıng Market and Mortgage Solve. The Housıng Problem in the Regıons of Russıa?ʼ In: Regional Studies on Economic Growth, Financial Economics and Management, 319-333. Springer International Publishing. doi: 10.1007/978-3-319-54112-9_21.
Ivashkov, A.O. (2011) ʻClassification of constituent entities of the Russian Federation by the level of potential in the field of development of mortgage lending,ʼ Rossiyskoe predprinimatelstvo, 12(8), 98-103.
Josphat, N.N. (2013), ʻThe effect of mortgage interest rate on the growth of mortgage financing in Kenya,ʼ School of Business, University of Nairobi. [Online], [Retrieved March 15, 2020], http://erepository.uonbi.ac.ke/bitstream/handle/11295/63433/Njongoro_Mortgage%20interest%20rate.pdf?sequence=3&isAllowed=y.
Kaplan, D.H. (1996), ʻWhat is measured in measuring the mortgage market,ʼ Professional Geographer, 48(4), 356–367.
Kharabara, V. (2017), ʻAnalysis of mortgage lending in banks in Ukraine,ʼ Baltic Journal of Economic studies, 3(3), 59-63.
Kieti, R.M. and K’Akumu, O.A. (2018), ʻCritical factors affecting affordability of mortgage housing in Kenya,ʼ Journal of Housing and the Built Environment, 33(1), 111-131. doi: 10.1007/s10901-017-9547-4.
Korosteleva, T.S. (2013), ʻProblems and prospects of housing mortgage lending system in Russia,ʼ Financial Analytics: Science and Experience, 11(149), 32-38.
Kutlukaya, M. and Erol, I. (2016), ʻAnalysis of cross-country variations in the depth of European mortgage markets,ʼ Journal of Housing and the Built Environment, 31(3), 513-543.
Lyapina, I.R., Orlova, S.A., Semenova, E.E. and Stepanova, M.A. (2020), The State and Development of the Real Estate Market. In: Popkova E. (eds) Growth Poles of the Global Economy: Emergence, Changes and Future Perspectives, LNNS, vol. 73, 97-107. Springer, Cham. doi: 10.1007/978-3-030-15160-7_9.
Mogaka, A.J., Mboya, K.J. and Kamau, R.G. (2015), ʻThe influence of macro economic factors on mortgage market growth in Kenya,ʼ Journal of Finance and Accounting, 3(4), 77–85. doi: 10.11648/j.jfa.20150304.13.
Orlov, A.I. (2016), ʻMethods of reducing the dimension of the space of statistical data,ʼ Scientific journal of the KubSAU, 119(05), 92-107.
Patatouka, E. (2014), ʻMortgage Market and Regional Development in Greece: Peculiarities and Consequences,ʼ In: CIST2014 – Fronts et frontières des sciences du territoire, Collège international des sciences du territoire (CIST), Paris, France. 297-306. hal-01353415.
Shkurkin, D.V., Telesh, A.D., Kravchenko, A.G., Kyshkynbai, B.B. and Yarullin, R.R. (2017), ʻMortgage lending in the region: Current state and development prospects,ʼ International Journal of Applied Business and Economic Research, 15(23), 13-24.
Tselin, V. Y. and Korosteleva, T.S. (2020), ʻDifferential Indicator of the Level of Development of the Mortgage System of the Region,ʼ Proceedings of the 35th International Business Information Management Association Conference (IBIMA), ISBN: 978-0-9998551-4-1, 1-2 April 2020, Seville, Spain, 10621- 10631.
Zhgun, T.V. (2013), ʻCalculation of an integrated indicator of the effectiveness of a dynamic system on the example of an integrated assessment of the demographic development of municipalities in the Novgorod region,ʼ Vestnik NovSU, 2(75), 11-16.