Diana Alexandra TOADER, Georgeta VINTILĂ and Ștefan Cristian GHERGHINA
Bucharest University of Economic Studies, Bucharest, Romania
Volume 2021,
Article ID 159931,
Journal of Economics Studies and Research,
10 pages,
DOI: 10.5171/2021.159931
Received date: 3 March 2020; Accepted date: 16 July 2021; Published date: 18 June 2021
Academic Editor: Alexandru Trifu
Cite this Article as:
Diana Alexandra TOADER, Georgeta VINTILĂ and Ștefan Cristian GHERGHINA (2021), “The Impact of Microeconomic and Macroeconomic Factors on Financial Structure: Evidence from United States", Journal of Economics Studies and Research, Vol. 2021 (2021), Article ID 159931,
DOI: 10.5171/2021.159931
This paper explores the microeconomic and macroeconomic drivers of financial structure, through a sample of 30 technology companies listed on the New York Stock Exchange, over the period 2005-2018. The financial structure was assessed via long-term debt rate, short-term debt rate and total debt rate, whereas the size of the company, tangibility of assets, growth opportunity, effective tax rate and financial return were selected as microeconomic factors, alongside macroeconomic indicators concerning interest rate, inflation rate and gross domestic product per capita. The empirical outcomes by means of panel data regression models provided support for a positive influence on financial structure of natural logarithm of total assets, financial return, effective tax rate, interest rate and gross domestic product per capita. However, tangibility of assets showed mixed associations with financial structure, while sales variation and inflation rate proved to lack any statistical significance.
Keywords: Financial Structure, Microeconomic and Macroeconomic Factors, Panel Data Regression Models
Introduction
The financial structure of companies differs in the emerging and developed countries. In some countries, the financial system is oriented towards the bank-based market, while in other countries, it is oriented towards the capital market. In the specialized literature, there are studies that capture the differences regarding the financial structure using culture, history, politics, and legislation as analysis factors. And yet, the influence of these factors remains unclear, despite the existence of many empirical studies on this topic. One explanation could be that most studies focus on proving a certain theory. Nevertheless, up to the present moment, no clear delineation between the strengths and weaknesses of the theories can be made.
Most studies on financial structure have focused on non-financial companies with access to the American capital market or other international markets. These companies have a variety of financing sources to choose from and can be adjusted at a relatively low cost. Researching financing strategies emphasizes the importance of agency costs, information asymmetry and taxes. The question remains if these factors have a major effect on the debt/equity ratio. Most of the investments of the American companies were financed from internal funds. External financing covers less than 20% of investments, and a large part of this is represented by loans. Of course, there are companies that focus strongly on the issue of shares, but they tend to be smaller, riskier and with a faster development rate.
The debt ratios of listed US companies vary by industry. For example, oil companies have relied on loans as external financing, while those in the pharmaceutical industry have negative debt ratios, which have large holdings of cash and market securities. In general, debt rates are low or negative when profitability and business risk are high (Myers, 2001).
In the technology industry, where companies are constantly innovating and evolving, having to meet the needs of consumers, which are always changing, creates a high level of risk and profitability. Therefore, it is of utmost importance to study what financing strategies these companies choose to adopt given this highly competitive and volatile market. This paper sets out to analyze what factors influence the financial structure of technology companies listed on the New York Stock Exchange.
Literature Review
There are many theories in the literature regarding the financial structure, but only few of them have been positively evaluated by critics. The trade-off theory (Kraus and Litzenberger, 1973), one of the most important theories, argues that capital structure is characterized by a trade-off between the benefits of borrowing and its costs. Thus, the company should balance the fiscal benefits, due to debt financing, with the related costs, which increase the risk of bankruptcy. From an agent theory perspective (Jensen and Meckling, 1976), indebtedness can reduce agency costs by disciplining managers to act in the firm’s interest, to the detriment of their own interest. Although the debt mitigates, on the one hand, the conflict between managers and shareholders, it can intensify, on the other hand, the conflict between shareholders and creditors.
The pecking order theory is based on the ordering of the sources of financing under the conditions of information asymmetry, namely: internal sources, non-risky debts and issue of shares. From the point of view of an external investor, the issue of shares is much riskier than the debt; he can perceive the company as a solid one. However, a rational investor should reassess the value of the shares when announcing the issue. From the employee’s perspective, internal funds are a much safer and more favorable source when it is possible to use them. If their level is not tailored to their needs, then they will have to reorient themselves to loans, the issuance of shares being used ultimately.
From the mid-1980s to the present, there have been many empirical researches that aimed to compare and distinguish the predictive powers of the famous theories, the most common being those formulated as a comparison between the trade-off theory and the pecking order theory. While older works have focused on developed markets, such as the US, recent ones have focused on testing theories in the context of emerging economies. However, the evidence from both categories of studies is quite mixed, some supporting the trade-off theory, while others support the pecking order theory. The researchers tried to modify or improve existing theories, develop new ones, and use different types of data and methods, in order to resolve this controversy between the two theories. Despite considerable progress, this subject has not yet been clarified.
A list of factors that are claimed to have some influence on the capital structure can be extracted from the literature. Rajan and Zingales (1995) used four independent variables in their paper: profitability, tangibility, size, and growth. These firm-specific variables are explained below.
Profitability
The trade-off theory supports a positive relationship between profitability and debt. Profitable companies have lower costs in terms of financial distress and consider that tax deductions are much more valuable (Han-Suck, 2005). The pecking order theory highlights a negative relationship between profitability and debt, as profitable firms tend to reinvest profit to sustain investments, to the detriment of external financing (Titman and Wessels, 1988), (Rajan and Zingales, 1995), (Krishnan and Moyer, 1996). From the point of view of agency costs, debts involve a smaller free cash flow available to managers.
Tangibility
The trade-off theory supports a positive relationship between the tangibility of assets and debt. This is due to the fact that tangible assets can be offered as collateral, and at the same time, they suffer a lower value loss if the company faces financial distress (Rajan and Zingales, 1995). The pecking order theory considers that there is a negative relationship between the tangibility of assets and debt (Demirguc-Kunt and Maksimovic, 1999). The low information asymmetry associated with the tangibility of assets causes a decrease in the issue of shares costs. Thus, debt rates should be lower for firms with high tangibility.
Size
The trade-off theory states that there is a positive relationship between firm size and debt. Larger companies are more diversified, and thus have a lower default risk. Older firms in the market with a better reputation have lower agency costs in terms of debt. Thus, this theory states that larger firms tend to have more debt (Rajan and Zingales, 1995), (Han-Suck, 2005), (Psillaki and Daskalakis, 2008). The pecking order theory opposes the previous theory and supports a negative relationship between size and debt. Large companies have the ability to use internal funds, but also have the opportunity to issue shares more easily compared to small firms (Alipour and Mohammadi, 2015).
Growth
The trade-off theory predicts a negative relationship between firm growth and debt. Intangible assets of growing companies may lose much of their value in the event of financial distress. At the same time, growth reduces the problems of free cash flow. In opposition, the pecking order theory states a positive relationship between the two variables. Internal funds are insufficient to support the investment opportunities of the growing companies, which causes an increase in the demand for external financing. Most empirical studies have shown that there is a negative relationship between growth and debt (Alipour and Mohammadi, 2015), (Cortez, 2012).
In addition to the firm-specific factors, macroeconomic factors are of particular importance, thus, many studies, including Deesomsak et al. (2004) and De Jong et al. (2008), have shown that economic stability has a considerable effect on the financial structure.
Inflation
According to Taggart (1985), the characteristics of the US tax code determines the increase of the real value of the tax deductions regarding the interest expenses when it is estimated that the inflation will be high. Thus, the trade-off theory predicts a positive relationship between debt and inflation. In contrast, according to the pecking order theory, it is difficult to observe the effect of inflation on financial decisions (Frank and Goyal, 2008).
The Gross Domestic Product
The growth of the gross domestic product can be regarded as a measure of the growth possibilities available for companies in an economy. In a developing economic environment, the shortfall of tangible assets in relation to the available investment opportunities implies a great loss of value in the event of financial distress. Thus, the trade-off theory highlights a negative relationship between debt and gross domestic product growth. In contrast, the pecking order theory emphasizes a positive relationship between the two variables, because a large proportion between growth opportunities and internal funds implies a greater need for external funding (Köksal and Orman, 2015).
The objective of this paper is to analyze how the above mentioned factors influence the financial structure of the company. For this, it is necessary to formulate hypotheses, which will subsequently be affirmed or rejected.
Hypothesis 1 (H1): There is a positive relationship between the size of the company and debt ratio;
Hypothesis 2 (H2): There is a positive relationship between the tangibility of assets and debt ratio;
Hypothesis 3 (H3): There is a negative relationship between the growth opportunity and debt ratio;
Hypothesis 4 (H4): There is a positive relationship between the tax rate and debt ratio;
Hypothesis 5 (H5): There is a negative relationship between the financial return and debt ratio;
Hypothesis 6 (H6): There is a negative relationship between the inflation rate and debt ratio;
Hypothesis 7 (H7): There is a negative relationship between the interest rate and debt ratio;
Hypothesis 8 (H8): There is a positive relationship between the GDP and debt ratio;
Data and Methodology
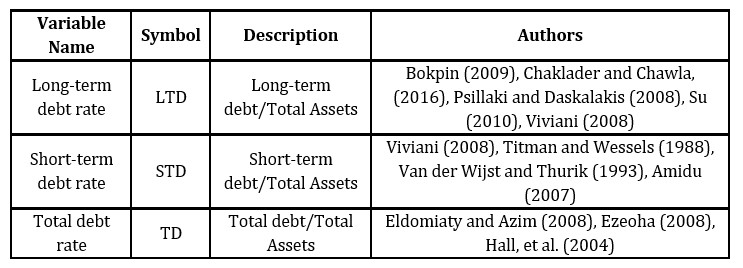
To measure debt, three indicators were used, namely, the total debt rate, long-term debt rate and short-term debt rate. According to Rajan and Zingales (1995), the ratio of debt to assets explains much better than the ratio of debt to liabilities, because it clearly indicates whether the company is about to collapse, and at the same time provides a much clearer picture of past financial decisions.
The database consists of 30 companies listed on the New York Stock Exchange, which are part of the technology sector. Financial data was collected over the period 2005-2018, from Thompson Reuters and The World Bank databases, the last one being required for macroeconomic variables.
The following table shows the three dependent variables included in the analysis. The estimation of the equations on each variable highlights the influence of the independent variables on the debt structure
Table 1: Dependent variables included in the empirical study
Source: Author’s own work
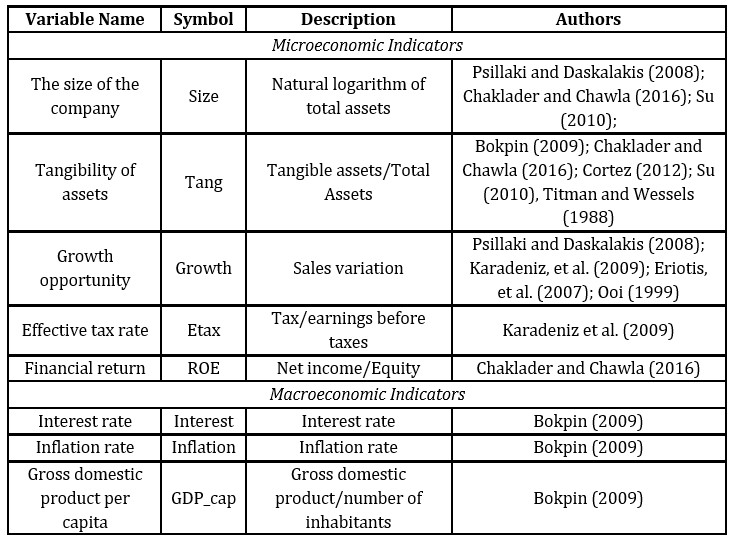
The following table includes the independent variables, classified into two categories, namely, firm-specific/microeconomic and macroeconomic factors.
Table 2: Independent variables included in the empirical studySource: Author’s own work
The influence factors will be studied based on the multiple regression model, using the least squares method, the data being of panel type.
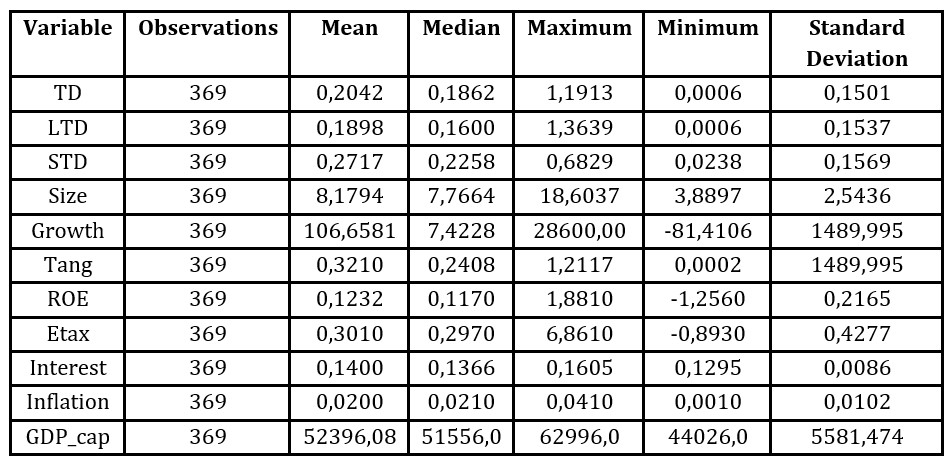
The table below presents the descriptive analysis of the dependent and independent variables. The average total debt ratio stands at 20%, underlining the fact that firms use other sources of financing, such as internal funds or equity issues. The median is below the average for all the three types of debt. This divergence is accentuated by the short-term debt rate. Thus, most companies prefer to borrow for short term rather than long term. Moreover, the growth variable has the largest variance, the mean being significantly higher than the median.
Table 3: Descriptive statistics
Source: Author’s own work in Eviews 10
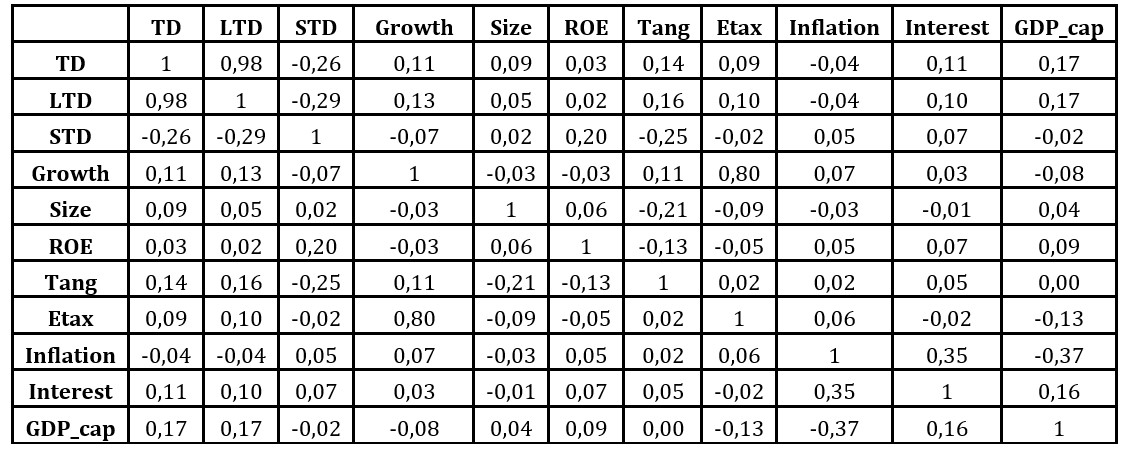
According to Table 4, the rate of financial return is around 12% and is positively correlated with all the three dependent variables. The size variable and the interest rate are also positively correlated with the dependent variables. The tangibility of assets and growth opportunity are negatively correlated only with the short-term debt ratio. According to Table 3, the technology sector is in full development, and from the statistical point of view, the average growth is 106%. The inflation rate is negatively correlated with the total and long-term debt, while the gross domestic product per capita is negatively correlated only with the short-term debt rate.
Table 4: The correlation matrix
Source: Author’s own work in Eviews 10
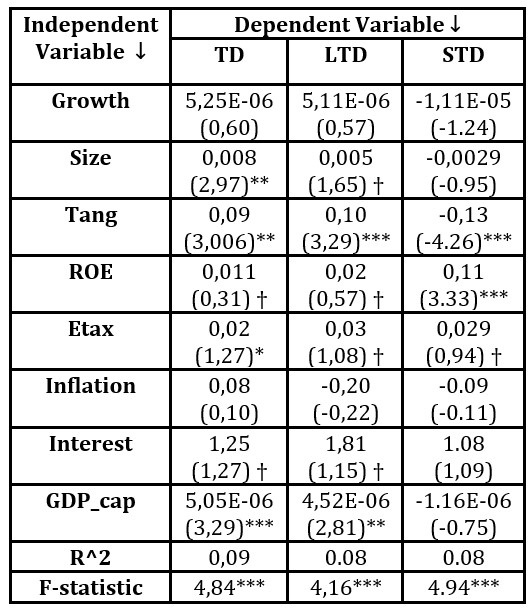
After estimating the regressions for the three dependent variables, the coefficients were obtained, as presented in Table 5.
The growth variable was positive in relation to the variables, but statistically insignificant, thus, the previously formulated hypothesis is rejected.
Chaklader and Chawla (2016), Psillaki and Daskalakis (2008) also obtained an insignificant relationship between the variables, while Cortez (2012) obtained a negative relationship.
The inflation rate also presents a statistically positive and insignificant relationship with the three variables, which suggests the rejection of hypothesis H6. The variable of size has positive and statistically significant coefficients in relation to the total debt and long-term debt rate. In relation to the short-term debt ratio, the coefficient is negative, but not statistically significant. Thus, the first hypothesis can be accepted, supporting the trade-off theory, according to which, there is a positive relationship with the debt ratio, because larger and more diverse firms tend to have more debt. The tangibility of the assets has positive significant coefficients in relation to total debt rate and long-term debt rate. The second hypothesis is accepted, and the trade-off theory proves to be applicable again. According to Table 3, companies in the technology sector, which have an average tangibility of assets about 32%, offer tangible assets as collateral for contracting bank loans. The financial return variable was statistically positive and significant compared to the three dependent variables. In this case, it is necessary to reject hypothesis 5 which supported a negative relation, and at the same time, to highlight the applicability of the trade-off theory. The effective tax rate has a positive and statistically significant relationship with all the three dependent variables, hence, the fourth hypothesis is accepted. As a result of a high effective tax rate, companies will benefit from substantial tax deductions when they are indebted. The interest rate has positive and significant coefficients, less compared to the short-term debt ratio; therefore, hypothesis 7 is rejected. The gross domestic product per capita is also statistically significant and positive, in relation to the total and long-term debt ratio. Hypothesis 8 is therefore accepted, but in this case, the pecking order theory proves its applicability. However, companies with high investment opportunities also need external financing.
Conclusions
In this paper, the influence of the main factors, such as size, growth, profitability, and tangibility, on the financial structure, was sought. The results show that tangibility, profitability, size, effective tax rate, interest rate and gross domestic product per capita are relevant determinants. The positive coefficients of the variables on total debt rate and long-term debt demonstrate that companies in the technology sector rely on debt financing. These findings are consistent with the trade-off theory. On the short-term level, tangibility and gross domestic product per capita have a negative impact. In this case, the applicability of the pecking order theory is confirmed. Therefore, the firm-specific variables, as well as the macroeconomic variables, impact debt ratios differently. Technology companies have various financing strategies to leverage, such as venture and bank debt. It seems that, companies, in order to financially support their operations, have no retainers to borrow.
The capital structure is determined not only by many firm-specific factors, such as business risk, but also by industry-specific and macroeconomic factors, as shown in this paper. Economic stability is reflected in the proper functioning of companies, having an effect on their financial decisions. This empirical study is limited, because the database is made up of a small number of companies over a relatively short period of time. This topic can be extended in many directions in the future.
According to the literature, mixed results have been obtained regarding the applicability of theories. Of course, in this case, the trade-off theory has proven to be far more relevant than the pecking order theory. Thus, the controversy among the two theories is far from clear.
Acknowledgment
This paper was co-financed by The Bucharest University of Economic Studies during the PhD program.
Alipour, M. and Mohammadi, M. F. S. D. H., (2015), ‘Determinants of capital structure: an empirical study of firms in Iran’, International Journal of Law and Management, 57 (1), 53-83.
Amidu, M., (2007), ‘Determinants of capital structure of banks in Ghana: an empirical approach’, Baltic Journal of Management, 2(1), 67-79.
Auerbach, A., (1985), ‘Real determinants of corporate leverage’, University of Chicago Press, 301-324.
Bartholdy, J. and Mateus, C., (2008), ‘Taxes and corporate debt policy: evidence for unlisted firms of sixteen European countries’, l.: SSRN.
Barton, S., Hill, N. and Srinivasan, S., (1989), ‘An empirical test of stakeholder theory predictions of capital’, Financial Management, 18(1), 36-44.
Bas, T., Muradoglu, G. and Phylaktis, K., (2009), ‘Determinants of Capital Structure in Developing Countries’, Cass Business School, London.
Bokpin, G. A., (2009), ‘Macroeconomic development and capital structure decisions of firms, Evidence from emerging market economies’, Studies in Economics and Finance, 26 (2), 129-142.
Chaklader, B. and Chawla, D., (2016), ‘A Study of Determinants of Capital Structure through Panel Data Analysis of Firms Listed in NSE CNX 500’, SAGE Publications, New Delhi.
Cortez, M. A., (2012), ‘The Determinants of Corporate Captal Structure: Evidence From Japanese Manufacturing Companies’, Journal of International Business Research, 11 (3), 121-134.
De Jong, A., Kabir, R. and Nguyen, T. T., (2008), ‘Capital structure around the world: The roles of firm and country specific determinants’, Journal of Banking & Finance, 32 (9), 1954-1969.
Deesomsak, R., Paudyal, K. and Pescetto, G., (2004), ‘The determinants of capital structure: Evidence from the Asia-pacific region’, Journal of Multinational Financial Management, 14 (4-5), 387-405.
Demirguc-Kunt, A. and Maksimovic, V., (1999), ‘Institutions, financial markets and firm debt maturity’, Journal of Financial Economics, 54 (3), 295-336.
Eldomiaty, T. and Azim, M., (2008), ‘The dynamics of capital structure and heterogeneous systematic risk classes in Egypt’, International Journal of Emerging Markets, 3 (1), 7-37.
Eriotis, N., Vasiliou, D. and Ventoura-Neokosmidi, Z., (2007), ‘How firm characteristics affect capital structure: an empirical study’, Managerial Finance, 33 (5), 321-331.
Ezeoha, A., (2008), ‘Firm size and corporate financial-leverage choice in a developing economy evidence from Nigeria’, The Journal of Risk Finance, 9 (4), 351-364.
Frank, M. Z. and Goyal, V., (2008), ‘Trade-off and pecking order theories of debt’, Handbook of Empirical Corporate Finance, 1, 135-202.
Graham, J., (1996), ‘Debt and the marginal tax rate’, Journal of Financial Economics, 41 (1), 41-73.
Hall, G., Hutchinson, P. and Michaelas, N., (2004), ‘Determinants of capital structures of European SMEs’, Journal of Business Finance & Accounting, 31 (5-6), 711-728.
Han-Suck, S., (2005), ‘Capital Structure Determinants: An Empirical Study of Swedish Companies’, The Royal Institute of technology, Stockholm.
Jensen, M. and Meckling, W., (1976), ‘The Theory of the firm: Managerial Behavior, Agency Costs and the Ownership Structure’, Journal of Financial Economics, 3 (4), 305-360.
Jordan, J., Lowe, J. and Taylor, P., (1998), ‘Strategy and financial policy in UK small firms’, Journal of Business Finance & Accounting, 25 (1-2), 1-27.
Karadeniz, E., Kandir, S., Balcilar, M. and Onal, Y., (2009), ‘Determinants of capital structure: evidence from Turkish lodging companies’, International Journal of Contemporary Hospitality Management, 21 (5), 594-609.
Kim, W. S. and Sorensen, E. H., (1986), ‘Evidence on the Impact of the Agency Costs of Debt on Corporate Debt Policy’, The Journal of Financial and Quantitative Analysis, 21 (2), 131-144.
Köksal, B. and Orman, C., (2015), ‘Determinants of capital structure: evidence from a major developing economy’, Small Business Economics, 44 (2), 255-282.
Kraus, A. and Litzenberger, R., (1973), ‘A State-Preference Model of Optimal Financial Leverage’, Journal of Finance, 28 (4), 911-922.
Krishnan, S. V. and Moyer, C. R., (1996), ‘Determinants of capital structure: An empirical analysis of firms in industrialized countries’, Managerial Finance, 22 (2), 39-50.
Myers, S. C., (2001), ‘Capital Structure’, Journal of Economic Perspectives, 15 (2), 81-102.
Psillaki, M. and Daskalakis, N., (2008), ‘Are the determinants of capital structure country or firm specific?’, Springer Science+Business Media, LLC., 319-333.
Rajan, R. G. and Zingales, L., (1995), ‘What Do We Know about Capital Structure? Some Evidence from International Data’, The Journal of Finance, 1 (5), 1421-1460.
Smith, C. and Warner, J., (1979), ‘Bankruptcy, secured debt, and optimal capital structure:comment’, Journal of Finance, 34 (1), 247-251.
Stulz, R. and Johnson, H., (1985), ‘An analysis of secured debt’, Journal of Financial Economics, 14 (4), 501-521.
Su, L., (2010), ‘Ownership structure, corporate diversification and capital structure evidence from China’s publicly listed firms’. Management Decision, 48 (2), 314-339.
Taggart, J. R. A., (1985), ‘Secular patterns in the financing of US corporations’, University of Chicago Press, 13-80.
Titman, S. and Wessels, R., (1988), ‘The determinants of capital structure choice’, Journal of Finance, 43 (1), 1-19.