Oleg N. Zhilkin1, Wilmer P. Chavarry G.2 and Diana P. Chavarry3
Russian Peoples’ Friendship University Miklukho-Maklaya Street, 6, Moscow, 117198, Russia
Volume 2021,
Article ID 626027,
Journal of Economics Studies and Research,
11 pages,
DOI: 10.5171/2021.626027
Received date: 27 October 2020; Accepted date: 11 February 2021; Published date: 26 May 2021
Academic Editor: John Fredy Escobar Gómez
Cite this Article as:
Oleg N. Zhilkin, Wilmer P. Chavarry G. and Diana P. Chavarry (2021), “Seeking for A Development Strategy for Peru In A Volatile Global Economy", Journal of Economics Studies and Research, Vol. 2021 (2021), Article ID 626027, DOI: 10.5171/2021.626027
This article assesses the possibility of improving the development of the external economic sector in Latin America as a whole and in Peru in particular, by analyzing the theory of international trade and current economic trends in the world. By using statistics from the foreign trade sector and considering global trends in the international trade over the past decade, a special emphasis on the period 2019-2020 assesses Peru’s ability to meet the growing differentiated demand, and thus, specialize in advantageous sectors, allowing them to integrate into global supply chains, providing resources (such as inputs or final products), goods and services at different market levels. According to the agency specialized in commercial intelligence, “Fresh Fruit”, Peru is among the top 20 food suppliers in the world. Taking into account this potential and its diversified offer, it has been determined that there is a real possibility of creating value chains around the niches of the market that exist within the global trade. This study uses the comparative advantage theory as a basis for quantifying the competitiveness of products from global comparisons, which allows us to indicate how to move towards a higher level of specialization in the production and exporting structure (Lauterbach, 2015). As a result, twenty products were obtained with a positive trend in their exports, and twelve products that, despite having lower figures in their exports, have a higher growth potential.
Keywords: International Commerce, Comparative Advantages, Exports, Latin America, Peru.
Introduction
This article aims to reflect on the importance of international trade in Latin American countries in identifying the types of production (products, goods, or services) and exchanges that must be made to achieve sustainable economic benefits. To this end, the theory of international trade and its model of comparative advantages are studied.
In the macroeconomic framework, according to IMF data, Peru, in 2018, managed to raise the total exports to $48.09 billion (+7.5% in 2017), thus achieving an all-time record for Peruvian exports. This growth is explained by the remarkable growth of the non-traditional sector, which reached $13.2 billion (+12.6% compared to 2017). In December 2019, Peruvian exports totaled US$ 45,985 million, a 4.2% fall from December of the previous year. The growth projection for 2020 has gone substantially down with -14% of the GDP, and with a drop of US$9,058 million in the imports and a fall of US$ 8,304 million in the exports, all due to the low external demand generated by the quarantine period in the world together with the long confinement of 3 months and 14 days that have overshadowed the important economic support plan implemented by the government in Peru, and which caused significant job losses.
Despite the significant macroeconomic gains over the past decade, the economy has not yet emerged from its middle-income trap and has not significantly raised its median income range. This result is due to Peruvians owning only a small part of the domestic economic growth, and the continued dependence on the natural resource market state industry. This is because the Peruvian economy is open, which means it is highly susceptible to fluctuations in the external environment, as in the 2014 crisis.
Based on the above, the implementation of structural reforms related to greater diversification of the economy into more promising sectors will lead to an increase in new highly skilled jobs and an increase in value-added exports, which will reduce the dependence on the external demand for raw materials (Lauterbach, 2015).).
In this context, and given the current composition of the Peruvian export basket, this study seeks to identify export products with potential for international trade. To this end, the study considers two important elements. First, it analyses those types of products in which the country has gained comparative advantages in recent years and which would benefit from meeting the growing global demand. Second, products that have the lowest share in the export basket but can continue to grow and gain market dominance over time are evaluated.
For the development of this research, the methodology of the IBCR and IB was applied, which is based on various theories of comparative advantages that have emerged over the years. As a result, a study was conducted based on thirty-two products, as mentioned above.
As a result of the study, Peru has already been identified as having leading products in the export of goods nationwide, such as copper and gold minerals; agricultural products such as fresh asparagus, dried beans, quinoa, maca, fresh blueberries, sour bark (lemon), fresh mangoes, fresh grapes, fresh mandarins; frozen marine products such as cuttlefish, squid and pota; and textile products such as fine vicuña and alpaca wool, among others. However, the export offer is much larger and leaves room for international trade in other products with comparative advantages, such as jewelry, gemstones or semi-precious, agricultural seeds, styrene polymer residues, and other products that offer hidden comparative advantages.
Peru and its Impact on the International Market
For a better study of Peruvian exports, it is important to understand the definition of the terms traditional products and non-traditional products. Traditional exports basically include mining, agricultural, hydrocarbons, and fishmeal products determined by the Supreme Decree 076-92-EF1. Other tariff headings which are not rated in that standard are considered non-traditional exports and are products that tend to have a higher added value. These non-traditional exports are grouped into agriculture, textiles, fisheries, wood and paper, chemicals, metal-mechanics, metallurgical-steel and jewelry, non-metallic mining, and others.
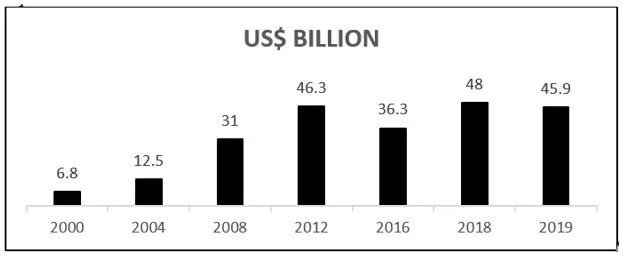
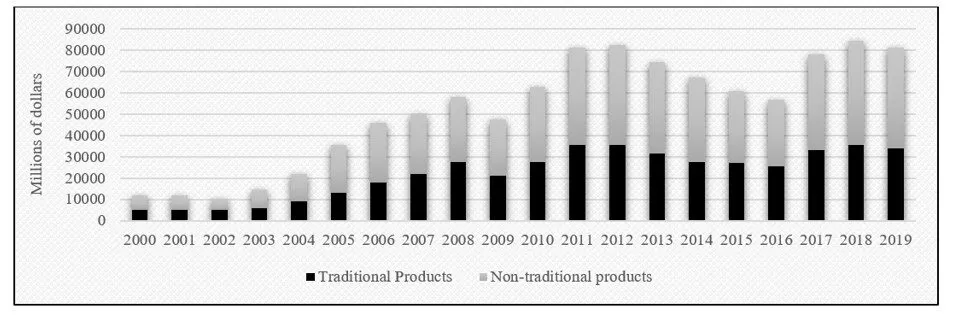
In recent years, Peru has consistently been raising its export volumes, becoming historic (see Figure 1). In 2019, it achieved exports equivalent to $45.9 billion. But not only have its volumes improved, but the export supply has diversified as well. The growth was impressive; in 2000, exports of only 12 non-traditional products worth more than $30 million (mainly metal and clothing production) were recorded; while in 2019, this indicator increased to 72 products, with the most exported being agricultural products.
Figure 1: The year 2019, the third-best historica performance of Peruvian Exports (billions of dollars)
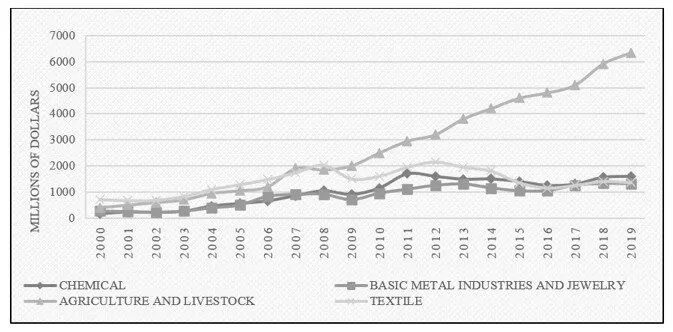
In 2000, the value of agricultural exports reached $644 million; in 2019, this figure increased to US$6341 million, according to BCRP (2020) (see Figure 2). In 2019, a record of non-traditional exports was recorded by shipments of 732 products worth $13.791 billion, with 4.1% more than the previous year.
Figure2: Peru, Evolution of non-traditional exports (2000-2019) (million dollars)
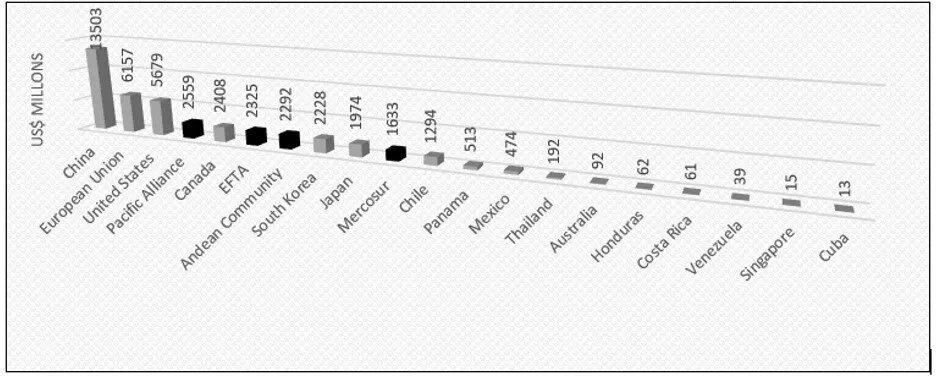
The country’s progress in new exported goods and target markets is based on the 20 trade agreements in force (see Figure 3), such as the free trade agreements with China (in 2019, China imported Peruvian products for a figure equivalent to $13.5 billion), the European Union, the United States, Mexico, and Chile, allowing Peruvian products access to 54 international markets, mostly transported by sea (89.1%, PROMPERU source). According to PROMPERU data, currently, 49.1% of the world’s population has access to Peruvian products.
Figure 3: The volume of Peruvian exports through the Network of Existing Trade Agreements (millions of dollars)
Source: Built by the data-driven author of the Central Reserve Bank of Peru.
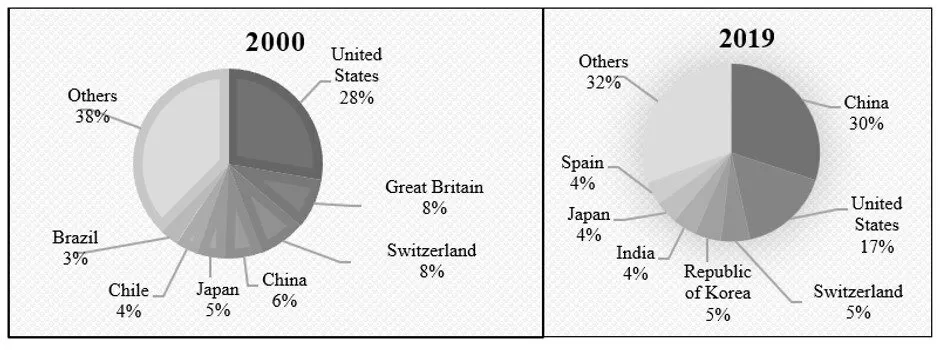
In terms of target markets, based on 2019 information, four countries concentrated about 57% of Peruvian exports: 30% focused on the Chinese market, while the United States accounted for 16.6%, Switzerland 5.3%, and the Republic of Korea 4.8% supply Peruvian products. Other major markets include India (4.4%), Japan (4.2%) and Spain (4.2%), among others. (See Figure 4).
China is the main destination market for traditional exports, mainly mining (38%) and fisheries (47%); while the United States is the main destination for non-traditional exports, including textiles and clothing (50%) and agribusiness (32%) (Mincetur, 2017).
In addition, 88.7% of the Peruvian exports, which were covered by preferences under existing free zones, include markets in China, the United States, the European Union, South Korea, the Andean Community, EFTA, and Mercosur, among others.
However, there is a concentration of overseas deliveries in both products and markets. It is, therefore, necessary to identify and stimulate new production activities, which are an additional factor in the economic growth, which allows to diversify the export basket and integrate it into global value chains (Production, 2014).
Figure 4. Peru: Major export destinations, 2000 and 2019 (in percents)
It should be noted that Peru, in recent years, has become a world and regional leader in the export of non-traditional products. Peru is now the world’s leading exporter of blueberries, asparagus, dye lacquers, quinoa, Clinker cement, and drilling machines, and this is due to the policy of diversifying the target markets. Peru is the second-largest export site in the world of mandarins, pre-cooked pot, fan shells, unsalted zinc, surgical sutures, safety glass, plates, and tiles. It is the third place in the export of paprika, avocado, calcium phosphate, anchovy preserves, and preserved olives. It holds the fourth place in Canned Palmitos, Zinc Oxide and Boron Oxide, and the fifth place in the export of grapes, copper hydrogen oxide, and copper oxychloride.
Peru records the production of the agribusiness and non-traditional fisheries sectors. Currently, 732 domestic products are exported.
The main non-traditional products that reached an export record in 2019 are grapes (8%), blueberries (51%), battered (4%), frozen raw pot (65%), fresh mangoes (1.5%), frozen precocidal pot (5.5%), silver aleada (200%), mandarin (128%), ethyl alcohol (80%) and prawns (54%).
These 12 products account for 30% of the total exported in value-added products.
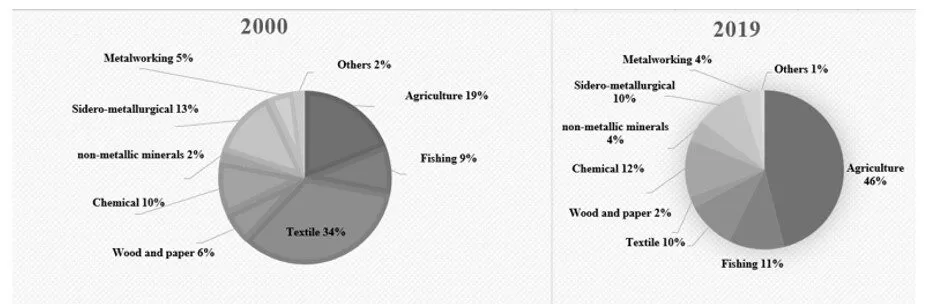
A wider inclusion of products in the exported supply has been seen, with an emphasis on a higher proportion of agricultural products (43.5%), chemicals (11.8%), textiles (10.8%), steel (9.8%), and others. However, it is noted that higher export volumes remain focused on natural resources and low value-added products.
Concerning the above, the IMF (2019) notes that exports from Andean countries are concentrated in the extractive sector, mainly in the oil and mining industries, affecting other exports, contributing to the strengthening of non-reimbursable exports with low productivity (“Dutch disease”) and low competitiveness at the international level. (See Figure 6).
In recent years, Peru, as part of a strategy to consolidate the revenues of its products in various markets, has initiated negotiations on free trade agreements with countries with which it has had a wider trade to seek greater permanent benefits for Peruvian products and take advantage of expanded market opportunities (Mincetur, 2018).).
Figure 6: Peru: Exports of the main groups of non-traditional products, 2000 and 2019 (in percentage)
As for the export of non-traditional products, Peru recorded sales of a total of $2.044 million in 2000 (BCRP, 2018), establishing various products among the main deliveries, such as cotton shirts, asparagus, copper wire, thin gimbal hair, cotton shirts, zinc and wood alloys, and others. Trade opening and the search for new markets allowed non-traditional exports to reach 13,783 million in 2019 (BCRP, 2020), representing an increase of 674% compared to 2000, mainly due to higher sales of leading agricultural products in qualification. (See Figure 7)
Figure 7. Peru: Total exports 2000-2019 (million dollars)
Source: Built by the data-driven author of the Central Reserve Bank of Peru.
Relative specialization in the field of natural resources is required, as well as a sectoral policy of diversification of production aimed not only at adding value to potential sectors, but also ensuring that the country develops productively and integrates small products (Ghezzi, 2018).
In this context, based on information on international trade operations, the following are those products (traditional and non-traditional) in which Peru gained comparative advantages in the period 2010-2016 and which should continue to contribute to the diversification of the economy and the achievement of longer-term economic growth. Although the country has great potential that has not yet been fully used, there is a risk of losing significant progress if it stagnates or makes a mistake in continuing to export predominantly traditional products.
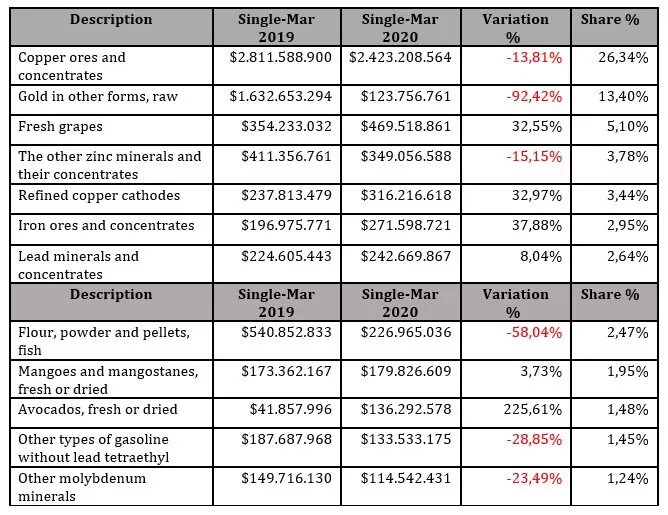
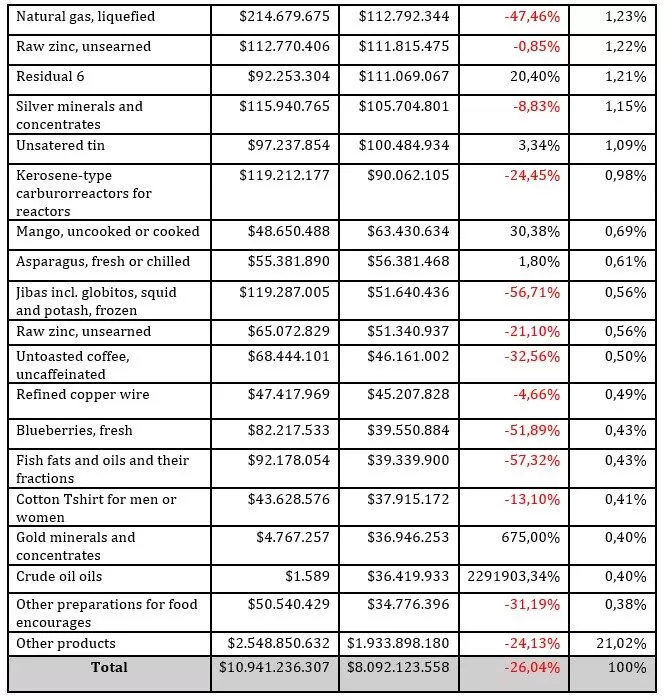
Variation in Peruvian exports in the first quarter of 2020.
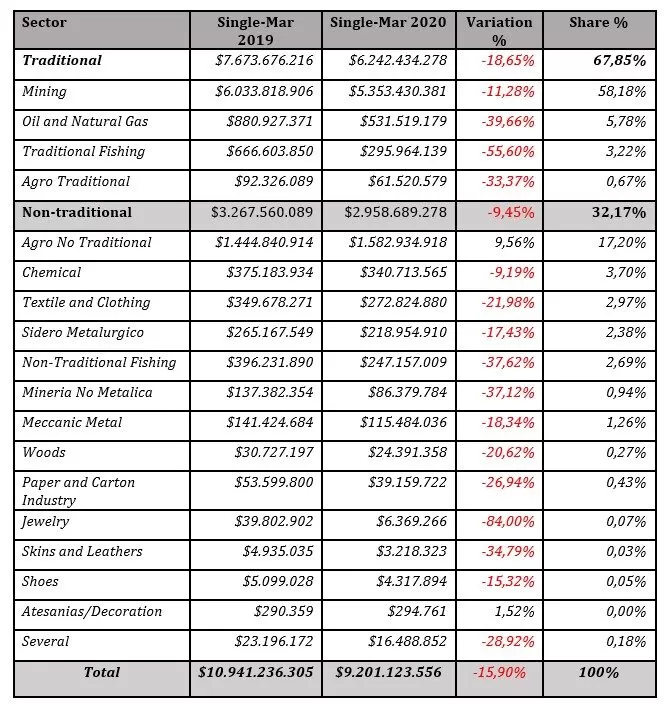
Table 1: Exports of Traditional and Non-Traditional Products 2020
Source: Built by the author based on Comtrade data.
On the other hand, China positioned itself as the top destination during the period mentioned in 2020, although shipments to that market decreased by 21.64%, compared to the previous year. The second target market is the European Union, with a 9.16% decrease; followed by the United States, 10%. In Table 2, it can be seen that within the top 15 destinations, exports to South Korea, Chile, the United Arab Emirates, and Mexico were the only ones that increased. It is also shown that, in 2019, Switzerland was positioned as the fourth main destination; however, in 2020, it moved down to the 8th place. Japan had a similar performance , which dropped a spot.
Research Methods
The methodological process developed was based on international commercial information from different platforms such as Contrade, the Strategic Research Center of Peru, INEI (Peruvian Institute of Statistics and Informatics), World Bank, RBC Daily Business Newspaper, and others, as well as studies conducted by different Peruvian and Russian authors, among others, who have provided detailed access to the main data on world foreign trade, as along with the analysis of international trade data.
This has given access to the exports and imports that Peru and Latin American countries have made to the different markets, and in turn, has identified exports of each Peruvian product to the world during the period 2010-2020.
After the collection of data and working in the function of the method of comparative advantages, the identification of potential products, which have progressive growth for the study period, was carried out. Peruvian products have then been compared with those of other countries, through the calculation of The Relative Trade Balance (IBCR) indices; a step in which the countries with which Peru shows a comparative advantage could be quantified and identified. The Balassa Index (IB) and the Standard Balassa Index (IB) were then calculated, identifying products that have not yet become potential but have great prospects for improvement in the international market.
And at the end of the study, the variation was measured, and how Peruvian and Latin American exports of the products identified as potentials of the years 2019 and 2020 have been affected in their first quarters.
Results
Traditional and non-traditional products where a comparative advantage was found with the rest of the world.
Table 2: Peruvian exports, main products, January to March 2019 and 2020. FOB value expressed in US$
Source: Built by the author based on Comtrade data.
In recent years, the instability of the international market has been demonstrated by the latest global crises that significantly affected the region, such as the 2007-2008 financial crisis which generated a global contraction of 2.9%, the China-U.S. trade war that began in 2018, and now in 2020, the crisis caused by the COVID19 pandemic generated an estimated global contraction of 6.2%. However, there have been other important events that opened new markets to Latin America, such as sanctions on Russia by the United States and the European Union, from the war with Ukraine in 2014, opening a new market with great opportunities, demonstrating the volatility of the global economy. Another important factor in the countries of the region is the little differentiated demand that each Latin American country has.
This is why it is proposed to create an International Trade Strategy for the region, taking into account the comparative advantages of each country.
Taking Peru into account as an example of a study, using the theory of comparative advantage and international trade data, it became possible to determine a list of thirty-two products that have comparative advantages over the countries of the region and the world, of which , twenty products (traditional and non-traditional) were identified, which increased overseas sales 2010, until the first quarter of 2019. Although the other twelve products are with low export volumes, they have great growth potential.
Traditional products based on natural resources that Peru exported between 2010-2020. with greater participation in the trade in these products. This allows you to obtain a positive IBCR, which expresses advantages in trades.
Such products include copper, gold, zinc, silver, lead, molybdenum, fishmeal and fish oil, natural gas, and coffee. It is necessary to take into account the regional strategy, which will allow the export of more complex, specialized, and diverse products to increase not only its competitiveness but also to make the economy less vulnerable to fluctuations in the prices of exported goods.
Non-traditional products with higher added value and exported to Peru with comparative advantages in the period 2010-2018 consist mainly of agro-industrial products, such as grapes, avocados, asparagus, blueberries, mangoes, bananas, and cocoa, and also unsweet zinc or evaporated milk, which represent a foreign trade dynamic that distinguishes them with a positive IBCR and significant export value in this group. This requires an increase in high logistics costs, high labor standards, and weak transport infrastructure, among other things, in order to distribute the production factors needed to create an industry with a high technological component.
Non-traditional products are needed to restore the export basket and direct it to large global value chains. The following products were identified as non-traditional: green peas, pomegranate, octopus, cocoa butter, wool or fine hair blankets, wool coats, and sweaters, Pisco, onions, zinc, and strawberry products. These products offer the opportunity to stimulate the local development by strengthening production activities with export potential. Indeed, the national plan to diversify production requires the creation of new growth mechanisms, identifying potentials of global value chains, and coordinating efforts in the intersectoral and territorial levels to increase competitiveness.
In turn, the behavior of potential products was evaluated for the first quarters of 2019-2020. It is accepted that the exported products, from the list of the main products, shipments of fishmeal were the most affected, with a drop of 58.04%; followed by fish fats and oils, -57.32%; jibias, -56.71%; and blueberries, -51.89%. On the other hand, exports of crude oils showed a considerable increase, as shown in Table 2. Also, shipments of gold minerals and their concentrates grew with 675%.
In the first quarter of 2020, and according to data from the Lima Chamber of Commerce, Peruvian exports totaled US$ 9,201 million, with a decrease of 15.9% from the same period last year. Within the traditional macro sector (which was down 18.65%), the most affected sector was the traditional sector, whose exports decreased by 55.60%; followed by oil and natural gas, with a drop of 39.66%. For its part, the macro non-traditional sector had a negative variation of 9.45%, in which the most affected sector was the jewelry sector, which had a decrease of 84%; followed by non-traditional fishing, 37.62%.
By the end of the year, according to IMF data, the economic activity is expected to recover gradually, and in 2021, there will be an expansion of 6.5% in the GDP, a figure above Latin American neighboring countries (Chile was second with projected GROWTH according to the IMF of 5%, followed by Colombia with 4%, Argentina 3.9%, Brazil 3.6% and Mexico with 3.3%). Similarly, by 2021, according to BCR data, an increase of US$ 7,336 million in the exports and US$ 5,016 million in the imports is expected.
The comparative advantages that the country has at the level of various types of products allow us to continue to promote investments in these sectors and, in particular, to ensure regional development through productive rates that strengthen the business structure, the development of a competitive logistics infrastructure and a network of suppliers, that can be included in the global value chain, which increases the employment and well-being of the population.
Finally, it should be noted that the theoretical model by which this analysis is justified allows us to identify the leading goods in the export of goods at the national level. However, the export basket is wider and leaves room for international trade in other products with comparative advantages, such as jewelry, gemstones or semi-precious, seeds, handmade paintings and drawings, styrene polymer waste and other identified products, showing the positive trade balancing index and bilateral balance index.
1 The Supreme Decree 076-92-EF defines the list of traditional exports, such as Mining, oil and natural gas, traditional fishing, and traditional agro (cotton, sugar, coffee, etc.). Products that are not within the aforementioned sectors are considered non-traditional products (non-traditional agro, chemical, textile and clothing, sidero-metallurgical, non-traditional fisheries, non-metallic mining, wood, jewelry, etc.).
Central Reserve Bank of Peru (2018). Series of statistics. Central Reserve Bank of Peru. Consultation date, 05 August2019.https://estadisticas.bcrp.gob.pe/estadisticas/series/
Central Reserve Bank of Peru (2018). Glossary of economic terms. Consultation date August 05,2019http://www.bcrp.gob.pe/publicaciones/glosario/e.html.
Lima Chamber of Commerce (CCL, 2020). Peruvian exports during the first quarter of 2020. Consultation date, October 10, 2020.https://www.camaralima.org.pe/wp-content/uploads/2020/07/Exportaciones-peruanas-durante-el-primer-trimestre-del-2020.pdf
Peruvian National Center for Strategic Planning (CEPLAN, 2019). Consultation date, 05 September 2019.https://www.ceplan.gob.pe/
CEPLAN, (2019). Productive Potentials in the Territory from an International Trade Perspective. Consultation date, 05 September 2019.file:///C:/Users/PAUL/Desktop/publicatios%20PHD/Potencialidades-productivas-CEPLAN.pdf
The Organization for Economic Cooperation and Development (OECD, 2013), Consultation Date: 30 November 2019. http://www.oecd.org/countries/peru/
Melitz M.J., Mayer T., Ottaviano G. IP. (2014) Market Size, Competition, and the Product Mix of Exporters//American Economic Review 104, n0o. 2, 2014 — pag.495-536.
Melitz M.J., Redding S.J.(2014) Missing Gains from Trade//American Economic Review Papers and Proceedings, 2014
Melitz M.J., Mayer T., Ottaviano G. IP. (2014). Market Size, Competition, and the Product Mix of Exporters//American Economic Review 104, no. 2, 2014 — page.495-.
Mincetur (2017). Regional Trade Report: Incash. Date of consulting, November 15, 2019.https://www.mincetur.gob.pe/wp-content/uploads/documentos/comercio_exterior/estadisticas_y_publicaciones/estadisticas/ reporte_regional/RRC_Ancash_2017.pdf
Mincetur (2018). PERU-U.S. Trade Promotion Agreement Date of consultation, November 15, 2019.http://www.acuerdoscomerciales. gob.pe/index.php?option=com_content&view=category&layout=blog&id=55&Itemid=78
Mincetur (2019). 2020 Budget Support. Sector Foreign Trade and Tourism. Consultation date, September 15, 2020.http://www.congreso.gob.pe/Docs/comisiones2018/Presupuesto/files/m,_de_comercio_exterior.pdf
PROMPERU (2019). Peru’s Export and Tourism Promotion Commission
Richard Gonzalez. [Ministry of Finance of Paraguay]. (2017) “Export competitiveness: a theoretical analysis Indicators of comparative advantage and their application to Paraguay’s trade data.”