Volume 2021,
Article ID 824645,
Journal of Economics Studies and Research,
12 pages,
DOI: 10.5171/2021.824645
Received date: 19 October 2020; Accepted date: 3 February 2021; Published date: 29 June 2021
Academic Editor: Anca Gabriela Molanescu
Cite this Article as:
Olga PITERINA (2021), “ The Effect of The Socio-Economic Characteristics of European States on HSR Fares: Existing Patterns for Rail Baltica", Journal of Economics Studies and Research, Vol. 2021 (2021), Article ID 824645, DOI: 10.5171/2021.824645
Rail Baltica (RB) is the first joint railway project between Latvia, Lithuania and Estonia. The economic assessment of the project is rather controversial due to the uncertainty of the revenue side of the project, which, among other things, significantly depends on the level of fare for passenger transportation along the new railway corridor. In this study, based on the grouping of European States with already operating HSRs, as well as, the States participating in the RB project, the author analyzes the impact of the economic environment’s aspects for project implementation on HSR fare for passenger long travel transportation.
The results of the correlation analysis, indicating different sets of influencing factors in the identified clusters, confirm the conclusions of the study that objectively existing differences in the level of socio-economic development of European States have a significant impact on the formation of the HSR fare. With regard to the forecast fare for passenger transportation along the RB’s corridors, it was noted that it is completely unrelated to salaries in the region, which may make it impossible for the bulk of the population of the project region to use these HSR services.
Keywords: Correlation analysis; European High-Speed Railways; HSR fare; Rail Baltica.
Introduction
Developing a trans-European HSR network is a stated goal of the European Union. However, to date, the trans-European HSR network, according to the European Court of Auditors (2018), represents a few scattered national projects rather than a fully integrated pan-European network. Therefore, projects such as Rail Baltica, aimed at improving cross-border connections, were given priority status.
The main goal of the Rail Baltica project, which forms part of the Trans-European Transport Network (TEN-T) projects (European Commission (2007), declares the restoration of direct connection between the Baltic countries and the European railway network and development of regional integration based on the railway track gauge of 1435 mm. Currently, in the countries participating in the project, the railway track gauge is of 1520 mm. Estonia, Lithuania and Latvia have declared the project one of their priorities in the development of transport infrastructure.
The European Commission (2015) expects that the creation of the TEN-T could create up to 10 million jobs by 2030 and increase the GDP of the European Union by 1.8%.
However, the data on an increase in EU GDP by 1.8% do not provide an understanding of the changes for each EU subject as a result of the implementation of the TEN-T. It is possible that for the countries producing rolling stock, infrastructure, services and rail control segments, GDP and jobs growth will reach even more significant values, while the peripheral regions of Europe, after the construction of HSR projects, will be forced to redirect taxpayers’ funds from the implementation of social or educational programs to maintenance of the infrastructure of unprofitable HSR projects, as well as to close some of the existing enterprises due to the impossibility of competition of their products with similar products of large companies that received easier access to the peripheral markets of Europe due to the construction of the cross-border HSR.
In the case of Rail Baltica, this area of research remains controversial and requires consideration of a wide range of factors, especially those related to the territorial context. The issues of the impact of regional socio-economic processes on future fares for the carriage of goods and passengers have not yet been studied. In this regard, in this study, the author made an attempt to assess the degree of influence of the socio-economic characteristics of the Europeans States on HSR fares for international passengers travel, regardless of the state tariff policy of a particular country, and to determine the existing patterns in order to form a forecast of the price aspects of the Rail Baltica strategies for the future.
The formation of the initial hypothesis was influenced by the studies concerning the level of cross-country differentiation of socio-economic development indicators within the Europeans States.
The structure of the paper is as follows. The next section provides a review of the preceding literature with a focus on clustering of HSR subjects and HSR fares. The ensuing section 3 introduces the different data sets on which this analysis is based, and empirical strategies are detailed, while section 4 gives their results. The final section synthesizes and draws conclusions on the preceding analysis.
Background
When carrying out the study, the author relied on the methodological approaches to assessing regional disparities in the dynamics of socio-economic indicators described in Krugman (1991; 1999); Puga (2002). Precisely, New Economic Geography (NEG) of Krugman is a theoretical framework for understanding the economic processes that produce regional inequalities.
Puga (1999; 2002) analyzes the development of inequality within the EU countries, focusing on objective regional differences. At the same time, he notes that the improvement of transport links should be considered as two-way communication: on the one hand, less developed regions get the opportunity to quickly access highly developed transport hubs, on the other hand, companies from highly developed regions get new sales markets for their products, having a clear advantage over enterprises from these regions due to the scale of production.
As for HSR itself, a number of papers by Thompson and Bawden (1992); Button (2012); Campos and De Rus (2009) reflect concerns about overall investment costs and real economic returns from HSR across regions. Moreover, Campos and De Rus (2009) argue that the emphasis on HSR connections is likely to favor central and end nodes of the network and is unlikely to promote the development of new activity centers in secondary nodes, thus, augmenting inequality in regions and reinforcing the core regions as transport hubs.
Clustering issues related to HSR regions have been investigated mainly to analyze passenger travel behavior and choice preference factors based on cluster membership (Jian and Zhang, 2012; Albalate, 2016; Gutierrez and Ortuño, 2017; Gutiérrez et al., 2018 ; Jing Yu Pan and Dothang Truong, 2018).
Li et al. (2016) and Jie et al. (2019) used analytical clustering techniques to assess the economic impact of HSR on cities along the route. Jianbo et al. (2020) conducted a cluster analysis of more than two hundred railway infrastructure standards in China. Moyano and Coronado (2018) used cluster scoring methods with the goal of deriving an HSR city-pair link typology.
The classification of railway stations for strategic transport and land use planning can be found in Zemp et al. (2011).
With regard to the spatial inequity of HSR fares, researchers note various aspects. For example, Bouf and Desmaris (2015) analyze the inequity of the French HSR pricing system (ticket prices per kilometer vary by the line and are not proportional to the distance traveled). Pagliara et al. (2016) show that in Italy consumers are very sensitive to the cost of high-speed train tickets, which has a strong impact on spatial equity.
Delaplace and Dobruszkes (2015) note that income levels affect the potential for leisure and long-distance mobility. When prices are high, they are more widely used by socio-professional categories that have the highest income and which are the most mobile (top managers, consultants, etc.) Thus, low-income populations may not be able to use HSR transport. Under these conditions, as Delaplace and Dobruszkes (2016) argue, considering government expenditure on HSR – taxpayers pay for the mobility of the wealthiest.
There are currently no published studies on the relationship between the pricing aspects of the Rail Baltica and the ability of the population of the project regions to pay for HSR services. The only source of information on this issue is the Cost-Benefit Analysis (CBA) of Ernst & Young Baltic (2017).
In scientific and academic databases, there were no papers available related to clustering the regions of the European HSR network, both active and under design or construction, in order to determine the impact of socio-economic factors on the price aspects of the network.
Revealing such differentiation and patterns of influence of socio-economic factors on HSR fare will increase the efficiency of planning and management decision-making process on the Rail Baltica project, which makes the choice of the author of this study relevant, both within the framework of the development of the trans-European HSR network and in the regional aspect.
Data and Methodology
Descriptive Analysis
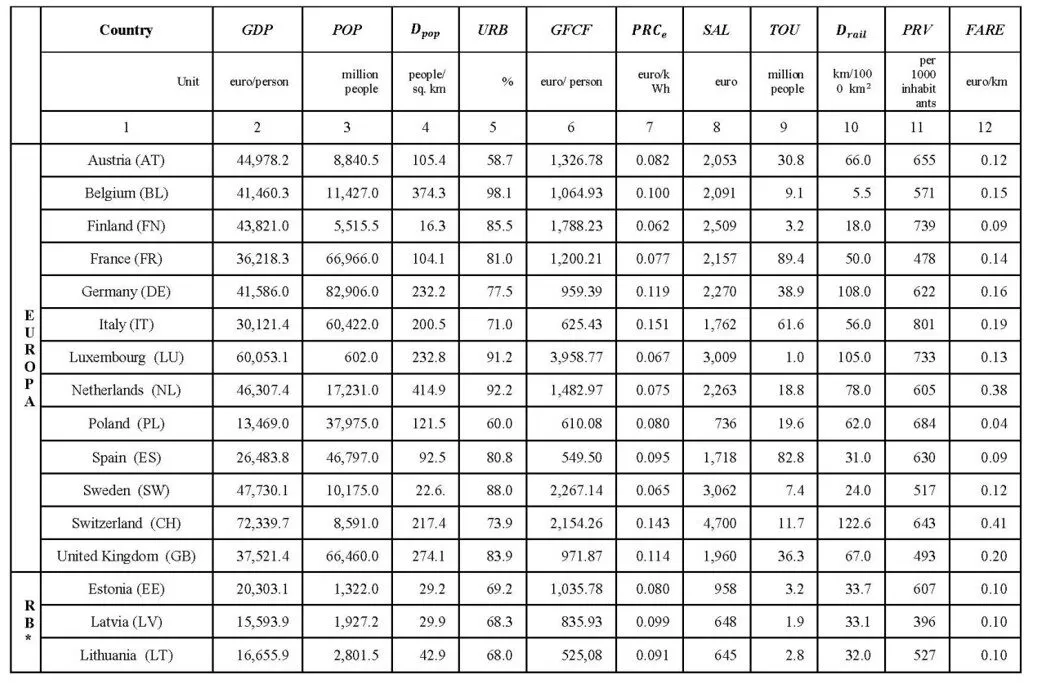
As an initial step in investigating the relationship between socio-economic indicators and HSR fare, a table was compiled highlighting the various demographic, geographic and economic factors of the European States currently operating HSRs and the Rail Baltica Member States (RBMS) – the objects of the study clustering.
Table 1: Main socio-economic indicators
Note* RB – Rail Baltica Source: designed by the author on the basis of European statistics
In terms of the data gathering, a variety of sources have been used, but key sources included:
Eurostat, UNECE, UNWTO – includes standard published data sets;
National railway websites.
As study period, 2018 was chosen, which is explained by the presence for this period of the last available complete database for all variables used in forming the initial hypothesis.
It is necessary to take into account that the type of fare chosen for the study is for a single station to station pair, and as booking horizon (the period between booking and travel) – booking a month in advance.
The choice of variables is explained by the intention to study the impact on HSR fare of the main social and economic indicators, as well as the observance of the comparability and unity of the conditions of the objects under consideration.
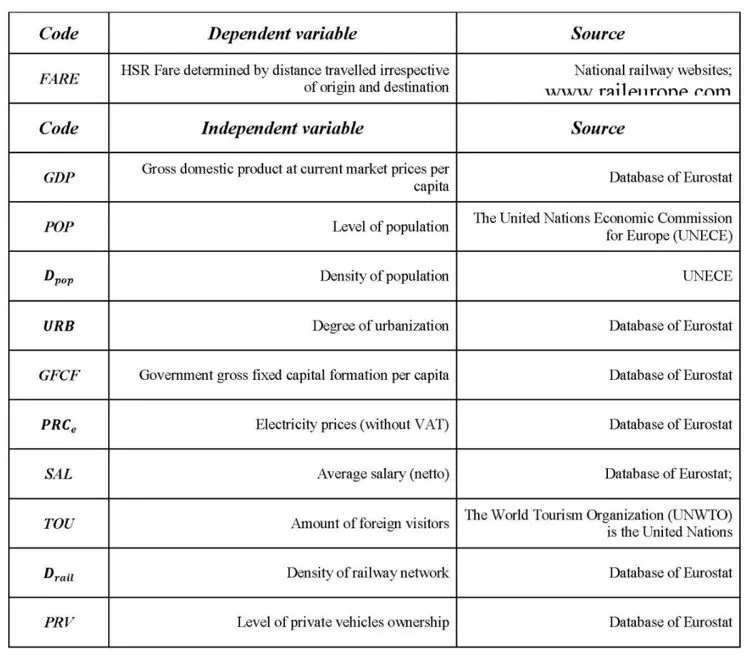
The following indicators were used as indicators participating in the study:
Table 2: Defined variablesSource: designed by the author
Multidimensional Statistics
The clustering task boiled down to dividing all European States with HSR, including RBMS, into an unknown number of clusters.
Nominal GDP per capita and population density were selected as a set of variables that best reflects the concept of similarity between clustering objects in the framework of this study.
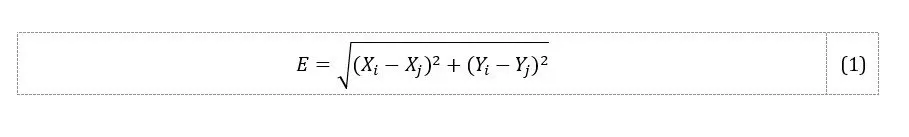
The most commonly used methods for processing socio-analytical data are the following methods: agglomerative hierarchical, divisive and iterative grouping methods (Kaufman and Rousseeuw, 2008). The following methods of hierarchical clustering are most common: between-group linkage, Ward minimum variance method, hereinafter – Ward method (Ward, 1963). Hierarchical agglomerative methods are more suitable for solving the problem of this study. From the methods mentioned above, the Ward and single-linkage methods are appropriate. Ward method aims to optimize the minimum variance within clusters. The initial formation of similarity between objects is determined using the Euclidean distance between the distance of their centers. For our problem, the Euclidean distance is calculated as follows:
The distance for the similarity matrix is calculated using the formula:
where and are the amplitudes of clusters and . and are the coordinates of the centers of mass of the clusters, || … || – Euclidean distance. As a result, a symmetric matrix is formed. Then two clusters are determined, the distance between them is minimal. These clusters are combined, and the new center of the resulting cluster is calculated:
The distance value for the formed cluster is recalculated according to the formula (2) taking into account the new coordinates of the center and amplitude.
However, in cases of elongated clusters, the Ward method tends to divide them into many small ones, 1-3 cells in each, and therefore, in this study, the use of only the Ward method for clustering objects leads to a significant number of clusters (7) with a small sample, which does not allow solving the research problem. In addition to Ward method, the single-linkage methods were used. This approach is appropriate to be used in the analysis of relatively small data sets (Everitt et al., 2011). In this task, the degree of proximity between objects is determined by the principle of the location of the coordinates of the clustered objects on the plane – nearest are adjacent objects. This paper combines the above mentioned two methods to form the desired clusters.
Econometric Methods
At first inspection there appears to be no evidence relationship between the indicators presented in Table 1 and the change in the HSR fare. Nevertheless, the characteristics of national rail networks and the economic and demographic profile of states are part of the background against which tariff policy is determined, and might affect fare levels, whether administered, regulated or set only by reference to the market. Therefore, after the procedure of clustering the research objects, author examined the relationship between HSR fare in each of the clusters and a range of characteristics, set out in Table 1 with a comment on their potential influence in each of the clusters.
This study has made use of correlation analysis in order to determine the degree of influence of the variables selected by the author on the HSR fare within each of the clusters. For this, a matrix of paired correlation coefficients was used (Table 4).
Then, after defining the reference cluster and the most significant independent variable in it, the parameters of the resulting typological regression model, characterizing the influence of the selected factor on the HSR fare in all clusters, were estimated.
Results and Discussion
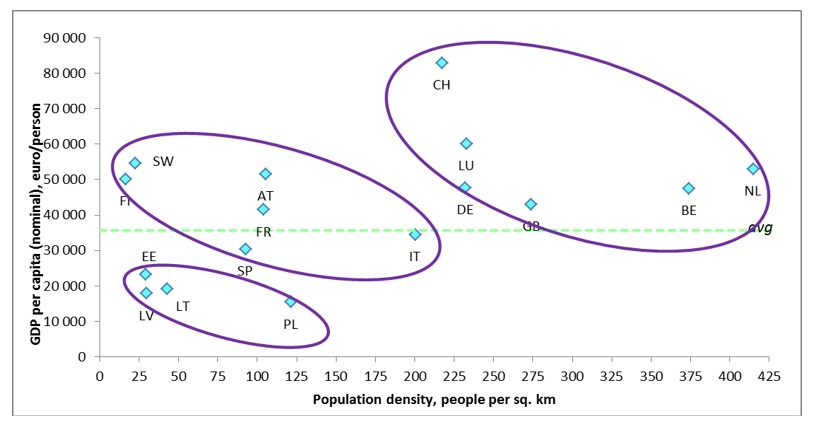
The final visualization of the structure of research objects’ clusters is presented below:
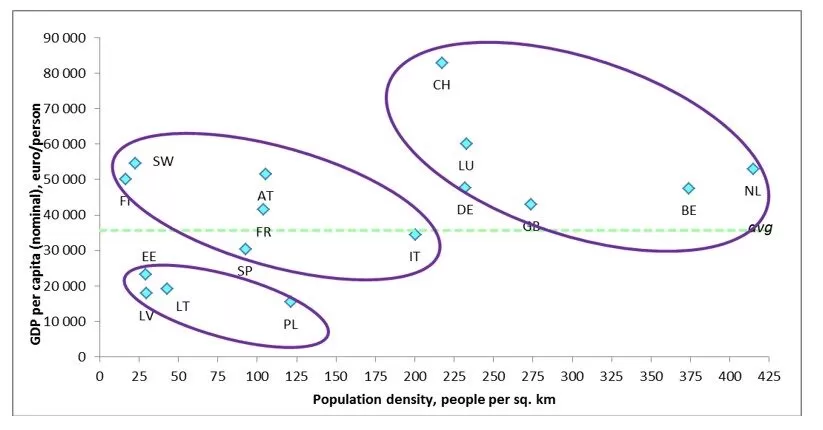
Fig. 1: Summary fit of cluster analysis
Source: designed by the author
In this case, three clusters were identified. The first includes 6 subjects: Belgium, Germany, Luxembourg, Netherlands, Switzerland, United Kingdom. The second cluster also includes 6 subjects: Austria, Finland, France, Italy, Spain, Sweden; the third cluster includes Poland and RBMS.
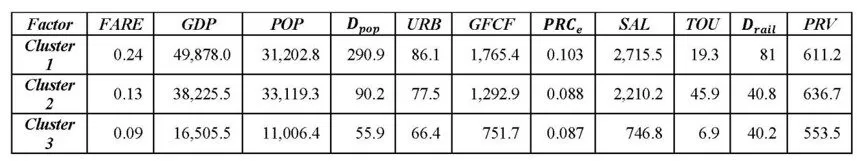
For the general characteristics of the obtained clusters, the average values of the factors selected for the study (intragroup averages) were calculated, which are presented in Table 3.
Table 3: Average value of factors in clusters.
Source: calculated by the author
Data in Table 3 allows to draw the following conclusions:
The first cluster is characterized mainly by the highest average values among all three clusters, significantly inferior to the second cluster only by the number of foreign tourists. As for the average of the level of wages, GDP per capita and GFCF per capita, for the subjects of the first cluster they are practically 3.5; 3 and 2.5 times higher than for the subjects of the third cluster (RBMS) accordingly.
The results obtained in respect of the averages for the first cluster are consistent with the view that high urbanization tends to result in relatively high rates of shortened rail travel, resulting in a higher average HSR fare.
The second cluster is characterized by lower average values of indicators of economic development, with the exception of the indicator of foreign visitors, which is the maximum in this group of subjects. The highest rate of motor vehicle ownership is associated with the propensity of residents of southern Europe to own motorcycles.
The third cluster includes subjects with the lowest socio-economic indicators, while having an equivalent average electricity price with the second cluster.
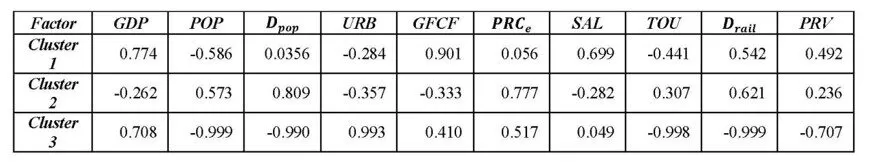
As a result of using a matrix of paired correlation coefficients of independent variables with HSR fare, the factors that have the greatest influence on the studied variable within each of the clusters were established.
Table 4: Matrix of correlation coefficients between FARE (Y) and factors in the context of clusters.Source: calculated by the author
It follows from Table 4 that the GFCF factor has the greatest influence on the dependent variable in the first cluster, and density population with electricity price factors in the second cluster. It is worth paying attention to the fact that in the third cluster, seven out of ten independent variables affect the HSR fare; five of them demonstrate a strong negative correlation, while the average salary in the region practically does not correlate with the projected fare for transportation along the new railway corridor. It is worth recalling that for RBMS, this study considers the rate specified in the investment justification of Ernst & Young Baltic (2017).
The relationship between population density and average HSR fare in the second and third clusters is very significant but has different signs.
Since the clustering results are represented by three groups of research subjects, to construct a typological regression of the entire set of subjects, it is needed to turn to the method of composition of regression models with the inclusion of dummy variables. Due to the fact the each cluster exhibits a different set of most influential factors, two models were evaluated. The statistical tools STATISTICA and HGROUP were utilized in this research.
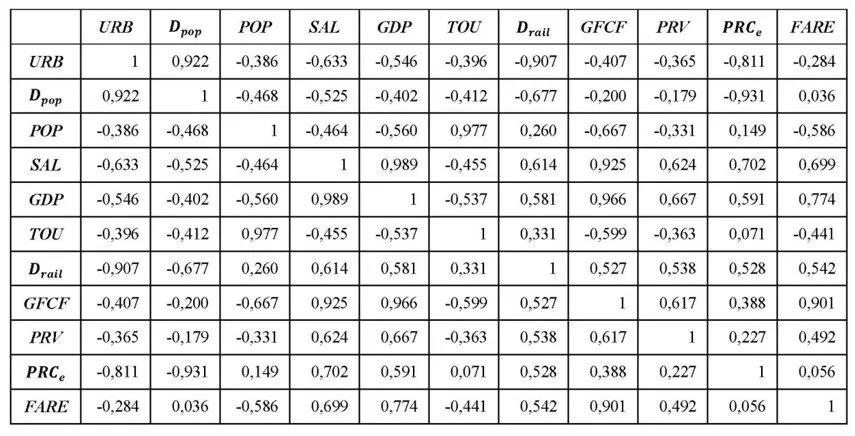
Table 5: Matrix of correlation between the independent variables in the Cluster 1
Source: calculated by the author
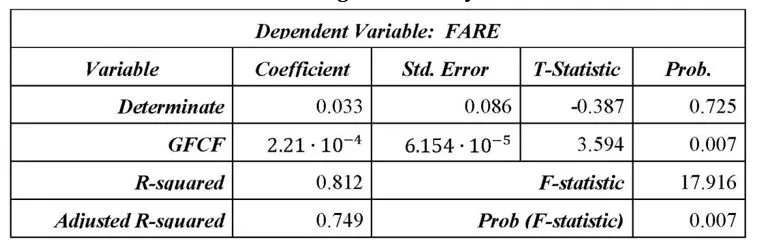
The first model is a regression reflecting the influence of the GFCF variable on the HSR fare in the first cluster, since in this case it is the reference one. After checking for multicollinearity between influencing factors in Cluster 1 (Tab. 5), the resulting regression equation can be expressed as follows:
Table 6: Result of regression analysis of Cluster 1
Source: calculated by the author
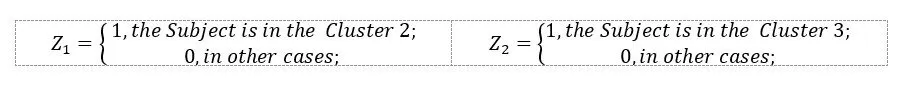
Since the GFCF variable has a significant effect only in the first cluster, two dummy variables were used in the typological model for all three clusters (Chatterjee and Simonoff, 2012):
where are factor coefficients (model parameters), and and show how much the free member of the model differs with the values of dummy variables equal to one from the free member of the model with the base values; is a free term that determines the value of HSR fare provided that the values of the factors are zero (intersection with the y-axis); and are dummy-variables with the following values:
The following model is obtained as a result of the correlation – regression analysis for all clusters based on the most influential factor in the reference cluster:
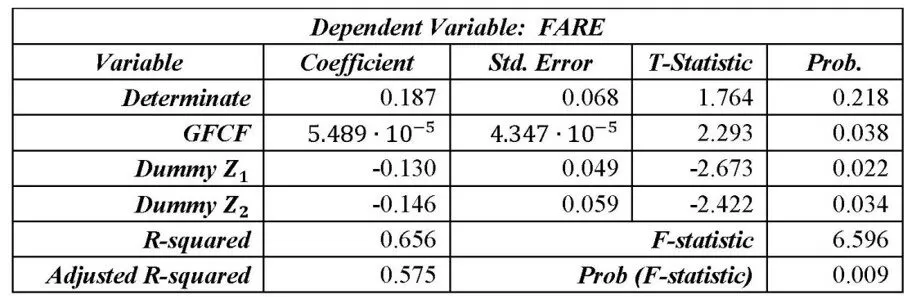
Summary statistics based on the above model is provided in Table 7.
Table 7: Model’s Parameter Estimates
Source: calculated by the author
In Tables 6 and 7, parameter estimates are depicted. As seen in the tables, all independent variables are significant at 0.05 level. The F- test also shows that the regression model is globally significant at a level less than 0.01. The negative values of coefficients of the dummy variables imply that the fixed capital investments factor has lower values and lesser relationship with the HSR fare in the second and third clusters. This finding is consistent with the method and result of clustering of the objects in the study.
Conclusions
Based on the findings of the study, it is concluded that objective national and rail sector characteristics are the factors that have a significant impact on the HSR fare, regardless of the characteristics of individual projects or regulation of tariff policy.
Based on the final results of clustering of research subjects, the author concludes that examples of successful implementation of HSR projects in densely populated European States with an overwhelming share of urban population, high levels of GDP per capita and fixed capital investment, should not be used as an advertising justification for the urgent need to implement such projects in less developed regions that do not have their own mechanical engineering enterprises; with a low population density, while having salary twice lower than the average in Europe.
With regard to the Rail Baltica project, another result is that the projected HSR fare does not correlate with salaries in the project region and has a weak correlation with the electricity price. The consequence of this may be the economic exclusion of most of the project region’s population from the potential passenger traffic of Rail Baltica.
In connection with the above, the author considers it necessary to recommend the holders of the RB project to revise the forecast fares for passenger transportation, since it is expected that the total revenue will increase, despite the lower price, as a result of elastic demand. Otherwise, due to the lack of income, the potential passenger will prefer to drive their own car, if available, which will lead to a completely opposite result of the project, in contrast to the currently declared “green” effect of Rail Baltica.
Hence, for the States participating in the Rail Baltica project, it is necessary to develop a project pricing strategy with a clear understanding of the regional specifics, based on careful planning and coordination of actions between stakeholders. Achieving such cooperation requires innovation in institutional arrangements as the basis for all infrastructure development in the Rail Baltica project region.
Albalate, D., and Fageda, X., (2016). ‘High speed rail and tourism: Empirical evidence from Spain’. Transportation Researches.Part A,85, 174–185. https://doi.org/10.1016/j.tra.2016.01.009
Bouf, D. and Desmaris, C. (2015). ‘Spatial equity and high speed trains: the example of France’. HALId: halshs‐01137902 DOI: 13140/RG.2.1.2756.7523
Button, K. (2012). ‘Is there any economic justification for high-speed railways in the United States?’ Journal ofTransport Geography, 22, 300–302. DOI: 1016/j.jtrangeo.2012.01.025
Campos, J. and De Rus, G. (2009). ‘Some stylized facts about high-speed rail: A review of HSR experiences around the world’. Transport Policy, 16, 19–28. DOI:10.1016/j.tranpol.2009.02.008
Chatterjee, S. and Simonoff, I. (2012). Handbook of Regression Analysis.John Wiley & Sons, Inc.
Delaplace, M., and Dobruszkes, F., (2015). ‘From low-cost airlines to low-cost high-speed trains? the French case’. Transport Policy, 38, 73-85. https://doi.org/10.1016/j.tranpol.2014.12.006
Delaplace, M. and Dobruszkes, F. (2016). ‘Thinking beyond the cost‐benefit analysis: The case of HSR’effects on local development’. Belgeo, 3. https://doi.org/10.4000/belgeo.18166
Ernst & Young Baltic. (2017) ‘Rail Baltica Global Project. Cost-Benefit Analysis, Final Report’.[Online], [Retrieved April 25, 2017] from: http://railbaltica.org/wp-сontent/uploads/2017/04/RB_CBA_FINAL_ REPORT.pdf
European Commission (2015). ‘Commission puts forward record €13.1 billion investment in transport infrastructure to boost jobs and growth’. Press release,Brussels, 29 June 2015. [Online], [Retrieved 22.04.2017] from: http://europa.eu/rapid/press-release_IP-15-5269_en.htm.
European Court of auditors, (2018). A European high-speed rail network: not a reality but an ineffective patchwork. Special Report. NO 19. (pursuant to Article 287(4), second subparagraph, TFEU).[Online], [Retrieved 10.2018] from: https://www.eca.europa.eu/ Lists/ECADocuments/SR18_19/SR_HIGH_SPEED_RAIL_EN.pdfе
Everitt, B.S., Landau, S., Leese, M. and Stahl, D. (2011). Cluster analysis (5th edition), Wiley. ISBN: 978-0-470-97844-3
Gutierrez, A., and Ortuño, A. (2017). ‘High speed rail and coastal tourism: Identifying passenger profiles and travel behaviour.’ PLoS ONE 12(6): e0179682. https://doi.org/10.1371/journal. pone.0179682
Gutiérrez, A., Saladié, O., and Clavé, S. A. (2018). ‘High-speed rail and tourism destination choice: the role and significance of the Camp de Tarragona station for passengers visiting the Costa
’ Boletín de la Asociación de Geógrafos Españoles, 76, 479-503. DOI: 10.21138/bage.2531
Jian, L. and Zhang, N. (2012). ‘Empirical research of intercity high-speed rail passengers’ travel behavior based on fuzzy clustering model’. Journal of Transport Systems (Eng. Inf. Technol.) 12, 100–105.
Jianbo Fei, Guangbin Ni., Xuetao Wang and Yuxin Jie (2020). ‘Cluster analysis on railway infrastructure standards in China and its application to railway efficiency improvement.’ IOP Conference Series: Earth and Environmental Science , doi:10.1088/1755-1315/467/1/012191
Jie, X.; Ming, Z.; Xiaoling, Z.; Di, Z. and Yina, Z. (2019). ‘How does City-cluster high-speed rail facilitate regional integration? Evidence from the Shanghai-Nanjing corridor.’ Cities, 85, 83–97.
Jing Yu Pan and Dothang Truong. (2019). ‘Understanding High-Speed Rail Passengers in China: A Segmentation Approach.’ Journal of Transportation Research, 2673 (4). https://doi.org/10.1177%2F0361198119834914
Kaufman, L. and Rousseeuw, P.J. (2008). Finding Groups in Data: An Introduction to Cluster Analysis. Wiley, New York. ISBN: 9780471878766
Krugman, P. (1991). ‘Increasing Returns and Economic Geography.’ Journal of Political Economy.https://doi.org/10.1086/261763.
Moyano, A., and Coronado J. M. (2018). ‘Typology of high-speed rail city-to-city links. Proceedings of the Institution of Civil Engineers -Transport, 171 (5), 264-2https://doi.org/10.1680/jtran.16.00093
Pagliara, F., Biggiero, L., Patrone, A., Peruggini, F. (2016). ‘An analysis of spatial equity concerning investments in high‐speed rail systems: the case study of Italy.’ Transport Problems, 11 (3), 55‐68
Puga, D. (2002). ‘European regional policies in light of recent location theories.’ Journal of Economic Geography, 2(4), 373–406 https://doi.org/10.1093/jeg/2.4.373.
Thompson, C. and Bawden, T. (1992). ‘What are the potential economic development impacts of high-speed rail?’ Economic Development Questions, 6, 297–319.
Ward, J. H., Jr. (1963). ‘Hierarchical Grouping to Optimize an Objective Function.’Journal of American Statistical Association, 58, 236–244.
Zemp, S.; Stauffacher, M.; Lang, D. andScholz, R.W. (2011). ‘Classifying railway stations for strategic transport and land use planning: context matters!’Journal of Transport Geography, 19(4): 670–679.


