Grażyna KARMOWSKA, Andrzej Sobczyk and Henryk Marjak
West Pomeranian University of Technology, Szczecin, Poland
Volume 2022,
Article ID 136302,
Journal of Economics Studies and Research,
11 pages,
DOI: 10.5171/2022.136302
Received date: 1 March 2022; Accepted date: 17 September 2021; Published date: 17 February 2022
Academic Editor: Anca Gabriela Molănescu
Cite this Article as:
Grażyna KARMOWSKA, Andrzej SOBCZYK AND Henryk MARJAK (2022), “Forecasting Models of The Regions’ Development Potential ", Journal of Economics Studies and Research, Vol. 2022 (2022), Article ID 136302, DOI: 10.5171/2022.136302
To assess and plan the development potential of a region, tools for forecasting and simulation of that development are needed. The choice of the model class used for forecasting purposes depends on: the nature of forecast, available information, research questions and the nature of the forecast variable. The aim of this paper is to propose models for analysis and forecasts of the potential for regional development. The development potential of a region depends on many factors. The most important ones include the region’s demographic and economic situation. To reflect these basic demographic and economic data, an index in the form of a synthetic variable was constructed. Next, SDE models for the lowest-level NUTS5 regions of Poland were estimated. According to the forecasts received, 10 municipalities will improve their development potential (demographic and economic) and shift to a higher category, whereas for 14 municipalities, the potential will decrease. The proposed predictive models can be used for analytics and forecasting when developing regional development strategies, not only at NUTS 5, but also at higher levels.
Keywords: development potential of the region, SDE forecasting models, potential index.
Introduction
EU member states vary a lot in terms of their administrative culture and tradition. Each state has full sovereignty with regard to its administrative territorial structure.
This structure is the effect of the EU integration processes, as well as the past
territorial legacy and socio-economic context of individual member states. Analysis of the differences between the EU countries and their territorial division is a basis for a systematic analysis that can capture the characteristics of territorial division in each EU state (Tomaszewski, 2007).
The EU’s Economic, Social and Territorial Cohesion Policy aims to ensure that the Cohesion Policy instruments and regulations are implemented across the entire European Union, to reduce disparities in wealth and development between regions and counterbalance inequality in income and standard of living. One of the objectives of regional development as formulated in the Cohesion Policy is to improve the living wage and standard of living at the regional level. Regional development can be assessed and measured with the use of various methods and indicators, depending on the research objective.
The most commonly used measure of regional socio-economic development is GDP per inhabitant by NUTS 2 regions. However, GDP is not considered to be a sufficient measure of societies’ overall performance, therefore, efforts are being made to develop indicators that include also other social, economic and environmental dimensions. In the case of this study, as not all of the features under study were directly comparable, synthetic variables (indexes) allowing for comparison were construed.
By far, the most popular measure of socioeconomic development, used by the United Nations Development Programme (UNDP), is the Human Development Index (HDI). It makes it possible to track changes in social development levels over time and compare the levels in different countries. However, as far back as in 1998, in a critical review, Sagar and Najam pointed out some shortcomings of the HDI, the most important being that it fails to include considerations related to sustainable development (Sagar, Najam, 1998).
To overcome the limitations of the HDI, some modifications were implemented. They sought to reflect actual social development more adequately. And so, for example, PKB per capita was replaced with the GDI, gross domestic income per capita, and the aggregation of arithmetical mean was replaced with geometric mean (Klugman, Rodriguez, Choi, 2011).
From the very beginning, HDI was disaggregated by UNDP into regions, and the methodology and quality of data did not ensure that this project would be successful in terms of giving full spatial analysis. To go beyond national values and ensure spatial representation of data, i.e., include local variation of data, the measure created in Poland and used to evaluate development policies is the Local Human Development Index (LHDI). It measures how localities – districts (poviat), as the basic unit of analysis of local development at the NUTS3 level, fare with regard to the availability of health and educational facilities, and job opportunities. The modified HDI has been adopted widely as one that captures development of societies more adequately, and is promoted, in particular, by the Organization for Economic Cooperation and Development (OECD). Modifying the HDI to the requirements of measurement at the local level was a challenging task, since data availability, and also the practical applications of the LHDI as measure for the evaluation of development policies, had to be considered. In consequence, social development could be determined at the level of provinces (Voivodeships) (NUTS2) and districts (NUTS3).
The biggest challenge is still the availability and quality of data. It must be kept in mind that the application, and subsequent monitoring, of a dynamic index requires up-to-date data, which can be compared over time and which measure social development accurately – in terms of spending and effects (National Report on Social Development Poland 2012).
Limited availability of data at the commune level (gmina)(NUTS5), being the basic-unit of territorial administrative division in Poland, was exactly the reason why another index was proposed – IPG.
The construction of the IPG relied on the multidimensionality of data, extent of aggregation, data availability and repeatability.
When one embarks on construing a synthetic index, there is always a risk that some social and economic aspects will, simply, be ignored. Therefore, in the understanding that it is not possible to identify and standardize absolutely all determinants of socio-economic development, the attempts to construct an all-embracing synthetic measure were dropped. Major obstacles to constructing such a universal measure include:
first of all, there is no universal agreement as to what constitutes favorable and unfavorable determinants of development, and the boundary between the two, and it is only objective determinants are unequivocal and ensure objectivity;
secondly, to create a synthetic index, all of the partial measures would have to be summed up, which implies that they would have to be commensurate with one another, which is often simply an infeasible task (Sadowski, 2005, p.12).
It is especially true when analyzing development potential at the NUTS 5 level (Local Administrative Units). To evaluate perspectives of development perspectives of municipalities, additional simulation and prediction tools are necessary.
The aim of this paper is to propose a predictive model that can be applied in practice for the modeling of development potential at municipal level. This study is a continuation of research on municipal development potential (Karmowska, Sobczyk, 2019).
NUTS classification of the European Union territory
European Union member states vary hugely in terms of territorial divisions adopted by each member for administrative purposes. Irrespective of these inter-state divisions, it is regions that are the focus of EU regional policy, classified according to the rules formulated in 2003. With the idea to provide a common designation for different levels of administrative geographic boundaries across the EU, a single, cohesive system of territorial groupings for the compilation of the EU regional statistics was devised: a classification called NUTS (Nomenclature of Units for Territorial Statistics). The NUTS classification is thus a hierarchical system that subdivides the economic territory of EU member states into three levels. For the purpose of socio-economic analyses, the three levels of regions are used:
NUTS 1: major socio-economic regions, NUTS 2: basic regions for the application of regional policies, NUTS 3: small regions for specific diagnoses.
[Commission Regulation (EC) No 105/2007 of 1 February 2007 amending the annexes to Regulation (EC) No 1059/2003 of the European Parliament and of the Council on the establishment of a common classification of territorial units for statistics (NUTS)]. To meet the demand for local level statistics, Eurostat maintains a system of Local Administrative Units (LAU) which is compatible with the NUTS. These LAUs, comprising urban and rural municipalities of the EU, are in fact the building blocks of the NUTS. In each EU member state, Local Administrative Units subdivide the regional NUTS level 3 into one or two further levels defined as local. In Poland, it is NUTS 4 (“poviats”, districts) and NUTS 5 (“gminas”, municipalities or else, communes).
Description of diagnostics variables
The development potential of a region depends on many factors. Among the most important are its demographic potential and total budget revenue of local government units. For local governments, the task of formulating long-term strategic development plans is quite challenging as it requires the understanding of demographic processes and structures, as well as expert revenue forecasting skills. The research material was based on statistical data for 2004-2018 collected by the West-Pomeranian Province for 114 of its municipalities. The research period was dictated by the length of the country’s EU membership status. Poland joined the EU in 2004, and the access had a significant impact on Poland’s demographic, in particular in the West Pomerania Province due to its geographic location. Based on selected diagnostic variables, the author developed the Municipal Development Potential Index (MDPI), a synthetic measure, with the use of the zero unitarization method (Kukuła, 2000) as suggested by the authors indicated in reference literature (Karmowska, Sobczyk, 2019).
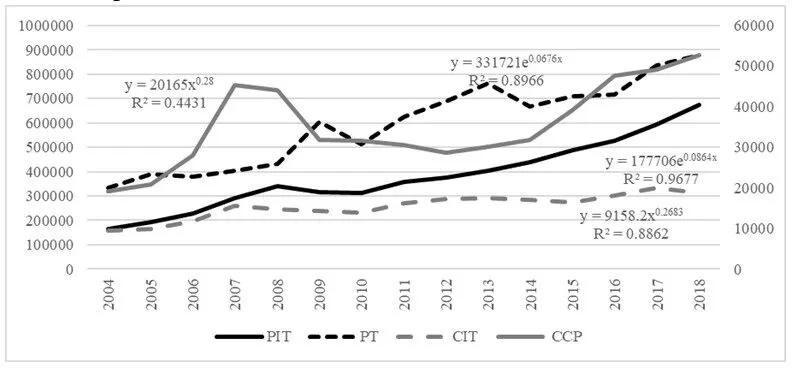
For the construction of the MDPI, economic and demographic variables were adopted as diagnostic variables. Economic variables include primarily taxes since they have the largest share in total municipal revenue, i.e., CIT, PIT, property tax and tax on civil law transactions, as illustrated in Figure 1.
Fig. 1. Average revenue from PIT, CIT, property tax and tax on civil law transactions in West-Pomeranian municipalities
Source: Karmowska, Sobczyk and Marjak, 2021.
Average values of corporate income tax followed a power trend function, whereas trends of PIT and property tax followed the exponential function. These trends reveal a rising trend, with the dynamics being the biggest for PIT (ca.8,64% of average annual increase). Property tax grew by an average annual of 6,76%. However, the power trend must be interpreted with caution since if the time variable increases by 1%, the tax will grow by 0,27%. The tax on civil law transactions also shows a power function, but because of its discordant results, adjustment of 52% was applied.
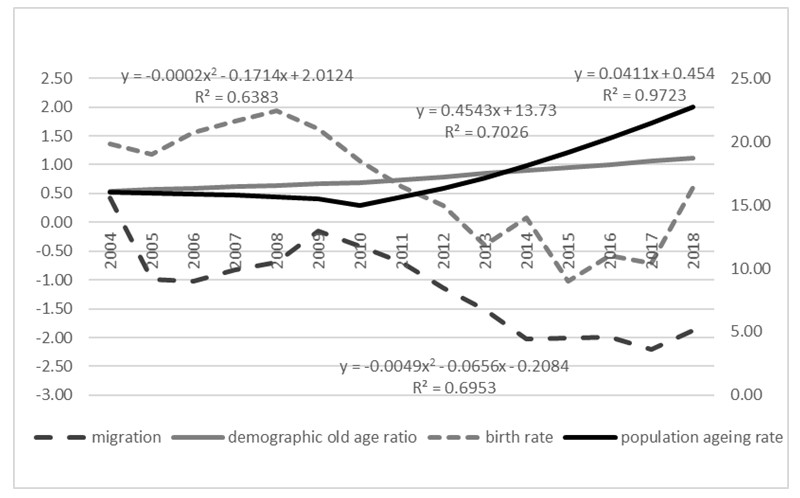
The second group of diagnostic variables refers to demographics. Figure 2 presents average values of the population ageing rate, demographic old age ratio, birth rate and migration balance.
Birth rate and migration balance show a declining trend and are expressed by quadratic polynomial. This is also the case with the demographic old age ratio which demonstrates that the share of population aged above 60 in total population is growing continuously. In contrast, the population ageing rate, defined as the percentage of people aged 60+ (post-working age) in the overall population, demonstrated a linear function with regression coefficient showing an average annual increase of 0,04 elderly persons per 1 thousand population.
Fig. 2. Average values of demographic indicators for West-Pomeranian municipalities
Source: Karmowska, Sobczyk and Marjak, 2021.
Forecasts of Municipal Development Potential Index (MDPI)
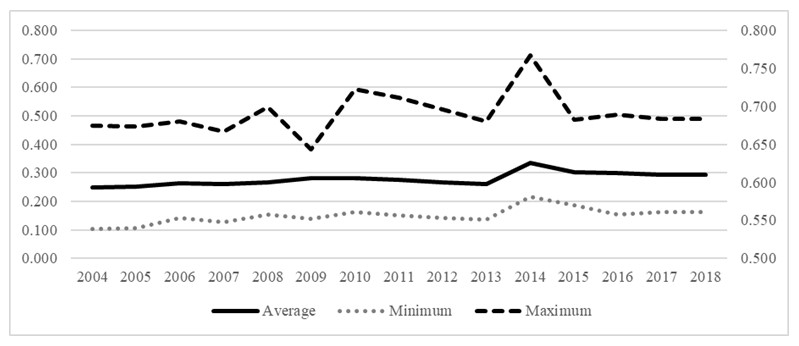
Naturally, the average development potential of municipalities varied over the study period of 15 years. In 2018 it was by ca. 37% higher than in 2004. The Index variability was within ca. 30%. Average and extreme MDPI values in the study period are presented in Figure 3.
Fig. 3. Municipal Development Potential Index in West-Pomeranian municipalities
Source: Karmowska, Sobczyk and Marjak, 2021.
Predictive Modeling Methods
The choice of a prediction model depends on the nature of forecast, information available, questions to be answered and specifics of the predicted variable. A stage not to be overlooked in the entire forecasting process is the evaluation of the accuracy of projections, which helps choose a predictive model that is most relevant to a specific situation, and thus, most appropriate. Moreover, such evaluation allows measuring the size of prediction errors and the uncertainty of prediction (Makridakis, Hibon, 1979). Error measures provide a valuable input and contribute to the development of prediction methods to be used in specific forecast situations and their further refinement (Armstrong, Collopy, 1992).
MDPI Projections
Stochastic Differential Equations (SDE) were used for predictive modeling of future Municipal Development Potential Index values. The SDE method is widely used in natural sciences and engineering, e.g. for predicting wind speeds in meteorology (Iversen et al., 2016), energy produced by wind turbines (Møller et al., 2016) or for determining the capacity of ferry terminals (Postan, Kushnir, 2016). In mathematical finance, SDEs are used, in particular, to model fluctuating stock prices and interest rates. The ability to eliminate nonlinear noise is crucial to the understanding of true financial series dynamics. Financial markets are known for their chaotic behavior, and it happens that changes occurring on the markets are reflected in analytics only after expectations have been severely missed, which, of course, yields a strong response. In other words, many factors can trip up forecasts. Discovering the fundamental structure of this phenomenon is a challenge that simple models cannot deal with in the long run.
Therefore, it is important to create predictive models that would allow for reliable long-term projections (Choe, 2016).
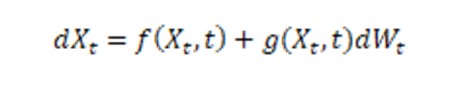
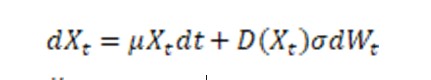
Stochastic differentia equation is formulated as:
where Wt is the Wiener process or Brownian motion, and functions f( ∙ ) and g( ∙ ) are referred to as the drift and diffusion coefficients. Diffusion is the random motion of particles in a fluid resulting from their constant collision with other molecules. Frequently, such processes are called the “Brownian motion” after Robert Brown who described random movement of pollen grains in water, but was not able to explain it. What is important, Brownian motion is recurrent, returning periodically to its origin. Single particle trajectories can be simulated with Monte Carlo Simulation which is a mathematical technique used when a model has uncertain parameters or a dynamic complex system needs to be analyzed. It is pertinent in our case as the demographics of West Pomerania and municipal development potential expressed by the MDPI were treated as nonlinear phenomena with random effects. That is why the aforementioned equation was implemented in this form:
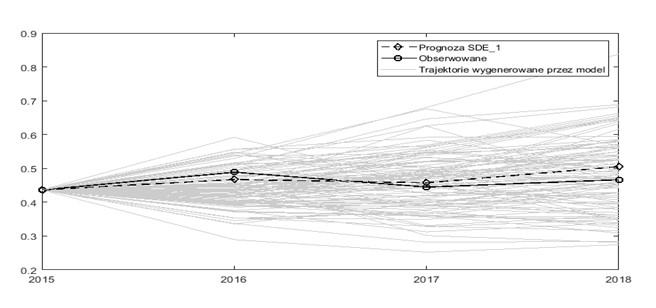
where μ is a diagonal matrix of anticipated changes in MDPI, D is a diagonal matrix xt , and ó is a diagonal matrix of standard deviation of MDPI. Figure 4 presents sample predicted trajectories computed with Monte Carlo simulation for the SDE-based prediction compared with real values for a selected municipality for a 3-year-period.
Fig. 4. Comparison of predictions and real values against Monte Carlo trajectories for a selected municipality
Source: Karmowska, Sobczyk and Marjak, 2021.
To compare SDE-based predictions, modeling was carried out with the use of autoregressive models optimized for every individual municipality. Many research variables showed auto correlation, that is a linear relationship between delayed observations – earlier observations may point to present observations (Box et al., 2008).
The quality of the predictive model was verified ex post with the use of RMSE (Root Mean Square Error):
where: yt – observed value, ypt– forecast.
Prognostic models were optimized based on MDPI for all municipalities for the years 204-2018. The optimization process was carried out in two stages: 1. Selected predictive methods were developed and optimized; next, the most suitable predictive method was chosen; 2. Predictions were made and optimized with the use of the method selected in the first stage, followed by a classification of municipalities based on forecast for 2021. Data used in the first stage were put into two groups: one served the purpose of optimizing models (years 2004-2015), and the other served the purpose of verifying prediction errors (2016-2018). In the second phase, data were divided into blocks of data of the same size to optimize prognostic models (2007-2018) and generate forecasts (2019-2021).
During the SDE-based optimization of prediction models, 3 modeling variants were adopted relevant to the nature of municipalities selected for optimization: a) all municipalities were treated as one codependent space (SDE_1), and then based on an agglomerative clustering method (Ward’s method), divided into groups by average MDPI and MDPI deviation over the study period, b) – two groups (SDE_2) and c) three groups (SDE_3).
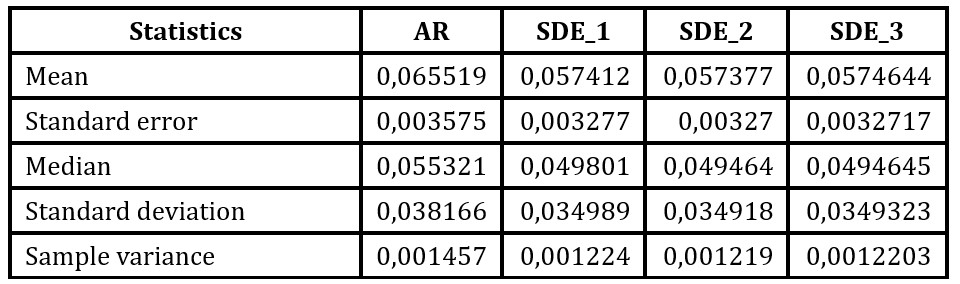
To model the probability of different outcomes, SDE-based predictions were verified with Monte Carlo Simulation with 10 000 trajectories. Descriptive statistics of RMSE for given methods are shown in Table 1.
Table 1. Descriptive statistics of RMSE for the three predictive models
Source: Karmowska, Sobczyk and Marjak, 2021.
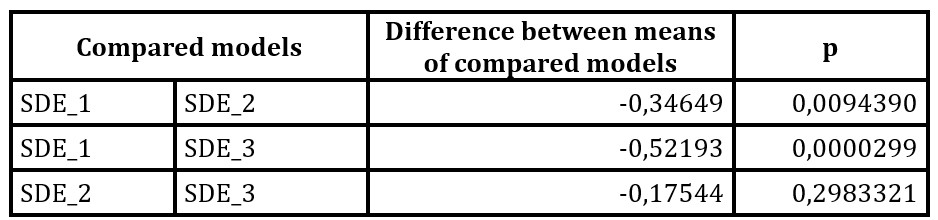
While the values generated by the autoregressive model differ distinctly from the SDE-based models, the differences between them do not unanimously point to significant difference between means, hence the Friedman test had to be applied. In result, the zero hypothesis of no difference between means (p=0,00005) for SDE-based outcomes was rejected. The Tukey’s test, a single step multiple comparison procedure, was carried out to check which means are significantly different from one another, as shown in Table 2.
Table 2. Results of the Tukey’s honest significance test for SDE models
Source: Karmowska, Sobczyk and Marjak, 2021.
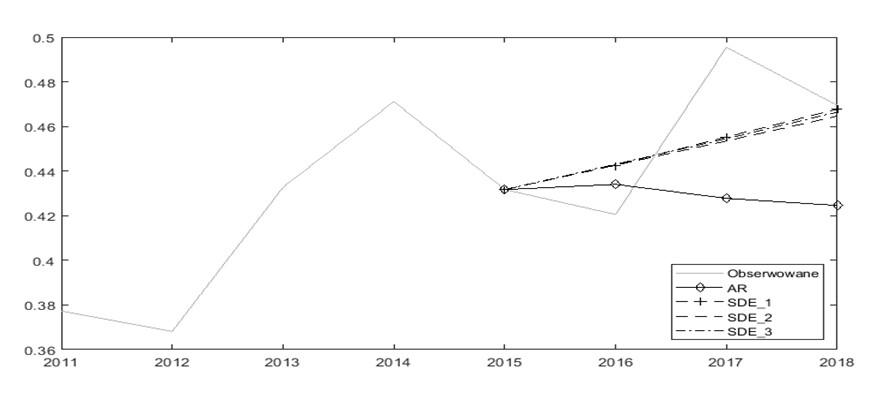
Although a big similarity of the SDE-based predictions can be noticed when comparing the three SDE models (Fig.5), the Tukey’s test proves that the means of SDE_2 and SDE_3 models are statistically different from SDE_1, but do not show a significant difference from one another. Moreover, it is pertinent to note that the measures of central tendency, in particular the median, indicate that the RMSEs are lower for models fed by data classified into groups (SDE_2, SD_3). To facilitate the ultimate goal, namely forecasting development potential for 2019-2021, only the SDE_2 model was considered in further research.
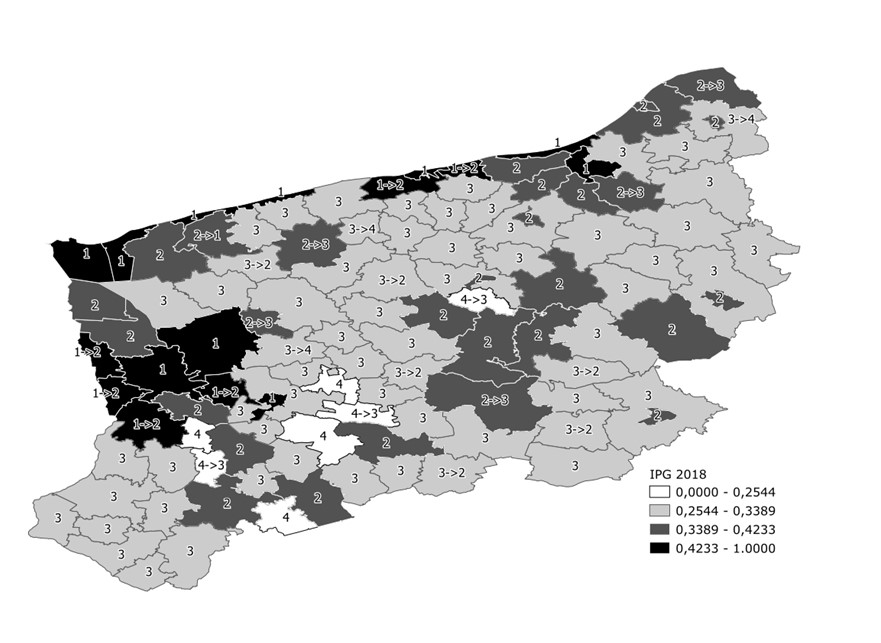
Following that, the Municipal Development Potential Index for 2019-2021 was calculated for the SDE_2 model. Next, based on the 2021 predicted Index values, municipalities were classified into four categories. According to the predicted outcomes, in result of positive demographic and economic projections, 10 West-Pomeranian municipalities are likely to do better socio-economically and be upgraded to a higher category, with 6 municipalities moving from category 3 to category 2. On the other hand, 14 municipalities are likely to do worse, with 6 of them shifting from category 1 to 2, and 5 from category 2 to 3. Research findings are presented graphically on the administrative map of the West-Pomeranian Province (Fig. 6.)
Fig. 5. Comparison of forecasts for 2016-2018 with values observed for selected municipality
Source: Karmowska, Sobczyk and Marjak, 2021.
Fig. 6. Municipal Development Potential Index (MDPI) in 2018 and classification of
municipalities based on MDPI predictions for 2021
Source: Karmowska, Sobczyk and Marjak, 2021.
Conclusion
Welfare of the population and its economic activity is reflected in the revenue to the budget of commune authorities, and thus, the overall situation in each commune. This is only logical that the measurement of development potential should include, aside from economic factors, a whole set of extra-economic factors (multidimensional measurement), which determine the quality of life, relating to, i.e., life expectancy, housing standards, education, culture and respect for human rights.
Development of long-term strategic development plans, a task local governments are burdened with, requires the knowledge of all components that jointly constitute municipal development potential.
To develop the Municipal Development Potential Index, economic and demographic variables were used.
Mean value trends of diagnostic variables can mostly be captured by classic econometric models. However, in case of MDPI trends, traditional models do not meet the extrapolation criteria, which is why the SDE models were used to predict MDPI values.
Prognostic models were optimized based on MDPI values for all municipalities over the period 2004-2018.
Projections of MDPI were made for 2019-2021 with the use of SDE models, and next, based on predictions for 2021, municipalities were assigned to one of 4 categories. Positive demographic and economic forecasts suggest that 10 municipalities will improve their development potential and move into a higher category, whereas for 14 municipalities, the potential will decrease.
The proposed predictive models can be used for analytics and forecasting when developing regional development strategies, not only at NUTS 5, but also at higher levels.
Armstrong JS and Collopy F., (1992) Error measures for generalizing about forecasting methods: empirical comparisons, International Journal of Forecasting, vol. 8, is. 1, 69-80.
Box, GEP, Jenkins, GM and Reinsel, GC (2008) Time Series Analysis: Forecasting and Control (4 edition). Wiley.
Commission Regulation (EC) No 105/2007 of 1 February 2007 amending the annexes to Regulation (EC) No 1059/2003 of the European Parliament and of the Council on the establishment of a common classification of territorial units for statistics (NUTS).
Karmowska, G. (2018) Postęp społeczny w regionach krajów Unii Europejskiej, Prace Naukowe Uniwersytetu Ekonomicznego we Wrocławiu, nr 509.
Karmowska, G. and Sobczyk, A. (2019) The influence of demographic changes on the development potential of communes of the West-Pomeranian Province, Research Papers of Wroclaw University of Economics, vol. 63, nr 8.
Karmowska, G., Sobczyk, A. and Marjak, H. (2021), ‘Application of SDE Models for Predicting Development Potential of Nuts 5 Regions Based on a Case Study of West-Pomeranian Regions’ Proceedings of the 37th International Business Information Management Association (IBIMA), ISBN: 978-0-9998551-6-4, 30-31 May 2021, Cordoba, Spain, 1430-1437.
Klugman, J., Rodríguez, F. and Choi HJ, (2011) The HDI 2010: New controversies, old critiques, Journal of Economic Inequality, 9, nr 2: 249–88 [access 2.03.2021] https://doi.org/10.1007/s10888-011-9178-z.
Krajowy Raport o Rozwoju Społecznym Polska 2012. Rozwój regionalny i lokalny. Biuro Projektowe UNDP w Polsce Warszawa 2012 [access: 12.12.2020] http://www.euroreg.uw.edu.pl/dane/web_euroreg_publications_files/2859/raport_undp-2012_www.pdf.
Kukuła, K. (2000): Metoda unitaryzacji zerowanej, Wyd. PWN, Warszawa.
Makridakis, S. and Hibon, M. (1979) Accuracy of forecasting: an empirical investigation with discussion, Journal of the Royal Statistical Society (A), 142, pp. 97-145.
Møller, JK, Zugno, M. and Madsen, H. (2016). Probabilistic forecasts of wind power generation by stochastic differential equation models, Journal of Forecasting, 35(3), 189–205 [access 5.05.2020] https://doi.org/10.1002/for.2367.
Postan, M. and Kushnir, L. (2016) A method of determination of port terminal capacity under irregular cargo delivery and pickup, Eastern-European Journal of Enterprise Technologies, 4(3(82)), 30–37 [access: 3.03.2020] https://doi.org/10.15587/1729-4061.2016.76285.
Sadowski, Z. (2005) Postęp społeczno-ekonomiczny i jego mierzenie. Transformacja i rozwój, Sadowski, Z. (ed) PTE, Warszawa.
Sagar, AD and Najam, A. (1998) The human development index: a critical review, Ecological Economics, 25, nr 3, 249–64 [access: 5.03.2021] https://doi.org/10.1016/S0921-8009(97)00168-7.
Tomaszewski, K. (2007) Regiony w procesie integracji europejskiej. Oficyna Wolters Kluwer business, Kraków.