1Department of Economics and Financial Studies, Faculty of Business and Management,
Universiti Teknologi MARA (UiTM), Selangor, Malaysia
2Putra Business School, 43400 Seri Kembangan, Selangor, Malaysia
2School of Business and Economics,
Universiti Putra Malaysia (UPM), Serdang, Selangor, Malaysia
Volume 2022,
Article ID 926828,
Journal of Economics Studies and Research,
12 pages,
DOI: 10.5171/2022.926828
Received date: 14 March 2022; Accepted date: 28 July 2022; Published date: 28 September 2022
Cite this Article as:
Norashida OTHMAN and Zulkornain YUSOP (2022), “Shift‐share Analyses of Malaysia’s Export Competitiveness: The Case of Oleochemical Products ", Journal of Economics Studies and Research, Vol. 2022 (2022), Article ID 266828, DOI: 10.5171/2022.266828
Palm oil is the most commonly used edible oil globally and is found in many consumer products. In Malaysia, this industry is one of the key economic drivers of the Malaysian economy. Despite the recent covid-19 pandemic year, Malaysia’s palm oil industry has faced challenges from reduced demand from China, as well as unfavourable prices. Currently, palm oil-related exports rely heavily on upstream links such as crude palm oil (CPO). Therefore, it is crucial to expand the production and export of high value-added palm oil-derived products such as oleochemicals. Therefore, this study aims to analyze the potential market for Malaysian palm oil downstream products specializing in oleochemicals. The annual data from 1999 to 2016, and the data of export (FOB) and import (CIF) are up to six digit Harmonize System (HS) code gathered from the UN Comtrade. A total of 107 importing countries were chosen for the study. The results showed that Malaysia’s oleochemicals had the highest percentage shift in China (23.84%), followed by South Korea (9.78%) and India (8.31%). Therefore, the study highlights that Malaysia also urgently needs to enter other emerging markets such as South Korea to benefit from the growing cosmetics and personal care market.
The term of natural oleochemicals refers to the oleochemicals that derived from vegetable and animal oils and fats such as Soybean, Palm Oil, Rapeseed and Sunflower (Ismail, Aldrin, and Hassan, 2014). The oleochemicals’ industry in Malaysia started in the early 1980s and today the Malaysian oleochemicals’ industry is one of the largest oleochemicals’ industry, accounting for 20% of the global capacity (Asean Oleochemical Manufacturers Group – AOMG). Major feedstock for those oleochemicals was Processed Palm Oil, Palm Stearin and Palm Kernel Oil. A consistent supply of Palm Kernel Oil and Palm Oil has led to the development of the oleochemicals’ industry in the country.
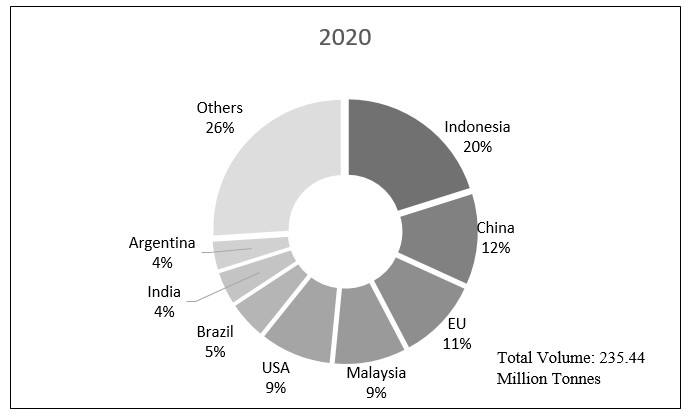
The exponential increase in global population and rising income increased global demand for oils and fats. Furthermore, palm oil’s competitive price in the international market compared to other major edible oils and fats became a driving factor behind its increased consumption. Palm oil has become widely used in millions of products, including food, soap, personal care items, cosmetics, feedstock for biodiesel, and many more. Palm oil (including palm kernel oil) accounted for 39.75% of global total vegetable oil consumption in 2020, equivalent to 82.71 million tonnes, followed by soybean oil (27.67%) and rapeseed oil (11.97%). The efficiency of palm oil cultivation stems from its ability to optimize land use. The efficiency of palm oil cultivation stems from its ability to optimize land use. In addition, Palm oil trees produce ten times more oil per hectare than soybeans. Figure 1 depicts the world’s top 17 oil and fat producers in 2020, with Malaysia ranking among the top five, with the palm oil industry accounting for most of its output.
Figure 1: Oils & Fats Major Producers, 2020
Source: Malaysia Oil Palm Statistics (2020)
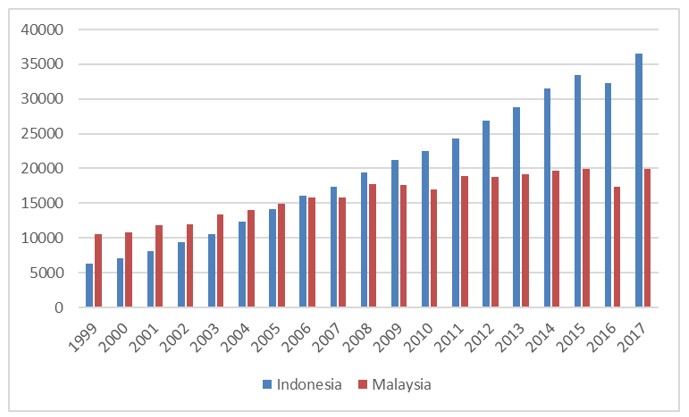
Figure 2 depicts the evolution of the world’s leading palm oil producers from 1999 to 2017. In 1999, Malaysia produced 51% of total crude palm oil, equivalent to 20.62 million tonnes, while Indonesia produced only 30%. However, from 2006 onwards, Indonesia surpassed Malaysia as the leading producer. In 2017, Indonesia accounted for 54% of global crude palm oil production (67.39 million tonnes), while Malaysia accounted for only 29.5%. With faster land expansion and lower labor costs, Indonesia surpassed Malaysia to become the world’s largest producer of crude palm oil. Nevertheless, according to Reuter (2017), Malaysian production costs are 10 to 15% higher than those in Indonesia. Malaysia and Indonesia currently account for over 85% of global palm oil production.
Figure 2: Annual Production of Crude Palm Oil (CPO) (‘000 Tonnes),
(Source: Malaysia Oil Palm Statistics 2017)
Although Indonesia is the largest palm oil producer, Malaysia still maintains its position as the largest exporter in export ratio to local production (Yoyo et al., 2014). In 2017, Malaysia exported approximately 83% of its palm oil production to global markets, while Indonesia exported 74% of its total production. This indicates that Malaysia is more reliant on palm oil exports than Indonesia. Because Indonesia has a larger population than Malaysia, most of the palm oil produced in the country is for the domestic market.
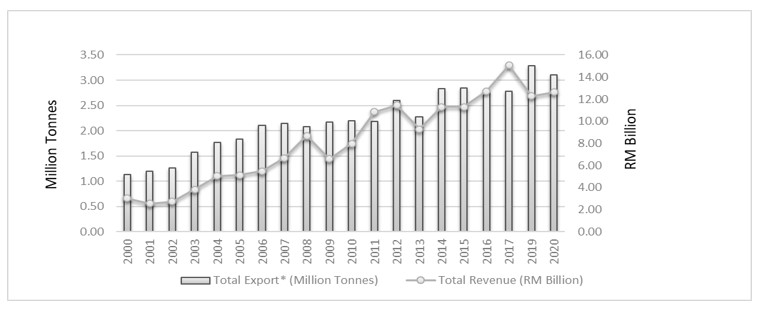
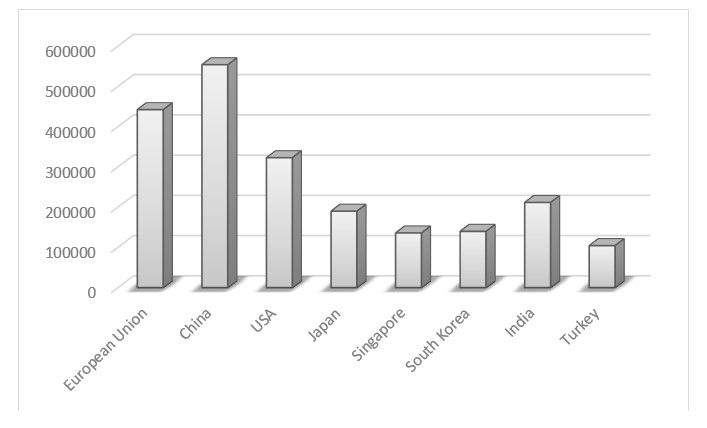
Figure 3 shows the trend of Malaysia’s oleochemicals’ export increase from 2000 to 2020 even with slight decrease in 2013. The value shows sharp incremental from 2000 to 2017. Major Export of oleochemical products exported includes Fatty Acids, Fatty Alcohol, Methyl Ester, Soap Noodles and Glycerine (MPOB, 2020). Total of 3.09 Million Tonnes of Oleochemical product is exported in 2020 and main export destination is to China (18%) followed by the European Union (14%) and the United States of America (USA) (11%) (Figure 4).
Figure 3: Export of Malaysia’s Oleochemicals, 2000-2020
Source: MPOB, Review of the Malaysian Oil Palm Industry (2020)
Due to competition from Indonesian palm oil, current export trends show that Malaysian palm oil is losing market share in traditional markets such as China, the EU, and Pakistan. One reason for this poor export performance is a lack of competitiveness. Malaysia’s palm oil exports are expected to fall further due to its current domestic production. To address this issue, Malaysia must improve and promote high-value-added palm oil products such as oleochemicals to increase, recover, and maintain its strong global position against other key players.
As the world’s environmental issues have become a major concern, the demand for sustainable alternative fuels has grown. As a result, one of the alternatives for sustainable fuels are vegetable oils and their derivatives. The global oleochemicals’ market was valued at USD 19.46 billion in 2020 and is expected to grow due to rising demand for renewable, sustainable, and bio-based chemicals in personal care & cosmetics, food & beverages, pharmaceuticals, and other industries. Oleochemicals which derived from palm oil can be widely used to produce a variety of consumer products through processing such as emulsifiers and vitamin E. There is also huge potential in intermediate and final oleochemicals for non-food applications such as soap, detergents, cosmetics, personal care and industrial products.
Literature Review
Competitiveness is widely considered as an important ingredient in generating national prosperity since it enables the production of goods and services in which a country possesses comparative advantage and improves the standard of living and real income (Crouch and Ritchie, 1999). Due to its advantages, it is of importance in various disciplines such as economics, management, political science and policy-making. In the economic literature, the conceptual definition of competitiveness has many dimensions (Voulgaris and Lemonakis, 2014).
The concept of comparative advantage within international trade theory was initially developed by Ricardo in 1817. It revolves around the fact that it is not necessary for a country to possess an absolute advantage in a sector for higher exports as Smith (1776) stated, but if a country has the ability to produce one good at a lower opportunity cost relative to another country, then that country can export that product as it has a comparative advantage in that good. This trade theory can also be termed as a Ricardian model. A nation is said to have a comparative advantage in producing a good if the autarky price is lower than the other good produced in its own country and in the other country. The higher productivity in the labour force of one country leads to the lower autarky price and, thus, that nation specializes and exports the product as it has a comparative advantage in that good.
The international trade theories discussed above emphasize more production based or supply-side economics. As economies produce and export the products in which they have a comparative advantage, they gain competitiveness in that production sector. In contrast to that, the theory put forward by Porter (1990) stated that competitiveness is not only a supply-side phenomenon because factors such as demand, presence of related and supporting industries and firm strategy, structure and rivalry also determine national competitiveness.
The shift-share analysis is a descriptive statistical model that plays a central role in the analysis of geographic and regional issues. Probabilistic shift-share is an advanced version of traditional accounting-based methods as it allows the researcher to quantitatively test hypotheses about changes in employment or value added by region or sector (Knudsen, 2000). Policymakers who often need quick and inexpensive analysis tools that are neither mathematically complex nor data intensive utilize shift-share extensively (Knudsen, 2000). The shift-share technique has been accepted as a major empirical analysis tool for the purpose of analyzing export opportunities for firms and industries in various fields (Castaldi, 2009 and Asfaranjan and Moayyed, 2012). Hence, shift-share analysis has been used by many scholars such as Haque (2002), and Asfaranjan and Moayyed (2012), Rahman et al (2015), Othman et al (2021) and has been recognized one of the most appropriate tools for screening export opportunities and identifying the most profitable destinations for exporting a specific product. Rubin (2005) also showed that this technique can be utilized to discover the global prospects of exporting opportunities for small businesses.
The shift-share method has identified three major components of product portfolio analysis namely product or market growth, percentage growth and net shift analysis. Haque (2002) stated that the shift-share technique can be used to measure the progress of a distinct market compared to all followers of a selected group of markets. Haque (2002) concluded that shift-share analysis, despite some limitations, can be utilized to measure four elements: product, market growth, percentage growth and net-shift. In China, Wilson et al (2005) used dynamic shift-share analysis to examine the export performance of electronics compared to the East Asian NIEs in the US, the EU and Japan markets between 1988 and 2001. The outcomes showed that China had emerged as a huge competitor in the electronics export market, but it was not a dominant one because China still could not gain in the high-end exports in developed markets.
In Malaysia, Asfaranjan and Moayyed (2012) identified the export opportunities of four Malaysian palm oil products which include palm oil, palm kernel oil, oleochemical products and palm kernel cake in over 150 countries. They found that China has the highest potential to emerge as a major export destination for palm oil, palm kernel oil and oleochemical products. This is followed by the USA, which emerged as the second major export destination for palm oil, palm kernel oil and oleochemicals’ exports. The high potential export markets for palm kernel cake were New Zealand, Pakistan and China. Alias et al (2014) applied Shift-Share Analysis (SSA) to analyse the competitiveness of Malaysia’s food-based agricultural products. The results indicated that Malaysia’s major export commodities are animal or vegetable fats and oils (HS 15) and China, Iran, India and Ukraine are the most dominant markets for Malaysia.
Furthermore, Othman et al (2018) investigate the export competitiveness of Malaysia’s processed palm oil (PPO) from 2001 to 2016 in 10 major importing countries. The data used products which are classified as 151190 in the Harmonized Tariff Nomenclature (HS Codes). The Shift-Share approach is used to identify the potential export growth in selected major importing countries for Processed Palm Oil from Malaysia to calculate the net shift. The analysis revealed that Vietnam followed by Philippines, Iran and the United States are an important export market for Malaysia processed palm oil (PPO) products. A more recent study by Othman and Wahab (2021) analyses the export competitiveness of Malaysia’s Palm-Biodiesel in 28 major importing countries by utilising annual data spanning from 2013 to 2016. Their results indicate that Spain has the highest percentage of positive net shift followed by Albania and Switzerland.
The discussion demonstrates that shift-share analysis has been the most useful tool for international trade analysis and evaluating export market growth and competitiveness. It calculates the percentage net shift, which is the relative gain or loss in the growth of a specific variable in a specific region over a given period.
Research Methodology
In order to achieve the objective of this study, the methodology of SSA has been employed. This method, which was first introduced by Dunn (1960) and later discussed by Perloff et al (1960), was used as a technique for identifying export opportunities (Huff and Sherr, 1967, Green and Allaway, 1985, and Green and Larsen, 1991). SSA is a statistical technique which estimates the individual market growth from chosen groups. Specifically, it measures the percentage of changes in a country’s export with the corresponding exports of a selected group of reference economies over a certain time period.
Export growth differentials express growth in terms of absolute or percentage change in the variable of interest over a time period, also known as a net shift. A positive net shift implies that the concerned country gained a significant share of exports over the relative reference group and improved its competitiveness for a certain product in a given time period whereas a negative value constitutes that the country lost its market share in comparison to the market share of the reference group and deteriorated in its competitiveness. The members with positive net shifts are identified as the ones having the most potential market (Huat, 2001 and Shandil, 2005).
The time frame chosen for this study to conduct SSA ranges from 1999 to 2016 and involves 18 palm-based oleochemical
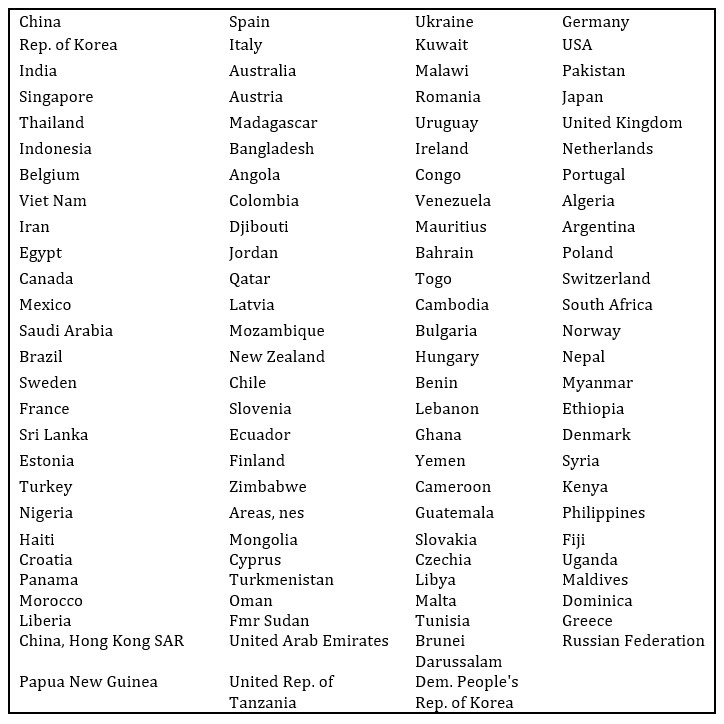
products based on HS 6-digit codes. The description of 107 importing countries are presented in TableA.1 in the appendix. The detail of the components involved in the calculation of SSA is explained in the following subsections.
Real Change in Growth
If represents the value of the export for market j at the end of the time period t, then the change in exports would be termed as and would be calculated by using equation 1.
In equation 1, if Δ∨j > 0 , then jth market would witness a positive growth in exports. If Δ∨j > 0 then the jth market would experience a decline in the export growth. Similarly, if Δ∨j = 0 then the export growth in jth market would remain unchanged. The ultimate aim is to achieve a positive growth which indicates that ΔVj must be greater than zero. It is pertinent to mention here that this calculation does not present the growth of the export in a certain market in comparison to the other markets.
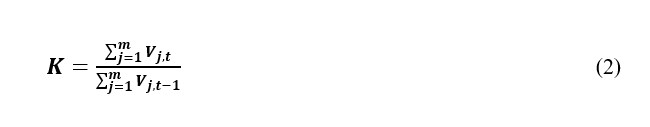
Overall Growing Rate
The overall change in growth rate for the entire market ‘K’ is given in equation 2. It is stated as the proportion of the sum of growth rate of the exports in every market for a certain time period t:∑v,t to the sum of the growth rate of the exports for every market in the last time period:t:∑v,t-1 .
In equation 2, j = 1, 2 … mth market place.
Projected Value of Growth Rate
Haque (2002) stated that the projected value of the growth of exports in a specific market at the end of the time period
t E ( Vjt), is the function of the real value of the growth rate of exports in this market at the initial time period and the extent of growth of exports that has taken place in the entire market. The expression for achieving this value is given in equation 3 whereby E(Vj,t) is stated as the product of the growth value of exports in the last time period ( Vj,t-1 )and the growth rate of the entire market (K).
Projected Change in the Growth Rate
Projected change in the growth rate of exports for a specific market within a given time period is achieved after subtracting the growth value of exports in the last time period ( Vj,t-1 )from the projected value of the growth rate of exports, E(ΔVj,t). In other words, it is the difference between the projected value and real value of the growth rate of exports for the market. The expression for calculating projected change in the growth rate of exports is given in equation 4.
Net Shift
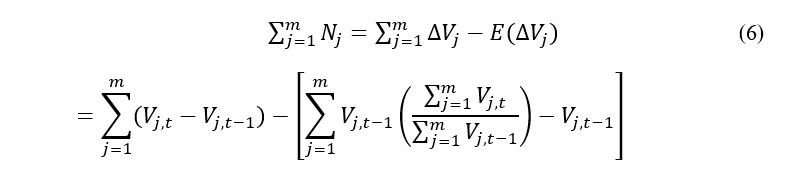
The net shift is defined as the difference between the real change and the projected change in the growth rate of exports in a certain market. This change is denoted as Nj and the expression in given in equation 5.
In equation 5, if NJ > 0, it does not essentially imply that the growth of exports in jth market rises by a greater quantity than it could have if it had grown up at the aggregate market rate. This assumption would be true only if E(ΔVj)>0. However, if (ΔVj)< 0 . and , then . This suggests that the jth market does not decline as speedily as it would have been estimated. Thus, a growth rate between the real and estimated values is not an appropriate portion. Furthermore, the sum of the net shift values for all markets should be zero as shown in equation 6.
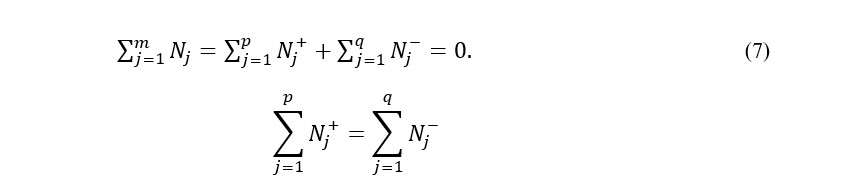
If the set , m, is divided into subsets that are larger than or equal to zero and those that are less than zero, these would be identified as , p, and , q respectively. The expression is given in equation 7 whereby p + q = m.
Total Absolute Net Shift
The sum of the optimistic net shift ‘S’ denotes the total absolute net shift and is stated in equation 8.
Net Shift Percentage
The comparative gain in the growth rate of exports for a particular market j in a given time period t is known as the proportional net shift, . The percentage net shift is defined in equation 9.
In equation 9, is net shift and is equal to actual change in exports minus the expected change. The actual change comes from the value of exports in time period two minus the value in time period one, whereas the expected change is estimated by the growth rate of exports multiplied by the actual value in period one. Growth rate can then be calculated by dividing the value in period two by value in period one. Furthermore, it can be assumed that the sum of the ratio of net shift for the entire market is equal to zero. The sum of the constructive net shift is one and the summation of the negative net shift is minus one.
Results
The global export opportunities for Malaysian palm oil downstream products are obtained via SSA. A similar study was carried out by Asfaranjan and Moayyed (2012) but only at the three-digit code of SITC level and mainly for four products namely palm oil, oleochemical products, palm kernel oil and palm kernel cake.
The analysis for this objective has based the exports of palm oil downstream industry focusing on oleochemical product at the six-digit level codes of HS. The study estimates the trade competitiveness of 107 importing countries and identifies the countries with higher export opportunities. The export data for oleochemical group have been taken for 18 years from 1999 to 2016. This time period is marked by a slowdown in the growth pattern of world trade and can also be termed as a post-Asian financial crisis era. The year of 1998 has been excluded to avoid the effect of an export tax hike on CPO imposed by Indonesia for one year plus in 1998 the Indonesian government banned PO exports for several months (Priyati, 2018). Therefore, this study was not included in the year of 1998 in order to avoid bias in the analysis. For the purpose of the analysis, the data for 18 years have been divided into two parts: the initial time period ranging from 1999 to 2007 and the terminal time period ranging from 2008 to 2016.
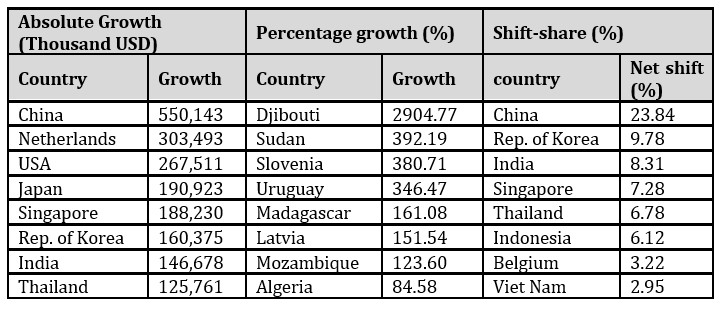
The market rankings for the selected products were also estimated using the absolute growth and percentage growth methods. From the main exporters of Malaysian palm oil, eight (8) major countries involved in importing each of three groups of palm oil downstream products were selected. Likewise, the analysis of absolute growth, percentage of growth and shift-share value is also segregated for the initial and the terminal time period of 1999 to 2007 and 2008 to 2016 respectively. The results are revealed in Table 3 and are tabulated in descending order.
Table 3: Market opportunities for Malaysia’s oleochemical products (1999-2016)
Table 3 shows the result of analysis for oleochemical products’ group according to major exporters. The analysis highlights that in terms of oleochemical products, the highest absolute growth is in China followed by the Netherlands and the USA, while the percentage of growth shows that Djibouti is ranked first followed by Sudan and Slovenia. The best market for oleochemicals based on shift-share (Net shift) analysis is China followed by the Republic of Korea and India with shares of 23.84 %, 9.78 % and 8.31 % respectively.
Robustness Analysis
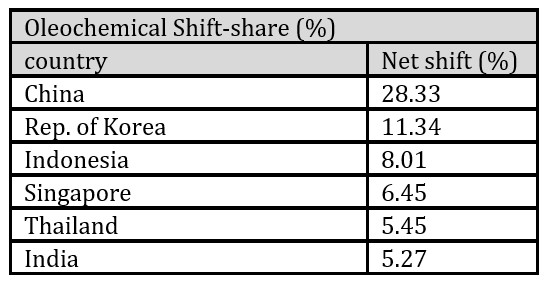
To ensure the results obtained are robust, the time periods used in the shift-share analysis for the selected countries are altered. The time period from 1999 to 2016 (18 years) was changed to 2001 to 2016 (16 years) to identify the consistency of the result obtained. Therefore, the initial period for robustness test for 16 years has been divided into two parts: the initial time period ranging from 2001 to 2008 and the terminal time period ranging from 2009 to 2016. It can be observed in Table 4 that changes in the time period of the study do not change the top potential countries rankings too much.
Although the potential countries remain the same, minor changes can be seen in the country rankings. For example, the results show that India is ranked as the third most potential market in oleochemical products’ exports from Malaysia for the time period of 1999 to 2016 (see Table 3 under column shift-share). However, the results in Table 4 place India in the sixth position for the time period of 2001 to 2016. Despite such differences, it can be claimed that the most potential markets for Malaysian exports in selected palm-based oleochemical products do not vary significantly as a result of changing initial and terminal time periods and, hence, the results can be stated as robust.
Table 4: Net Shift for Malaysia’s Oleochemical Products
In summary, based on the main results of the analysis for the time period of 1999 to 2016 (the initial time period ranging from 1999 to 2007 and the terminal time period ranging from 2008 to 2016), China is identified as the most attractive market for Malaysian exports in palm oil downstream products within oleochemical products’ groups. South Korea and India are the second and third most potential markets for exports of oleochemicals. The results also show that among the 107 countries selected, Malaysia heavily depends on a few countries for the bulk of its exports. Therefore, identifying more countries that have the demand for local products within palm oil downstream industries and raising exports in those markets to carry immense importance for Malaysia.
Conclusion
Malaysia has been caught in upper middle-income trap and aims to achieve a high-income nation by 2030. Palm oil is identified as one of the twelve NKEAs that can help Malaysia achieve high-income status. Unfortunately, the palm oil industry exports are still highly concentrated in the upstream sector which implies an excess of lower value-added products. Therefore, it is very important for the Malaysian government to promote the downstream palm oil industry as that concentrates on high value-added finished products. In this regard, improving the competitiveness of downstream palm oil industry is a very important aspect for the government of Malaysia. Since there is a dearth of literature on this topic, this study contributes by undertaking the elements of competitiveness for the downstream palm oil industry to estimate the current competitiveness and recommend improvements.
Based on the Shift Share Analysis, China is identified as the most attractive market for Malaysian exports in palm oil downstream products within oleochemical products’ groups. South Korea and India are the second and third most potential markets respectively for exports of oleochemical products’ groups. Higher export demand from India and China is mainly due to the growing population in these regions whereas the Republic of Korea has high demand for cosmetics and personal care products that require the use of oleochemicals. Such opportunities must be exploited by the Malaysian government and promote more oleochemical products in these countries to increase the market share in the global oleochemical industry significantly.
Acknowledgments
The authors would like to thank an anonymous referee for valuable comments and suggestions. We also would like to acknowledge the Malaysian Ministry of Higher Education for funding this study under the grant FRGS/1/2019/SS08/PUTRA/01/1
Paper Contribution to Related Field of Study
The findings from this study imply crucial policy recommendations that can be addressed by the government, producers, and stakeholders to enhance the competitiveness of the palm oil industry in Malaysia.
Alias, M. H., Arshad, F. M., and Rahman, A. A. A. (1992). Market Share Analysis of Malaysia’s Palm Oil Exports: Implication on its Competitiveness. Journal of Economic Malaysia, 26 (Disember 1992), 3-20.
Arip, M. A., Yee, L. S., and Feng, T. S. (2013). Assessing the Competitiveness of Malaysia and Indonesia Palm Oil Related Industry. World Review of Business Research, 3(4), 138–145.
Asfaranjan, Y.S and Moayyed A.Z. (2012). Assessing Export Opportunity of Malaysia’s Palm Oil Products: Using Shift-Share Technique. European Journal of Scientific Research, 70(2), 323-333.
Balassa, B. A. (1989). Comparative Advantage, Trade Policy and Economic Development. Harvester Wheatsheaf.
Dewanta, A. S., Arfani, R. N., and Erfita (2016). Elasticity and Competitiveness of Indonesia’s Palm Oil Export in India Market. Economic Journal of Emerging Markets, 8(2), 148-158
Hassanpour, B. and Ismail, M. M. (2010). Regional Comparative Advantage and Competitiveness of Malaysian Palm Oil Products. Oil Palm Industry Economic Journal, 10(2), 23-28.
Kumaran, S. (2019). The Dynamics for Mandatory MSPO Certification Scheme to Be Successfully Implemented. Journal of Oil Palm, Environment & Health, 10(2019), 1-7
Mahat, S.B.A. (2012). The Palm Oil Industry from the Perspective of Sustainable Development: A Case Study of Malaysian Palm Oil Industry. Master Thesis, Graduate School of Asia Pacific Studies Ritsumeikan Asia Pacific University Japan.
Malaysian Palm Oil Board. (2013). Revision of customs tariff code for oil palm products and schedule of tariff rates. Economic and Industry Development Division, MPOB
Malaysian Palm Oil Board. (2018). Malaysian Oil Palm Statistics 2017, 37th Edition. Economic and Industry Development Division, MPOB
Nesti, L. and Tan, F. (2017). The Competitiveness Crude Palm Oil Product of West Sumatra in Domestic and World Market. Reports on Economics and Finance, 3(1), 37–43
Nomanbhay, S., Hussein, R., and Ong, M. Y. (2018). Sustainability of biodiesel production in Malaysia by production of bio-oil from crude glycerol using microwave pyrolysis: a review. Green Chemistry Letters and Reviews, 11(2), 135-157.
Othman, R. A. (2018). Exploiting Resources for Competitive Advantage of Cooperative Organizations in Malaysia. Asian Journal of Behavioural Studies, 63–71
Othman, N., Yusop, Z., Ismail, M. M., & Afandi, S. H. M. (2021). Energy Tax and the Downstream Palm Oil Trade Competitiveness Nexus in Malaysia: An Application of GMM Approach. International Journal of Energy Economics and Policy, 11(5), 593-599.
Othman, N., & Wahab, S. N. (2021). Exploring the Potential Market for Malaysian Palm-Biodiesel. Empirical Economics Letters, 20 (Special Issue 2) (May 2021), 75-83.
Rahman, M.K. and Taufiq, M., 2015. A Shift-share analysis of electrical and electronic products: An overview and assessment of export growth of Malaysia. Asian Social Science, 11(10), p.330.
Rifin, A. (2010a). Export competitiveness of Indonesia’s palm oil product. Trends in Agricultural Economics, 3(1), 1-18.
Rifin, A. (2010b). An Analysis of Indonesia’s Palm Oil Position in the World Market: A Two-stage Demand Approach. Oil Palm Industry Economic Journal, 4(2), 35-42.
Rodrigues, A., Bordado, J. C., and Santos, R. G. D. (2017). Upgrading the glycerol from biodiesel production as a source of energy carriers and chemicals—A technological review for three chemical pathways. Energies, 10(11), 1817.
Salleh, K. M., Abdullah, R., Rahman, M. A. K. A., Balu, N and Nordin, A. Z. A. (2016). Revealed Comparative Advantage and Competitiveness of Malaysian Palm Oil Exports against Indonesia in Five Major Markets. Oil Palm Industry Economic Journal, 16(1), 1-7.
Sari, E. (2010). Revealed comparative advantage (RCA) and Constant Market Share Model (CMS) of Indonesian Palm Oil in ASEAN Market, Unpublished Master Thesis, Agribusiness Management Prince of Songkla University, Bangkok
Scott, L. and Vollrath, T. L. (1992). Global competitive advantage and overall bilateral complementarity in agriculture: a statistical review. Statistical Bulletin No. 850. US
Department of Agriculture, Economics Research Service: Washington, DC.
Shamsudin, M. N., and Arshad, F.M. (1993). Malaysian Palm Oil Market Model. In Arshad, F.M., Shamsudin, M.N. and Othman, M.S. (Eds.) Malaysian Agricultural Commodity Forecasting and Policy Modelling. Centre for Agricultural Policy Studies.
Shariff, F., Rahman A. K. A. and Amiruddin, M. N. (2006). The elasticity of foreign demand for Malaysian palm oil. Oil Palm Industry Economic Journal, 6(2), 1-6
Sinaga, R. H. (2007). Competitiveness Analysis of Indonesian Palm Oil Export in China, Unpublished master thesis, Graduate Program Management and Business, Institut Pertanian Bogor, Bogor.
Subramaniam, D. (1997) Assessing the Competitiveness of the Malaysian Palm Oil Industry. Master’s thesis, Universiti Putra Malaysia.
Vollrath, T. L. (1991). A theoretical evaluation of alternative trade intensity measures of revealed comparative advantage. Weltwirtschaftliches Archiv, 127 (2), 263– 279.
Wisena, B. A., Daryanto, A., Arifin, B., and Oktaviani, R. (2015). Sustainable development strategy for improving the competitiveness of oil palm industry. International Research Journal of Business Studies, 7(1), 13-37.
Yoyo, T., Daryanto, A., Gumbira, S. A., and Hasan, M. F. (2014). Competitiveness Model and Gap Analysis of Indonesian Palm Oil-Based Fatty Acid and Fatty Alcohol Industry. International Journal of Economics and Finance, 6(2), 218-225
Yulismi and Siregar, H. (2007). Determinant Factors of Indonesia Palm Oil Export to Major Importing Countries: An Error Correction Model Analysis. Economics and Finance in Indonesia, 55(1), 65-88.
Zainuddin, Z. M. (2018). Perceived Destination Competitiveness of Langkawi Island: An evaluation. Asian Journal of Environment-Behaviour Studies, 3(10), 12-123. doi: https://doi.org/10.21834/aje-bs.v3i10.318
Appendix
Table A.1: List of Countries for Shift-Share Analysis