Janka ZAJACOVA1, Maria ZUBKOVA2 and Beata STEHLIKOVA3
1,2 Faculty of Civil Engineering, Slovak University of Technology in Bratislava, Slovak Republic
3 Faculty of Economics, Pan-European University in Bratislava, Slovak Republic
Volume 2023,
Article ID 770696,
Journal of Economics Studies and Research,
16 pages,
DOI: 10.5171/2023.770696
Received date: 7 September 2022; Accepted date: 9 January 2023; Published date: 21 February 2023
Cite this Article as:
Janka ZAJACOVA, Maria ZUBKOVA and Beata STEHLIKOVA (2023), “ Housing Expenditure and Overburden of Households in EU Countries", Journal of Economics Studies and Research, Vol. 2023 (2023), Article ID 770696, DOI: 10.5171/2023.770696
The article contributes to the identification of significant differences between EU countries in overburden resulting from the availability of housing. The EU and its institutions do not have direct competence, and housing policy does not fall under the common policy of the EU. We will focus on selected dimensions: accessibility and affordability of housing, owning, or renting housing in EU countries. We research four housing categories according to tenure: owner with no outstanding mortgage or housing loan, owner with a mortgage or loan tenant paying rent at market price, and tenant paying rent with reduction or free. In this paper, we examine the overburden of housing expenses on households in these four categories. This exploratory research and according to the type of data used is a quantitative research study. We used box plots to visualize the data. Based on the cluster analysis, we can state that EU countries naturally divide into three clusters as per the countries’ approach to housing solutions in 2009 and in 2020, too. The Baker Hubert gamma index value is 0.0462, which means that the dendrograms in 2009 and in 2020 are not statistically similar. This proves that not only there are differences between individual countries, but the development of the share of overburden in the four examined categories is different. It would be appropriate to find appropriate instruments to enforce the same or at least a similar approach to housing for inhabitants in all EU countries.
Housing – a place to live – is a basic human right. Housing puts people into a social context: background, health care, work, friends, a place to study and relax, to make social and environmental contacts, and provides protection from bad weather. Expenditure on housing represents a large part of personal income in Slovakia and across the EU. In order to get housing, we need a market with sufficient range of housing on the supply side (ownership, rent – private, public rent, cooperative, corporate housing, etc.), as well as availability of housing in terms of affordability. The availability of housing and related issues has been addressed by many authors in recent years, both in the European and global context. Finally, the problem of a “roof over your head” affects all people around the world. Authors that have addressed the issue of housing affordability include: Mulliner and Maliene (2011), McGranahan (2015), Zan Yang et al (2014), Dewilde (2018), Haffner and Boumeester (2010), Mulliner and Maliene (2012), Yang and Chen (2014), Robinson, Scobie and Hallinan (2006).
Theoretical backgrounds
The housing problem has several dimensions and is multiplicative in nature. Here we will focus on selected dimensions: accessibility and affordability of housing, owning or renting housing in EU countries, and forms of housing divided into four categories according to tenure: owner with no outstanding mortgage or housing loan (A); owner with a mortgage or loan (B); tenant paying rent at market price (C); and tenant paying rent with reduction or free (D). In this paper, we examine the overburden of housing expenses on households in these four categories. There are significant differences between EU countries.
Housing accessibility vs. affordability
We wish to introduce a distinction between the terms ‘accessibility’ and ‘availability’ of housing. By availability, we understand financial availability. Accessibility to housing, or in our view the accessibility of housing, distinguishes sufficient housing stock from the quantitative point of view and different forms of housing. The market, therefore, offers both ownership and rental housing in various forms – from market-rate housing to subsidized rental housing.
In his article, Schieferdecker (2018) identifies the housing problem as a “lack of affordable housing” but also that “housing is not affordable.” Although many people may use the two terms interchangeably, Schieferdecker regards the two statements as distinct. The first statement treats the word “affordable” as a separate category of housing and identifies a shortfall; the second statement applies to all housing and terms it as being too expensive (Schieferdecker, 2018). We also need to distinguish between ‘access’ to housing and ‘availability’ of housing. This small difference matters because it can have significant consequences for how people perceive the problem as well as potential solutions. If we look at the problem as a ‘lack of affordable housing’, the obvious solution is to build more affordable housing – however it’s defined. It is also less likely that the solution would involve the construction of more expensive flats. Conversely, if we believe that the problem is that “housing is unaffordable”, the obvious solution is to incentivize and legally support the construction of more housing of all shapes and sizes and, in principle, thus reduce rents through oversupply.
We believe that this approach would open up access to housing. Here we would like to emphasize our perception or definition between accessible housing and affordable housing. It is confirmed again that access to housing is enough through different forms of housing, and availability is related to the financial availability of individual households.
In their article “Housing affordability: a framing, synthesis of research and policy, and future directions” from January 2020, Galster and Lee (2021) seek to summarize the extensive international professional literature on the growing problem of housing affordability. They examine the underlying causes of housing affordability problems by taking a systematic approach and discussing housing affordability concepts and measures.
The problem of accessibility is far from a new phenomenon, it was also dealt with in the last century by – for example – Lerman and Reeder (1987). Yet the problem is definitely developing and changing its qualitative nature. In this context, it is important to mention the essence of social housing as found in the housing policies of all European countries as well as global countries including Australia, the US, China, etc.
Social housing is universally associated with affordability for households with low and often medium incomes. Furthermore, it can also be stated that social housing is more or less related to the public rental sector – hence countries with a developed social system have a larger social housing sector. Social housing can fill gaps where the market cannot meet the need for housing at a price that all households can afford, hence the role of social housing in each country must be understood in relation to the overall housing market. Rising housing prices have led to increasing affordability issues (Housing policy in EUROPE). Social housing solved the problem with the onset of the second industrial revolution and increased urbanization; among EU countries, this sector is well developed in the Netherlands, France, Austria and many original EU15 countries. Due to demand, the private rental sector has “driven” rental prices to sometimes disproportionate heights. Hence people interested in housing preferred to buy rather than rent, which seemed more advantageous. Banks had supported this by offering cheap mortgage loans, but interest rates are rising – although of course mortgages are long-term, during which loan terms change. We do not know how the economic situation will develop during the pandemic or post-pandemic era, the era of high inflation, and even the war on the EU’s borders.Predicting the situation for such a prolonged period such as 25-30+ years is difficult, almost impossible. Unemployment is also rising (pilots, flight attendants, gastro services, tourism, etc.), whereby it would be much more advantageous and financially secure to live in the public rental sector.
Some facts about owning or renting housing in EU countries
There are significant differences between EU countries in terms of owning or renting. In the EU in 2019, 70% of the population lived in a household owning their home, while the remaining 30% lived in rented housing. In countries such as the Netherlands, Denmark, and Austria, and Germany, the rental sector ranges from almost 40% to 49%. The more developed the country, the more rental housing there is. Yet in countries such as Romania, Hungary and Slovakia, the share of owner-occupied housing is over 90%. Meanwhile, in a developed European country such as Norway almost 70% of the population lives in own housing, while in Switzerland it’s only a little over 40%, i.e., a house or an apartment. Although we stated that 70% of the EU population lives in own housing, how is it in terms of the proportion of houses and flats? In 2019, Eurostat found that 53% of households live in houses, 46% in apartments, and 1% in other housing (houseboats, caravans, etc.). The largest share of people living in houses is in Ireland (92%), followed by Belgium, Lithuania, and the Netherlands (75%), while apartments are more popular in Latvia, Estonia, Greece, and Spain. In cities, 72% of the EU population lived in a flat and 28% in a house. For towns and suburbs, the proportions were 58% and 42% respectively, while in rural areas 82% lived in a house and only 18% in a flat (Eurostat, 2021). We will try to investigate or analyse the availability and accessibility of housing in mutual interaction. We start from housing types, i.e., owner-occupied housing and rented housing. The basis is Eurostat databases with housing types and data per EU countries over twelve years.
Housing Types
In general, housing types can be divided into four categories according to tenure: owner with no outstanding mortgage or housing loan; owner with mortgage or loan; tenant with rent at market price; tenant with reduced rent or free. For each category, we have created two tables where we track data on the overburden of housing expenses on households. An overburden is said to arise when the share of housing expenses is greater than 40% of all household expenses, after deducting any housing allowances. Hence two tables for each category of housing: in one we monitor individual EU countries 2009 to 2020; and in the other the course/development in individual years across EU countries.
Owner with no outstanding mortgage or housing loan
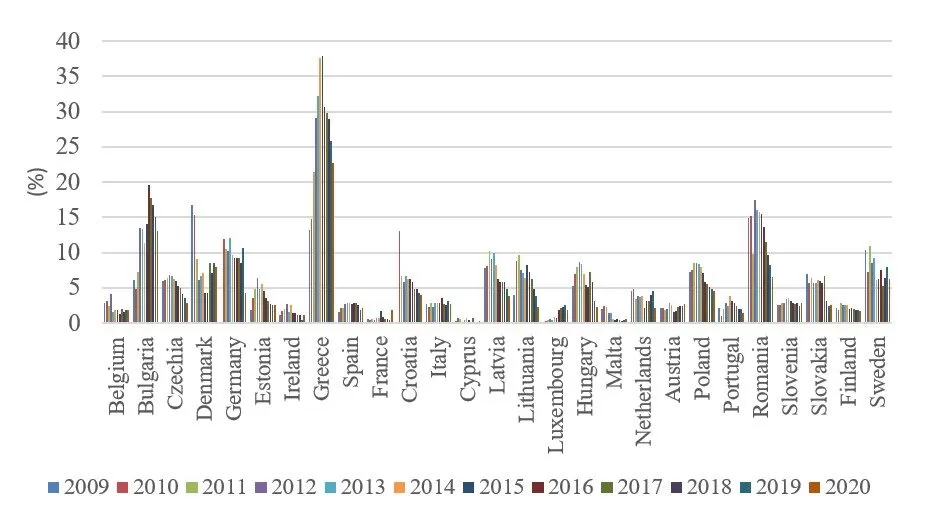
The most overburdened with housing expenses are Greeks, where over the years these expenses or the percentage of households with expenses above 40% varies from 37.9% in 2016 to the current 22.7%. The country with the smallest share of overburdened with housing costs is Cyprus, which fluctuated slightly over the years but was based on a value of 0.3% and in 2020 shows the same value. Luxembourg also has a low proportion of overburdened in this category. In twelve years, this share climbed from 0.2 to 1.8%, and represents the largest increase in housing costs in twelve years. Belgium and France share third. The paradox is that Belgium has improved according to the indicators, while France is 1.9% as the worst in 12 years. Slovakia in this housing category improved from 6.9% to 2.6%.
Fig 1. Owner with no outstanding mortgage or housing loan
Source:EU-SILC version 2022; authors’ own illustration
When we analyse the overburden on households with housing expenses or overburden according to individual years of the observed period, the most households overburdened with housing expenses in 2009 were the Danes (16.7%), Romanians (14.9%), and Greeks (13.2%). In 2010, the ranking does not change although in Denmark the share of households with overburdened households is slightly down, while in Romania and Greece it’s up. Since 2011, the share of Greek households overburdened with housing expenses has been rising rapidly and culminated in 2015 at 38%. Greece can be said to be “leading” in housing expenditure overburden up to the observed year 2020 with 22.7%, which is the highest among EU states. Countries with the most favourable situation in terms of housing expense overburden are Cyprus (around 0.3%), as well as France, Luxembourg, and Malta.
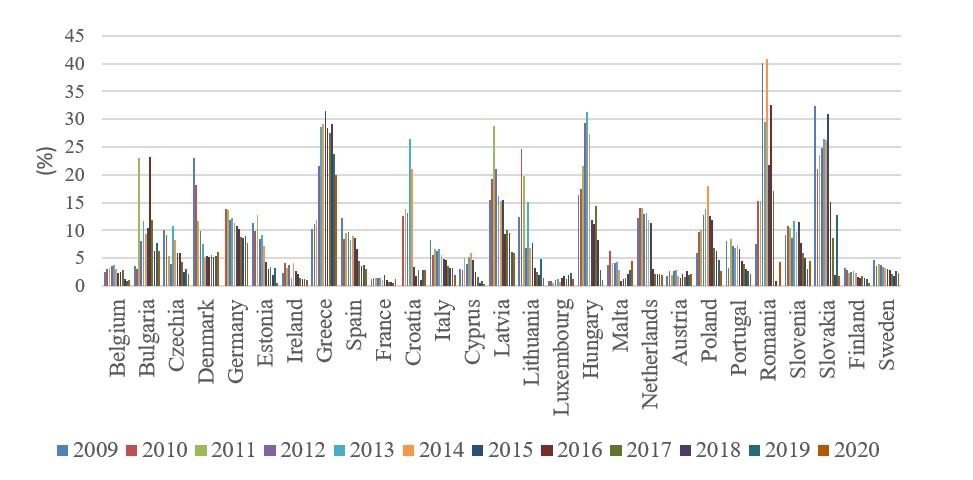
Owner with a mortgage or loan
In this category, Luxembourg is again the best and household overburden during the examined period of 12 years fluctuates from 0.7 to 2.4, which was the worst value for this country and paradoxically over the years there was a 1.5-multiple increase, which is the third (after Greece and Bulgaria) most significant increase over 12 years. It is worth noting what values have been included over the years. In Greece, the overburden values also range in two-digit values, in tens, while in Luxembourg they are at most units or even tenths. What does it say about the quality of life in individual countries?
Fig 2. Owner with a mortgage or loan
Source:EU-SILC version 2022; authors’ own illustration
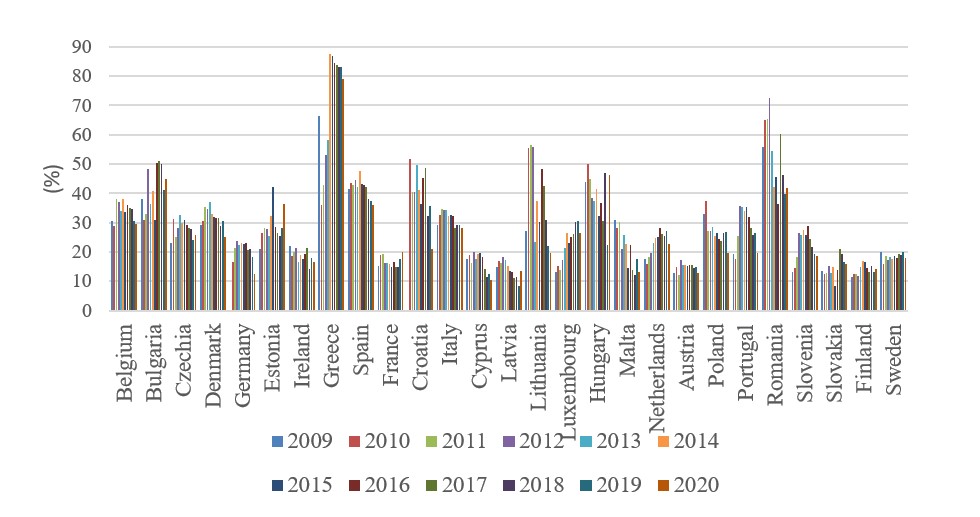
Tenant with rent at market price
Households living in rented apartments under market conditions are overburdened with housing expenses to the greatest extent. Again, it is Greece where almost all households in this housing category are most overburdened with housing expenses (2014, 2015, 2016, 2017 from almost 88% to the current 80%). The next such country is Hungary from 40% to 50%, with Spain not far behind. With the difference that Spain in 2020 reached 35.9%, with Hungary at 46.4%. Paradoxically, Hungary reached the lowest value in 2019. Could the COVID-19 pandemic be affecting it and the market rent fall or the decreased number of rentals? The country with the lowest overburden in this category of housing is Cyprus with 10.5% in 2020, even though from 2010 to 2016 this value was almost twice as high as now. Germany is another country where housing on the market principle is relatively acceptable at 12.3% at the moment, as well as Austria’s 12.7% which has changed little over 12 years. This shows the stability of this market segment.
Fig 3. Tenant, rent at market price.
Source:EU-SILC version 2022; authors’ own illustration
When we look at individual countries in a specific year, at the beginning of the period Finland vs. Greece are the best compared to the worst, and since 2010 Finland vs. Romania with a difference of 50 to 60%. In 2012, Slovakia had the smallest share of overburdened in the given category among EU countries, and since 2016 it has been Latvia and Cyprus, and in 2020 also Germany. Greece and Romania are most overburdened by housing expenses in the given category. The values range from 36.3 to 72.7 over the years, currently 41.9%. The situation is even worse in Greece, with 36% in 2010 to 87.5% in 2014. Currently, this value is in a slight decline at 79.2%.
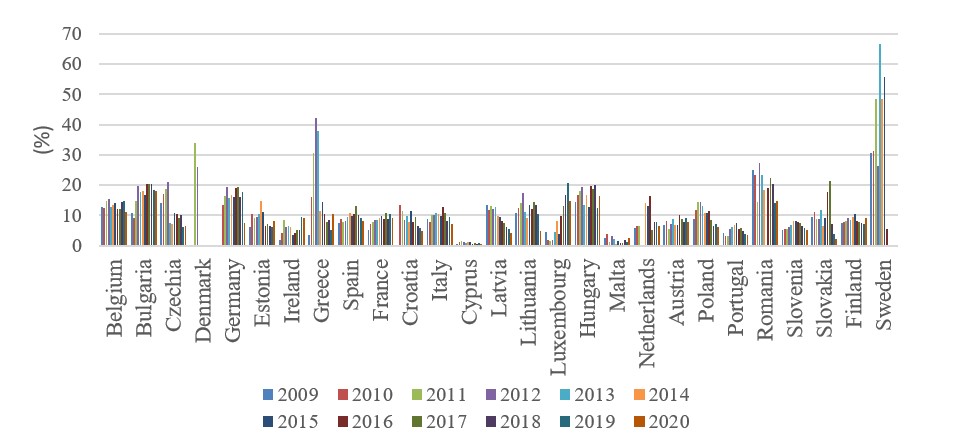
Tenant with rent at reduced price or free
Paradoxically, the most overburdened country in this category was Sweden but from 2011 to 2015 and then quickly the problem was addressed, and from 2017 to the present it reached 0. Other countries with low values are Cyprus, Slovakia, Malta, and Portugal. 2020 appears to be the best year for all EU countries in terms of overburdened or least overburdened during the monitored years. Households in the given category of housing in Cyprus are the best off during the entire monitored period. The worst was Sweden after 2016, and in that year (2016) Bulgaria becomes the worst country in the monitored category.
Fig. 4: Tenant with rent at reduced price or free
EU-SILC version 2022; authors’ own illustration
Methodology
We used box plots to visualize the data. Outliers are marked with a ball. These are values that are farther from the upper quartile than 1.5 times the interquartile range.
Pearson’s correlation coefficient is a measure of linear dependence; the Pearson correlation r varies between -1 (perfect negative correlation) to +1 (perfect positive correlation) (Weisenberg, 2005). According to Cohen (1988, 1992), the effect size is low if the value of r varies around 0.1, medium if r varies around 0.3, and large if r varies around 0.5.
We quantified the similarity of countries in terms of analysed shares using hierarchical cluster analysis. Among the clustering methods, we chose Ward’s method. We used a tanglegram to visually compare the clusters in 2009 and 2020. The Baker-Hubert gamma index (Kaufman, Rousseeuw 2009) is a measure of association (similarity) between two hierarchical clustering trees. The value can range between -1 and 1. Values close to 0 mean that the two dendrograms are not statistically similar.
Results and Discussion
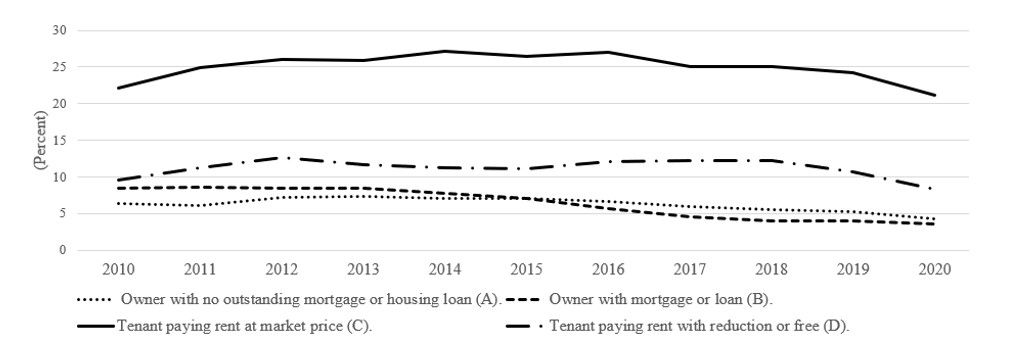
We mentioned households overburdened with housing expenses into the poverty trap exacerbated by the post-pandemic period, war, and high inflation. The situation in all mentioned categories of housing and the graph’s downward trend in overburdened households sounds paradoxical. We see the reason in the fact that adult-age children remain living in the same household with their parents much longer than was customary. This has an impact on household income, which thus increases and reduces the share of expenses below the 40% threshold. This directly improves the situation in the Owner with no outstanding mortgage or housing loan category. But even in the Owner with mortgage or loan categories that includes only households with well-paid jobs, others would not currently receive a mortgage. Tenant with rent at market price is a form of housing mostly for households with a relatively well-paid job. The category Tenant with rent at reduced price or free includes the poorest households, but in many countries this segment is relatively narrow. The dynamics of partially dependent living, such as prolonged cohabitation of parents, vary considerably between nations (Tomaszewski et al., 2017), which again emphasizes the role of social systems in the context of the housing market (Arundel and Ronald, 2016; Lennartz et al., 2016; Preece et al. 2020). Overcrowding within the EU in all four categories has a decreasing tendency (Fig. 5). However, there are differences between individual countries.
Fig 5. Housing overburden in the European Union
Source:EU-SILC version 2022; authors’ own calculation and illustration
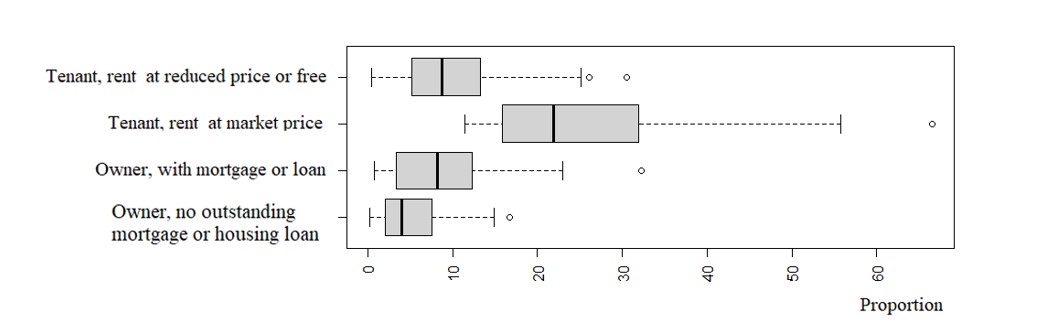
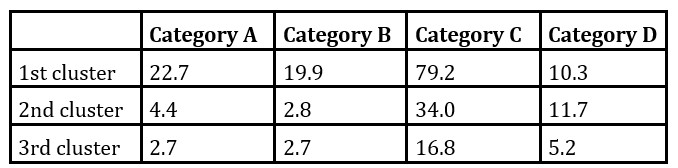
Greece, Romania, and Bulgaria show worse values than the EU 27 average in all four mentioned housing categories. In the category Tenant with rent at market price and Tenant with rent at a reduced price or free, in addition to Hungary, developed countries such as Luxembourg and Belgium also exceed the EU average values. As for the Owner with mortgage or loan category and exceeding the average value for EU countries, in addition to the already mentioned countries are also Denmark, Germany, Malta, Latvia, and Slovenia. The median values are the lowest for category A, followed by category D and category B (with very close values). Category C has the highest median. An extremely high value of congestion in category A is shown by Denmark (16.7), in category B Slovakia (32.3), in category C Greece (66.5) and in category D the countries Sweden (30.5) and Denmark (26.1).
Fig 6. Overburden in four categories in 2009
Source:EU-SILC version 2022; authors’ own calculation and illustration
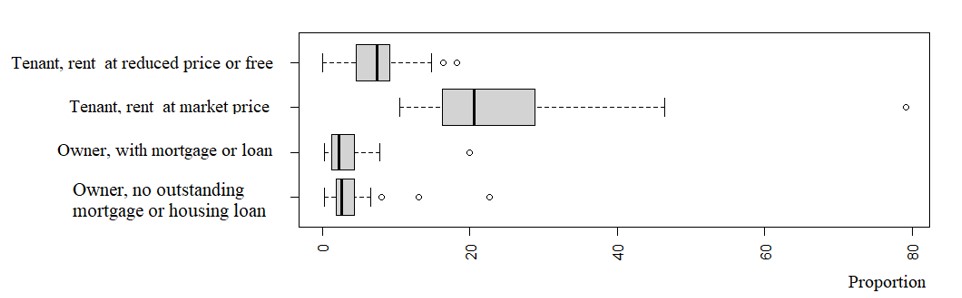
As we can see from Figure 1 to Figure4, the largest overburdened in 2020 is in the category Tenant with rent at market price in all countries, with the largest in Greece, Hungary, Bulgaria and Estonia. The smallest overburdened is in the category Owner, no outstanding mortgage or housing loan, and that in Cyprus, Ireland and Malta. Next is the category Owner with a mortgage or loan. The category Tenant with reduced rent or free is second in terms of “score for overburdened housing expenses”, which may seem illogical because it is a market with reduced, subsidized or completely forgiven rent. Yet this group includes households with very low incomes unable to get a mortgage or afford housing under market conditions. These low incomes mean they’re second in terms of overburden. The highest share of overburden is in the Tenant, rent at market price category. The value for Greece is up to 79.2. As we can see from Figure 7, this value is extremely high – an outlier. We also see that the median is the highest for this category, as is the quartile range. Outliers for category Owner with no outstanding mortgage or housing loan (A) are Greece, Bulgaria, Romania. Outliers for category Owner with mortgage or loan (B) are Greece, Germany and Bulgaria, for category Tenant paying rent with reduction or free (D) are Bulgaria and Hungary.
Fig 7. Overburden in four categories in 2020
Source:EU-SILC version 2022; authors’ own calculation and illustration
During the evaluated period of 2009 – 2020, the growth of overburden in individual categories in the EU states was different (Figure 8). This was also reflected in the change in the dependencies of overfilling in individual categories (Figure 9and Figure 10).
Fig 8. Growth of overburden in four categories during the years 2009 and 2020
Source:EU-SILC version 2022; authors’ own calculation and illustration
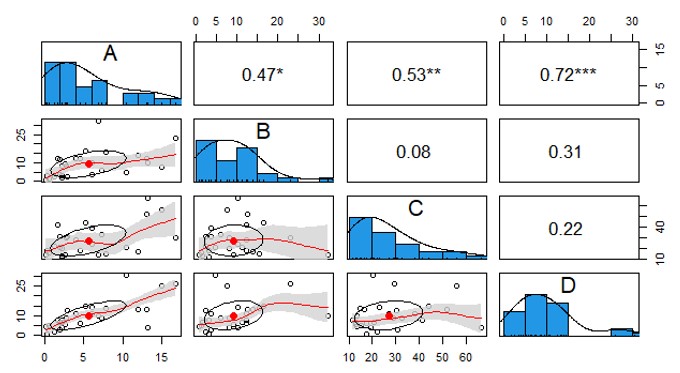
Figures 5 and 6 show the scatterplot, histogram, and Pearson correlation coefficients among the four categories of overburdened housing expenditures. Based on correlation coefficients (but also scatter diagrams and histograms), we can conclude that the development of overburden in the evaluated years 2009 to 2020 passed turbulent changes. The Baker-Hubert gamma index value is 0.0462, which means that the dendrograms in Figure 7 are not statistically similar. While in 2009 the dependence between A and D was significant, in 2020 it is not. The dependence between C and D was not significant in 2009 and is significant in 2020. The independence between C and B in 2009 (r = 0.08) is strongly significant in 2020 (0.63).
Fig 9. Scatter plot, histogram and Pearson’s correlation coefficients and their significance (2009)
Source:EU-SILC version 2022; authors’ own calculation and illustration
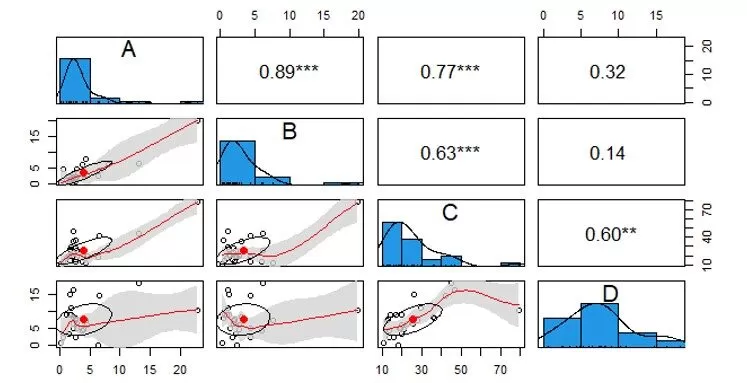
Figure 10 shows the Scatter plot, histogram and Pearson correlation coefficient and its significance; the categories Owner with a mortgage or loan and Owner with no outstanding mortgage or housing loan show the greatest dependency in the overburden of housing expenses. According to Cohen, this dependence is very high. All dependencies are provable except for Owner with no outstanding mortgage or housing loan (A) and Tenant with rent at reduced price or free (D), and also between Owner with mortgage or housing loan (B) and Tenant with rent at reduced price or free (D). There is a high dependency between the categories Tenant with rent at market price (C) and Owner with mortgage or loan (B), and just as much dependence between the categories Tenant with rent at reduced price or free (D) and Tenant with rent at market price (C).
Fig 10. Scatter plot, histogram and Pearson’s correlation coefficients and their significance (2020)
Source:EU-SILC version 2022; authors’ own calculation and illustration
In the European area, housing policy and making decent housing available to the population is primarily the responsibility of national governments. Thus, the issue of housing and housing policy has an autonomous status within the EU. This means that the EU and its institutions do not have direct competence, and housing policy does not fall under the common policy of the EU. The EU maintains the principle of subsidiarity, which means that the EU deals with housing issues only if it is possible to better achieve the set goals through EU bodies than through individual member countries. The EU indirectly influences the area of housing in its member countries mainly through measures in the framework of the fight against social exclusion and poverty, in the field of care for disabled persons, further through measures for regional policy, immigration policy, policy in the field of environment and sustainable development and, of course, measures in the economic policy of the state. As a result of the already mentioned socio-economic and political factors, the characteristics of clusters of states differ, as does the membership of states in individual clusters (Baker-Hubert gamma index is 0.0462).
Social housing is one of the tools for solving the social situation of disadvantaged population groups. Some EU countries have a high share of social rental housing. The share of social housing in Austria in 2020 was 24 percent. The number of new social housing apartments in 2020 was 17,000 and the number of deeply renovated ones was 7,400 (Housing Europe, 2021). The share of Tenant with rent at reduced price or free is below the EU average. Social housing in Denmark is 21.0 percent. Public rental housing in Sweden is 17 percent. Total social housing in the Netherlands is 29.1 percent. Total social housing in France is 16 percent. This group is made up of economically developed countries that have been solving housing problems for a long time and it seems very effective. For example, Austria, where housing prices are overvalued according to experts by 17% (up to 24% in Vienna), has a high, already mentioned 24%, share of social housing.
The second group consists of countries with a low share of social housing; Total public rental in Finland is 11 percent; in Ireland it is 9 percent. Countries have their specifics. Cost rent or cost-based rent is a new form in social housing. In Ireland, where social housing has historically been based on tenants’ income. The share of social rental apartments in Luxembourg is only 1 percent. The number of newly built or renovated social housing is low. However, it should be mentioned that a large number of employees in Luxembourg come to the country for employment from abroad, where they have cheaper apartments or cheaper housing than in Luxembourg itself. Total social housing in Belgium is 5.4 percent. As part of the renewal plan, they are going to build 1,000 social apartments. In Germany, total social housing is only 3.0 percent. It is slightly more, 3.8 percent, in Italy. In Portugal, Total social housing is represented by 2.0 percent. In Spain, it is 1.1 percent. Although home ownership remains the predominant housing tenure in Spain, demand for rental housing has increased in recent years, particularly among young people in urban areas. There is no social rental sector in Greece, which is why apartments are so overcrowded.
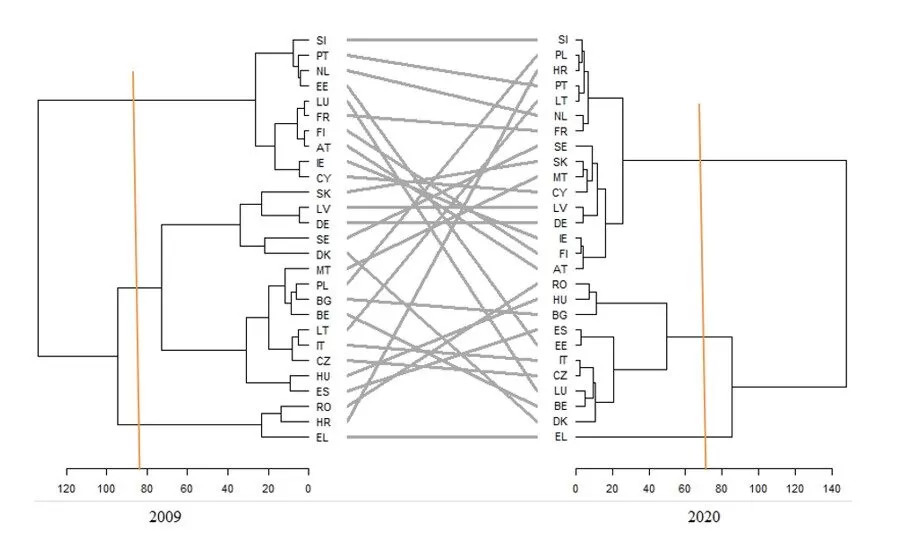
Fig 11. Tanglegram between the 2009 and 2020 dendrograms
Source: EU-SILC version 2022; authors’ own calculation and illustration in R
Another special group consists of post-communist countries, which suffer from the consequences of the massive privatization of the housing stock, which took place in the nineties of the last century. This decimated the public rental sector to a minimum, and a solution in practical form has not yet appeared. In the Slovak Republic (SR), almost 90% of houses and apartments are privately owned. Within the countries of the European Union (EU), only Estonia, Bulgaria and Romania have a higher proportion of apartments in private ownership. In EU countries, the share of rental apartments ranges from 19% to 62%, while the public rental sector represents on average 18% of the housing stock. The mentioned facts show that access to rental housing is very limited in the Slovak Republic, which, among other things, adversely affects the possibility of labor force mobility. While in the Czech Republic, Poland, and Hungary, the share of the poor whose housing has serious deficiencies is significantly decreasing, in Slovakia it is increasing. There is the lowest number of apartments per thousand inhabitants and the availability of rental apartments in the public rental sector is one of the lowest in the EU. There is no social housing as such in the Czech Republic. Total cooperative housing stock is 9.4 percent. For many years, the Czech Republic suffered from a lack of affordable housing and solutions for the needs of specific groups, such as starter apartments, apartments for seniors, as well as single-person households or households with a medium income. Slovenia has 6 percent of the public rental sector with subsidized rent (Housing Europe, 2021). In Estonia, cooperative housing is represented by 70 percent.
We can say that clusters of countries reflect more or less the economic level in the countries. The more economically developed countries are, the clearer their concept of housing policy is, and they find solutions for all population groups so that they are not excluded from the possibility of having adequate housing. Post-communist countries have almost no public rental sector. They do not yet offer clear and concrete solutions so that the situation in housing availability and the burden of housing expenses will significantly improve.
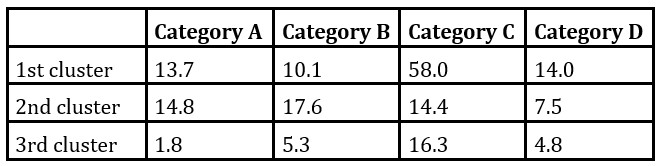
In 2009, Greece was in one cluster together with the countries of Croatia and Romania. The average value of overburden in category C is extremely high (58.0). In 2020, Greece was in a separate cluster. In 2009, the second cluster consisted of Spain, Hungary, Czechia, Italy, Lithuania, Belgium, Bulgaria, Poland, Malta, Denmark, Sweden, Germany, Latvia, Slovakia. The third cluster consists of Cyprus, Ireland, Austria, Finland, France, Luxembourg, Estonia, Netherlands, Portugal, Slovenia. The average value of the overburden in category A is only 1.8. Also, the value in category B is only 5.3.
Table 1: Average values of overburden for individualcategories in 2009
Source: EU-SILC version 2022; authors’ own calculation
Only Greece in 2020 is in the first cluster. In the second cluster are the countries Belgium, Bulgaria, Czech Republic, Denmark, Estonia, Spain, Italy, Luxembourg, Hungary, and Romania. The second cluster consists of countries with the highest share of overburden in category D (they are comparable to Greece). The third cluster is typical in that the countries that belong there show the lowest overburden in each category.
Table 2: Average overburden values for individual categories in 2020
Source: EU-SILC version 2022; authors’ own calculation
Until recently, continued economic growth and expanding mortgage markets had an impact on home ownership growth. This trend is also “supported” in many EU countries by the fact that there is not enough rental housing available, especially public rental housing. The need for such housing is acute in countries that joined the EU after 2004. New EU member countries such as Slovakia and the Czech Republic, where after the privatization of the housing stock at the turn of the century, only a little over 2% of the housing stock remained in the public rental sector. The situation is very slowly starting to change. Rents in the private sector are high, which is why many households decided to own housing, especially when mortgage loans were favourable. The trend towards the dominance of home ownership was not limited to Europe, it was characteristic in developed countries including the USA, Australia, and Canada, as well as East Asia (Doling 2013). In recent years, due to several factors, such as the Covid 19 pandemic, a high rate of inflation, war conflicts, even on the borders of the EU, the fear of losing jobs, the situation has changed and thus also the availability of mortgage loans. Many young people delay becoming independent and live longer with their parents, who help them financially in this way.
The countries of Southern and Eastern Europe will help young people mainly through shared housing (Lennartz et al., 2016 ). As stated by Preece et al. (2020), in many European countries the availability of housing and the level of housing ownership have been declining, which was accelerated by the global financial crisis (Arundel and Doling, 2017; Dewilde and De Decker, 2016) and actually by the COVID19 pandemic.
Conclusion
The discussion implicitly leads to EU countries’ housing policies focusing on expanded access to housing in the Tenant with reduced rent price or free category. It means building and expanding the public rental sector. The discussion implicitly leads to the recommendation that EU countries’ housing policies focus on expanded access to housing in the category of rent at a reduced price or without a fee, i.e., building and expanding public rental sector housing. Considering the importance of housing, and the current economic situation when many households are struggling with increased expenses, we want to show and encourage the competent people to have an active housing policy. A home and a job are basic conditions for a dignified life. Differences between the countries are not only from the historical data of the housing fund, housing policy, but also from GDP per capita, employment/unemployment, average wages, inflation and, subsequently, interest rates on mortgage loans and the associated availability of housing. These results can be used to support specific steps in housing. Considering the multiplicative effect of housing, not only construction would be supported but also other sectors and thus also the labour market, which is important during economically difficult times. We believe that funds from EU funds could be used (Fond of rehabilitation), and thus both economic and social development will be supported.
References
Arundel, R. and Doling, J. (2017), ‘ The end of mass homeownership? Changes in labour markets and housing tenure opportunities across Europe, ‘Journal of Housing and the Built Environment, 32(4), 649-672.
Arundel, R. and Ronald, R. (2016), ‘Parental co-residence, shared living and emerging adulthood in Europe: Semi-dependent housing across welfare regime and housing system contexts, ‘ Journal of Youth Studies, 19(7), 885-905.
Cohen, J. (1988), Statistical Power Analysis for the Behavioural Sciences (2. Edition). Hillsdale, NJ: Lawrence Erlbaum Associates, Publishers.
Cohen, J. (1992), ‘A power primer, ‘ Psychological Bulletin, 112(1), 155– 159.
Dewilde, C. (2018), ‘Explaining the declined affordability of housing for low-income private renters across Western Europe, ‘ Urban Studies, 55(12), 2618-2639.
Dewilde, C. and De Decker, P. (2016), ‘ Changing inequalities in housing outcomes across Western Europe. Housing, ‘ Theory and Society, 33(2), 121-161.
Doling, J., Vandenberg, P. and Tolentino, J. (2013), ‘ Housing and housing finance-A review of the links to economic development and poverty reduction,’ Asian Development Bank Economics Working Paper Series, (362).
Dragulescu, A. and Arendt, C. (2020), xlsx: Read, Write, Format Excel 2007 and Excel 97/2000/XP/2003 Files. R package version 0.6.5. Available: https://CRAN.R-project.org/package=xlsx
Eurostat: Housing in Europe — 2021, 2021. ISBN 978-92-76-43350-7
Galster, G. and Lee, KO. (2021), ‘ Housing affordability: A framing, synthesis of research and policy, and future directions, ‘ International Journal of Urban Sciences, 25(sup1), 7-58.
Haffner, M. and Boumeester, H. (2015), ‘ Housing affordability in the Netherlands: The impact of rent and energy costs, ‘ Journal of housing and the built environment, 30(2), 293-312.
Kaufman, L., Rousseeuw, P.J. (2009), Finding groups in data: an introduction to cluster analysis, vol. 344. John Wiley & Sons, 2009
Lennartz, C., Arundel, R. and Ronald, R. (2016), ‘ Younger adults and homeownership in Europe through the global financial crisis, ‘ Population, Space and Place, 22(8), 823-835.
Lerman, DL. and Reeder, WJ. (1987), ‘ The affordability of adequate housing, ‘ Real Estate Economics, 15(4), 389-404.
McGranahan, G. (2015), ‘Realizing the right to sanitation in deprived urban communities: meeting the challenges of collective action, coproduction, affordability, and housing tenure, ‘ World development, 68, 242-253.
Mulliner, EK. and Maliene, V. (2012), ‘ What attributes determine housing affordability? ‘ World Academy of Science, Engineering and Technology, International Science Index, 6(7), 576-581.
Mulliner, E. and Maliene, V. (2011), ‘Criteria for sustainable housing affordability, ‘Proceedings of the 8th International Conference Environmental Engineering, ISBN 978-9955-28-829-9, May 19–20, 2011, Vilnius, Lithuania
Preece, J., Crawford, J., McKee, K., Flint, J. and Robinson, D. (2020), ‘Understanding changing housing aspirations: A review of the evidence, ‘ Housing Studies, 35(1), 87-106.
R Core Team (2021), R: A language and environment for statistical computing. R Foundation for Statistical Computing, Vienna, Austria. Available: https://www.R-project.org/.
Revelle, W. (2022) psych: Procedures for Personality and Psychological Research, Northwestern University, Evanston, Illinois, USA. Available: https://CRAN.R-project.org/package=psych Version = 2.2.5.
Robinson, M., Scobie, G. M. and Hallinan, B. (2006), ‘ Affordability of housing: concepts, measurement and evidence,’ New Zealand Treasury Working Paper, No. 06/03
Schieferdecker, A. ‘Two Perspectives on The Housing Crisis: Affordable Housing vs Housing Affordability, ‘ Streets, MN, Available: streets.mn
Tal Galili (2015). dendextend: an R package for visualizing, adjusting, and comparing trees of hierarchical clustering. Bioinformatics. DOI: 10.1093/bioinformatics/btv428
Tomaszewski, W., Smith, JF., Parsell, C., Tranter, B., Laughland-Booÿ, J. and Skrbiš, Z. (2017), ‘Young, anchored and free? Examining the dynamics of early housing pathways in Australia, ‘ Journal of Youth Studies, 20(7), 904-926.
Weisberg, S. (2005), Applied linear regression (Vol. 528), John Wiley & Sons.
Yang, Z. and Chen, J. (2014), Housing affordability and housing policy in urban China (pp. 15-44). Berlin: Springer.
Yang, Z., Yi, C., Zhang, W. and Zhang, C. (2014), ‘Affordability of housing and accessibility of public services: evaluation of housing programs in Beijing, ‘ Journal of Housing and the Built Environment, 29(3), 521-540.