Bucharest University of Economic Studies, Bucharest, Romania
Volume 2020,
Article ID 215473,
Journal of EU Research in Business,
11 pages,
DOI: 10.5171/2020.215473
Received date: 4 February 2020; Accepted date: 9 June 2020; Published date: 20 July 2020
Academic Editor: Andreea Claudia Serban
Cite this Article as:
Maria-Daniela TUDORACHE (2020)," Human Development in the European Union and its Determinants” Journal of EU Research in Business, Vol. 2020 (2020), Article ID 215473, DOI: 10.5171/2020.215473
Human development is one of the most important forms of development, which could enhance the sustainable development process. Through this paper, the evolution of human development index in the European Union was analysed in the period 2010-2017, and the effects exercised by its determinants were estimated. In this context, panel data was used for the period specified above and the Estimated Generalized Least Squares were applied, weighted with the Period SUR option. The results show an inverse relantionship between two variables (early leavers from education and training rate, and employment in agriculture) and the human development index. In addition, human development increases not only when the corruption dimension falls down, but also when life expectancy and gross fixed capital formation increase.
Keywords: Human Development, Corruption, Employment, Education
Introduction
Economics is a science that generally focuses on maximizing results, and for this reason, sometimes, it fails to address the social challenges that nations are facing. In some cases, the economic policies target utopic results, such as economic growth objectives, with no consideration to any social cost, or the fundaments of a healthy economic growth, namely human development.
Human development is related to the quality of health and education systems and the standard of living; these factors are also taken into consideration by the United Nations Development Programme (UNDP) in computing the Human Development Index, the most used proxy for human development in scientific economic literature. However, the main economic researchers followed the UNDP methodology in their attempts to assess the impact of human development drivers, but the author of this paper believes that there are also other variables that may drive the human development, as in the case of corruption. In this context, the drivers of human development were defined by using corruption, early education leavers rate (as a substituent for education), life expectancy (as the UNDP methodology indicates – as a substituent for health) and a combination of employment in agriculture and gross fixed capital formation (which may be relevant to the standard of living).
The motivation for choosing this topic was based not only on the lack of the studies focusing on the main drivers of human development at a granular level, as indicated above, but also on the fact that human development should be the first thing that economists consider in designing sustainable economic growth policies.
Bearing in mind all the mentioned arguments, the main objective of the paper is to determine the impact of human development drivers, which can be ensured by reaching the following specific objectives:
Estimating the impact of corruption on human development;
Computing the impact of early education leavers rate on human development;
Estimating the impact of life expectancy on human development;
Computing the impact of employment in agriculture on human development;
Estimating the impact of gross fixed capital formation on human development;
Validating the maximum verisimilitude of the estimators.
Literature Review
The scientific economic literature in the field of human development is vast, and many studies used different approaches to assess the impact of human development drivers. First of all, Dinu (2006) stated that the success of modernisation depends on the focus of the economic transformation on the human dimension, which can be driven by actions in the field of education, civic participation of the population and political will to promote the values of democracy and legality.
Shah (2016) showed that some determinants of the human development index, including literacy rate and life expectancy at birth, had a positive impact on human development, given that countries with a higher level of the mentioned exogenous variables also achieved a higher value of the human development index.
On the other hand, Sangali (2016) demonstrated that life expectancy at birth had a positive impact on the human development index, mentioning that the positive evolutions of the life expectancy shall be promoted by the government through high quality health programs. The author’s recommendation is that high quality health programs should be expanded to cover a bigger number of individuals to improve the access of the poor population to high quality medical services. Another author, Crafts (1997), examined the interaction between the index of human development and the growth of the gross domestic product per capita for 16 developed countries since 1870, concluding that the conventional measures which had supported the economic growth have led to an improvement in the life expectancy. Also, Khodabakhi (2011) examined life expectancy and education in India over the period 2005-2010, finding that low rates of life expectancy at birth led to a decline in the human development index. From another point of view, Farid (2010), stated that since the beginning of the Enlightenment, education has been considered the way by which human capital is formed, this being a therapy for the soul – necessary for human development.
Regarding the impact of investments on development, several authors (Jalava and Pohjola, 2002; Daveri, 2002 and Stiroh, 2000) found a positive relation between these two variables in the developed countries. Moreover, Bankole et al. (2011) showed that countries investing in technology, information and communication sectors also accomplished an increase in the human development index, given that this has the ability to improve the standards of living and educational outcomes. Mughal and Manzoor (1999) proved that high quality education leads to social development, given that the educational system will result in high-skilled people to hold responsible positions in public and corporate administrations.
Anderson (2010) analysed the effects of increased trade and investment on the US and Mexico, demonstrating that investment had a major impact on the human development index. Moreover, Arcelus et al. (2005) examined the effects of foreign direct investment on human development in the case of middle – and low-income countries, finding a positive impact on both country groups.
Sharma and Gani (2004) assessed the effects of investment on human development in two groups of countries and found that states with a higher level of human development attract more foreign direct investment, which also positively influences the human development in both country groups. Another opinion is that of Gokmenoglu et al. (2018), which states that foreign direct investments are very important for the host country, contributing to the human development and to the increase of the income of high-skilled graduates. This proves that attracting FDIs should be a priority in the policy-making process.
Mauro (1999) and Robinson (1999) stated that corruption generated great losses in political, economic and social dimensions, especially in lowering the level of investment (Rose-Ackermann, 1996). The direct relationship between corruption and human development was also analysed by Qizilbash (2001) and Akcay (2006), which found a negative impact of corruption on the dependent variable. This hypothesis was also supported by Bscherair and Tahtane (2017), but they argued their conclusion stating that corruption impede human development through the channel of political instability. Other authors (Nielsen and Haugaard, 2000) stated that this inverse relationship also affects the democracy state of play.
Jianu et al. (2019) concluded that the linkage between income inequality (a relevant indicator to the social dimension) and its determinants depend on the institutional quality. This kind of inequality is more persistent in countries with extractive institutions, which are also associated with states facing high levels of corruption.
Absalyamova et al. (2016) have shown that the stability of human capital development is largely determined by the high level of corruption in Russia, as the lower values of corruption being associated with increasing human development, reducing income inequalities and increasing economic growth rates.
Methodology
In this section, the techniques used to estimate the impact of the human development drivers are described, using a quantitative method to provide a rigorous construct for this analysis.
The used method aims to bring an added value in this field by examining the determinants of the human development index (HDI) over the analysed time period. In order to analyse this phenomenon, the author of this paper started from establishing and verifying the following hypotheses:
Human development index is positively influenced by life expectancy;
The increase in the number of early education and training systems leavers negatively influences the human development index;
The growth of corruption perception index (which reflects a fall in corruption level) leads to an increase in the human development index;
The increase of people employed in agriculture favors the fall of human development.
Human development index is positively influenced by gross fixed capital formation.
In this paper, the panel technique was used, given that this approach is considered effective because it improves the robustness of the estimation and increases the degrees of freedom. On the other hand, it may trigger other challenges, such as the correlation between cross-sections and heteroscedasticity.
For testing the stationarity, the Summary window was used, along with the automatic lag selection option, using Schwarz Criterion, which provides an overview of the following tests: Levin, Lin & Chu t*; Breitung t-stat; Im, Pesaran & Shin W-stat; Augumented Dickey-Fuller – Fisher Chi-Square; and Phillips-Perron – Fisher Chi-Square. The used technique indicated that the variables included in the model are stationary at the initial level, which encourages the use of an Autoregressive Distributed Lag (ARDL) model. However, the author of this paper has tried to isolate the impact of the autoregressive term, taking into account the specific lags of the independent variables in accordance with the economic theory.
To reach the main objective of the paper, the Estimated Generalized Least Squares (EGLS) method was used, weighted with the Period SUR option. This option was used to support the efforts for validating the model, and to avoid the occurrence of heteroskedasticity and the general correlations between cross-sections.
In the process of identifying the method for estimating the effects, the Hausmann test (which verifies the compatibility with the Random Effects Model) and the Redundant Fixed Effects – Likelihood Ratio (which checks the compatibility with the Fixed Effects Model) were used. The probabilities associated with the tests confirmed the compatibility with both models, which did not facilitate the choice of an optimal estimation method, especially, since the Fixed Effects Model does not allow the use of the Period SUR option. In this context, an estimation method was used without the effects that allowed the use of the mentioned option.
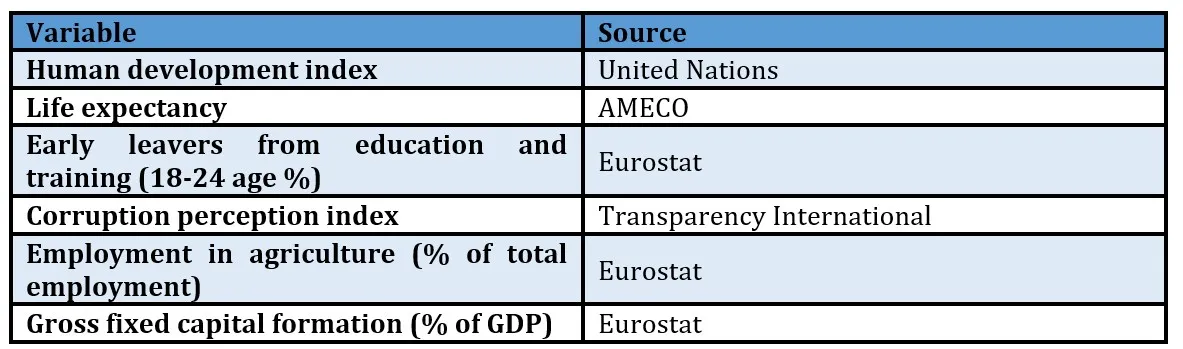
The data used in the paper have an annual frequency and cover the 2010-2017 period, for all 28 Member States of the European Union, in order to facilitate a comprehensive analysis of the human development. The statistical data used in the analysis are published by the United Nations, Transparency International, Eurostat and AMECO, as shown in Table 1. Following the introduction of these variables in the model, 196 observations were concluded.
Table 1: Structure of the model
Source: Own processing using Microsoft Office 2016
In order to verify the heteroskedasticity, the Breusch-Pagan-Godfrey test was used, for which the equation was estimated manually, given that the Eviews does not display this test result in the panel window. In this respect, the following equation was estimated:
, where hdi100 is represented by the human development index multiplied by 100, life_expectancy is represented by life expectancy expressed in the average age at birth , early_leavers is represented by the share of early leavers from education and training, corruption (-1) is represented by corruption perception index lagged by 1 year, employment_agriculture (-1) is the share of employment in agriculture from the total occupied population lagged by 1 year and gfcf represents the share of gross fixed capital formation in GDP, while represents the error ter.
Following the estimation of the equation, the ”CHISQ.DIST.RT(n*R2, Ω)” function was used from the Microsoft Office Excel software [where n is the number of observations (in this case, 196), R2 is the coefficient of determination and Ω is the number of degrees of freedom (in this case, 5)], to determine the probability associated with the Breusch-Pagan-Godfrey test.
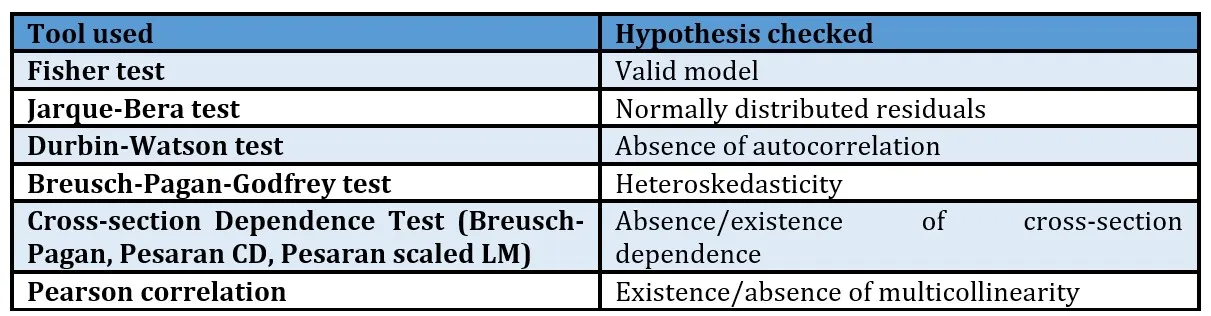
In order to check the autocorrelation of the residuals, the Durbin-Watson test was used, even if it is not a significant issue when using panel data (more details are presented in the next section). Lastly, in order to verify the maximum verisimilitude of the estimators, the Gauss-Markov hypotheses were examined, as shown in Table 2.
Table 2: Econometric tools used for validating maximum verisimilitude of the estimators
Source: Own processing using Microsoft Office 2016
Results and Interpretations
In this section, the impact of the human development drivers were analysed in all Member States of the European Union, and the verisimilitude of the obtained results were verified, as mentioned in the methodology.
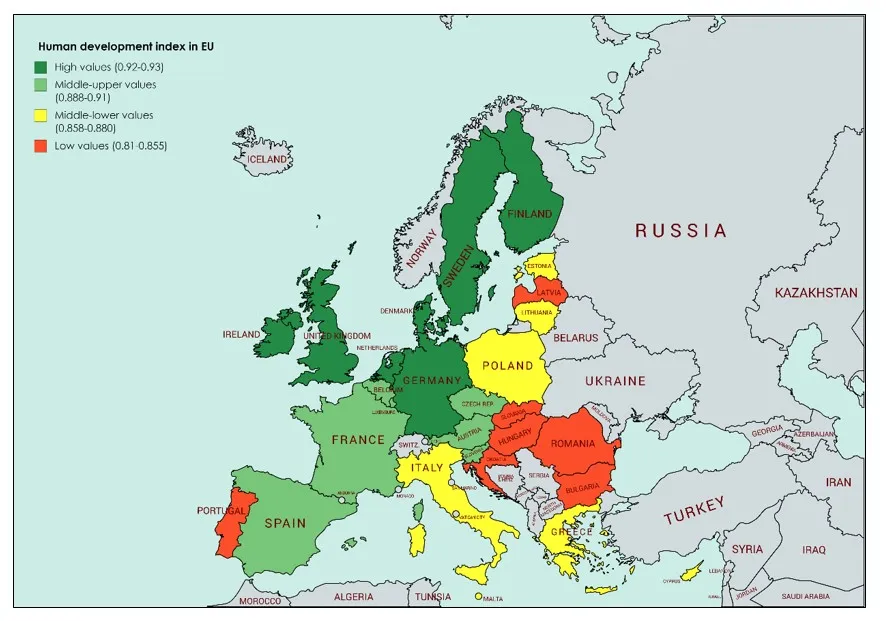
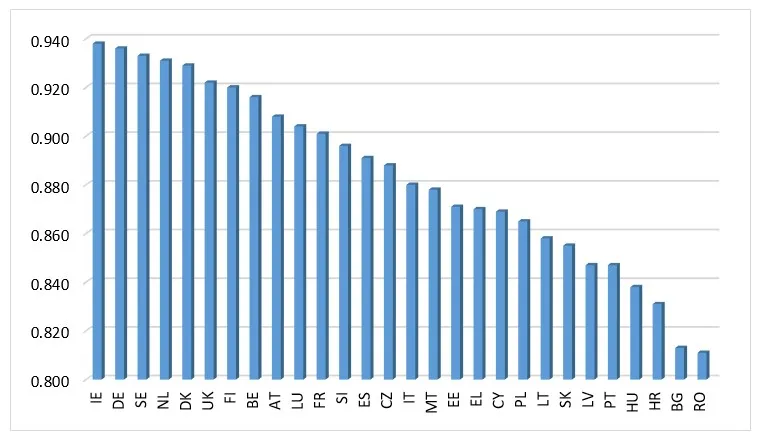
In Annex 1, the situation of human development in 2017 in all the Member States of the European Union have been illustrated. As can be seen, the highest values of human development index were recorded in Ireland (0.938), Denmark (0.936) and Sweden (0.933). At the opposite pole were Romania (0.811), Bulgaria (0.813) and Croatia (0.831). The main reason for their position is the fact that they were the last countries joining the European Union, which also had lower benefits from the structural funds, compared to the first joining countries. On the other hand, as can be seen in Annex 1, the states with the highest levels of this indicator are those from the Western Europe, which have adopted inclusive economic policies, being also supported by the European funds.
Fig. 1: Human development index in the European Union member states in 2017
Source: Own processing using United Development database
In Figure 1, the Member States of the European Union were clustered depending on the level of the human development index in four categories, with an equal number of countries. In the first category, are the states with the highest values of the human development index, with a value between the 0.920-0.938 interval. This category includes: IE, DE, SE, NL, DK, UK and FI. Then, the next category included BE, AT, LU, FR, SI, ES and CZ, with values between 0.888-0.916. The third category is represented by the IT, MT, EE, EL, CY, PL and LT, with a level of the human development index between 0.858-0.880. The last category of countries (lowest values of HDI, between 0.811-0.855) is composed by SK, LV, PT, HU, HR, BG and RO. As can be seen in Figure 1, the northern, western and central states of the European Union are the most developed countries, with the highest values of the HDI, except for Portugal. Eastern and Southern European Union Member States, and Portugal form the group of developing Member States, bearing in mind the lower levels of the indicator.
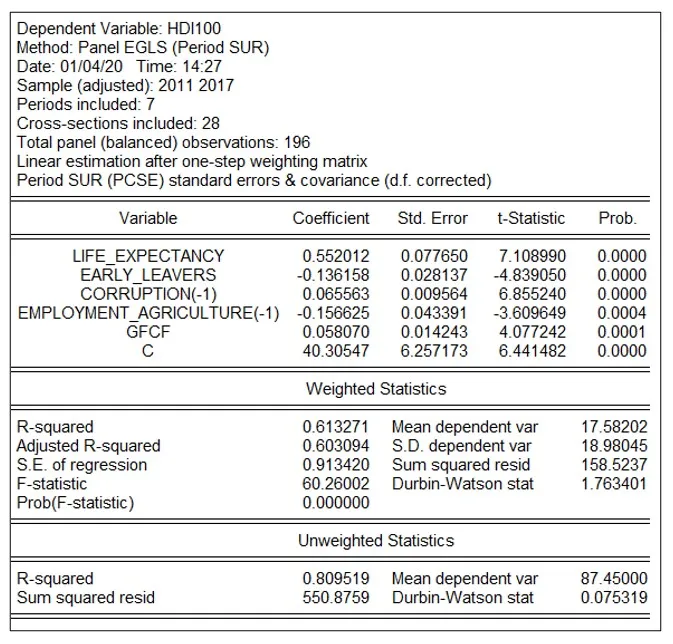
The obtained results, following the calculation of the impact of human development drivers were attached in Figure 2. As can be seen, the estimators are statistically significant, given that their probabilities are below the significance threshold of 5%. The value of R-squared (0.613271) confirmed the linearity of the regression and the appropriate choice of the regressors, as well as their evolution, explaining the fluctuation of the endogenous variables in a proportion of 61.32%. Also, the probability associated with the Fisher test is 0.00% (below the 5% significance level), which confirmed the validity of the econometric model from a statistical point of view.
Fig. 2: Estimation results
Source: Own processing using Eviews 9.0
Next, the impact of the exogenous variables on the human development index were presented. According to the results, the increase of life expectancy by one percentage point led to an increase in the human development index with 0.552012 deviation points in the analysed period. The reason is that countries with a higher life expectancy also have an educated and healthy population, unlike the situation of the developing Member States.
On the other hand, an increase in the early leavers rate by 1 percentage point led to a reduction of the human development index by 0.136158 deviation points. Underdevelopment brings about the inability of adolescents to access or continue university studies, which creates the premises of a lower level of education. Further, this limits the opportunities of people in the labour market and negatively affects wage expectations, which may cause a fall in the human development level.
From another point of view, when corruption perception index register a hike by one deviation point, the human development index increases by 0.065563 deviation points. The high values of the corruption perception index are associated with a lower level of corruption. Reducing corruption leads to a higher level of confidence of the population in government institutions, which leads to an economic stability in terms of production, consumption and investment, which ultimately favors development gains. In this context, high quality government institutions may have a positive effect on different forms of development, especially on human development.
Regarding the employment in agriculture, expressed as a percentage of the total employment, its increase by one percentage point led to a reduction in the human development index with 0.1516625 deviation points. A high employment rate in the agricultural sector determines a decrease in the human development due to the fact that the population employed in agriculture is facing issues related to their standard of living. Moreover, in the case of this category of population, human emancipation is limited, and in some cases, is progressing slowly.
This paper, also demonstrated that, an increase in the gross fixed capital formation (expressed as % of GDP) by one percentage point of GDP caused an HDI growth of 0.058070 deviation points. This can be explained by the fact that investments generate higher opportunities in the labour market for the active population by creating jobs and increasing wages channels, which increases the level of development.
The results show that the greatest impact of HDI drivers was obtained from the exogenous variables related to life expectancy (0.552012 pp). The increase in life expectancy is achieved by facilitating the access of population to a well-developed health system and, therefore, to a better life, which finally increases the human development level. On the other hand, the employment rate in the agricultural sector has the most negative impact on the HDI (0.156625), which confirms that the reduction of the employed population in this sector and their reallocation to better paid jobs lead to an improvement in the standard of living, which favors the positive evolution of the dependent variable.
Regarding the autocorrelation of the residuals hypothesis, the Durbin-Watson test was used. In this case, the values of dU and dL for 196 observations were checked with 6 degrees of freedom, as follows: dL =1.7035 and dU = 1.8296
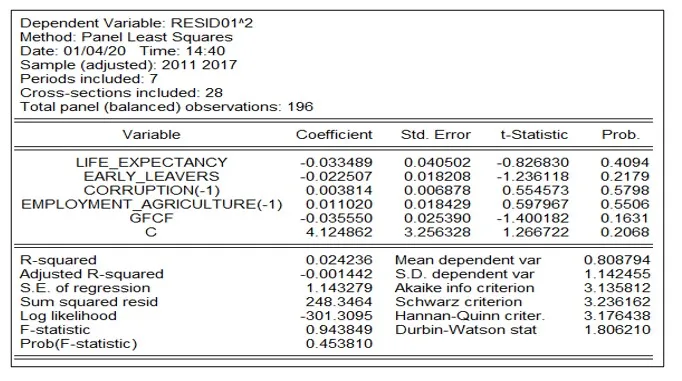
Fig. 3: Heteroskedasticity test
Source: Own processing using Eviews 9.0
Given that the value of the Durbin-Watson test (1.763401) is between dL and dU statistics, it was concluded that the test is inconclusive, which cannot recommend any decision related to the autocorrelation of the residuals. However, the problem of autocorrelation loses its importance in the case of panel data, and the author of the paper chose to ignore it, bearing in mind the result of the Durbin-Watson.
Furthermore, according to the methodology, the Breusch-Pagan-Godfrey test was processed (Figure 3). For the 5 degrees of freedom, the result of the test provided a probability of 9.06%, which confirms the hypothesis related to the model homoscedastic feature (the probabilities of exogenous variables have values higher than the significance threshold of 5%), this result being also in accordance with Gauss -Markov theorem.
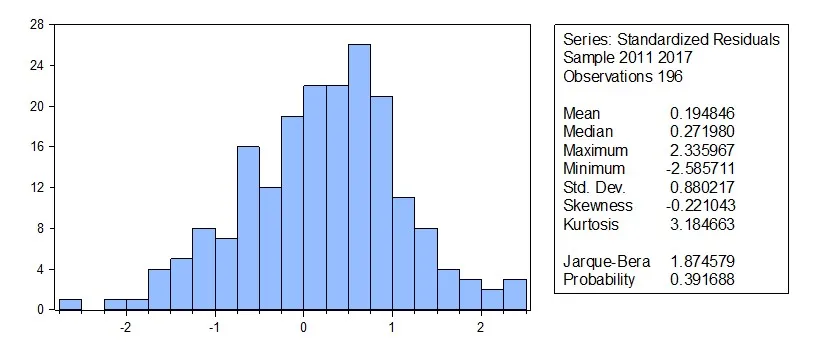
The result of the Jarque-Bera test was also calculated (Figure 4), whose associated probability (39.17%) confirmed that the errors are normally distributed.
Fig. 6: Jarque-Bera test
Source: Own processing using Eviews 9.0
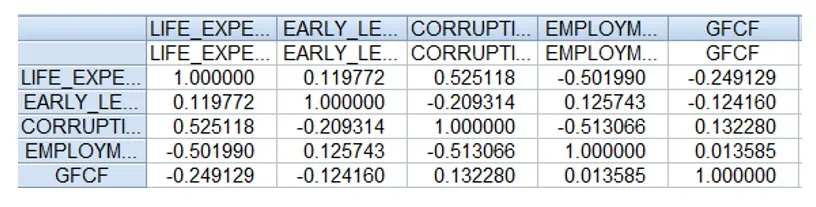
Finally, the Klein’s criterion was checked by comparing the correlations between the independent variables and the coefficient of determination. Given that the values of the correlations were below the level of the reference indicator, the absence of multicollinearity was accepted (Figure 7).
Fig. 7: Klein’s criterion
Source: Own processing using Eviews 9.0
Conclusions
Through this analysis, a positive relationship between life expectancy and human development was identified. This also confirms the fact that high life expectancy of the population, which can be ensured by reducing poverty, and improving the health and education systems, determines human development.
From another perspective, this analysis demonstrated that the increase of corruption perception index (which reflects a fall in the incidence of corruption) positively impacts the human development index. In countries where corruption incidence is low, not only citizens and resident corporates, but also investors have more confidence in the policies adopted by the government, which ensures a favorable environment for development.
Moreover, a positive relationship was found between gross fixed capital formation and human development index. In this case, a high level of investment creates more opportunities for population, which drives human development upward.
This paper also demonstrated the negative impact of early education leavers rate and employment in agriculture on human development. This fact shows that people leaving education early are more exposed to a low quality of life and poverty, compared to others with higher education. A high employment rate in the agricultural sector leads to the categorisation of a significant part of the employed population in a lower income category, which causes a decrease in the standard of living, and therefore, a reduction in the human development index.
Acknowledgment
This paper was co-financed by The Bucharest University of Economic Studies during the PhD program.
Absalyamova, S., Absalyamov, T., Khusnullova, A., Mukhametgalieva, C. (2016) ‘The impact of corruption on the sustainable development of human capital’, Journal of Physics: Conference Series, 738(1).
Akcay, S. (2006) ‘Corruption and human development’, The Cato journal, 26 (1), 29-48.
Anderson, J. B. (2010) ‘Effects of Increased Trade and Investment on Human Development in the U.S. and Mexican Border Communities’, The Journal of Developing Areas, 43 (2), 341-362.
Arcelus, F. J., Sharma, B., Srinivasan, G. (2005) ‘Foreign capital flows and the efficiency of the HDI dimension’, Global Economy Journal, 5(2), 1-12.
Bankole, F.O.,Shirazi, F. Brown, I. (2011) ‘Investigating the impact of ICT investments of human development’, Electronic Journal of Information Systems in Developing Countries, 8 (48), 1-19.
Becherair, A., Tahtane, (2017) ‘The causality between corruption and human development in MENA countries: a panel data analysis’, East-West Journal of Economics and Business, 20(2).
Crafts, N: F. R. (1997) ‘The Human Development Index and changes in standards of living: Some historical comparisons`, European Review of Economic History, 1 (2), 1-5.
Daveri, F. (2002) ‘The New Economy in Europe, 1992-2001’, Oxford Review of Economic Policy, 18(3), 345-362.
Dinu, M. (2006) ‘Escape from Alternative’, Theoretical and Applied Economics, 10, (10), 95-100.
Jalava, J., Pohja, M. (2002) ‘Economic Growth in the New Economy: Evidence from Advanced Economies’, Information Economics and Policy, 14 (2), 189-210.
Jianu, I., Dobre, I., Bodislav, A. D., Rădulescu, C. V., Burlacu, S. (2019) ‘The Implications of Institutional Specificities on the Income Inequalities Drivers in European Union’, Journal of Economic Computation and Economic Cybernetics Studies and Research, 53(2), 59-76.
Gokmenoglu, K., Apinran, M. O., Taspinar, N. (2018) ‘Impact of Foreign Direct Investment on Human Development Index in Nigeria’, Business and Economics Research Journal, 9 (1), 1-13.
Khodabakshi, (2011) ‘Relationship between GDP and Human Development Indices in India’, International Journal of Trade, Economics and Finance, 2 (3), 251-253.
Mauro, P. (1998) ‘Corruption: Causes, Consequences, and Agenda for Further Research’, Finance & Development, March Issue, 11-14.
Nielsen, M., Haugaard, J. (2000) ‘Democracy, Corruption, and Human Development’, Approaches to Development, University of Aarhus, Denmark.
Qizilbash, (2001) ‘Corruption and Human Development: A Conceptual Discussion’, Oxford Development Studies, 29(3), 265-278.
Robinson, M. (1998) ‘Corruption and Development: An Introduction’, Corruption and Development, Frank Cass, 1-13.
Rose-Ackermann, S. (1996) ‘Democracy and grand corruption’, UNESCO paper, 365-79.
Sangaji, J. (2016) ‘The Determinants of Human Development Index in Several Buddhist Countries’, Journal of Buddhist Education and Research, 2(1), 48-60.
Shah, S. (2016) ‘Determinants of Human Development Index: A Cross-Country Empirical Analysis’, National Institute of Bank Management, Pune, India.
Sharma, B., Gani, A. (2004) ‘The Effects of Foreign Direct Investment on Human Development’, Global Economy Journal, 4 (2), Article 9.
Stiroh, (2002) ‘Information Technology and the US Productivity Revival: What Do the Industry Data Say?’, American Economic Association, 92(5), 1559-1576.
United Nation (2019) ‘United Nation Database’, [online] available: <http://un.org/en/databases>.
United Nation Development Programme (2019) ‘Human Development Report 2019’, [online] available: <http://hdr.undp.org>.
Annex
Annex 1: Human development index in the European Union member states in 2017
Source: Own processing using United Development database