Eva Abramuszkinová Pavlíková1, Marcela Basovníková2 and Peter Huber3
1Mendel University in Brno, Faculty of Forestry and Wood Technology, Brno, Czech Republic
2Mendel University in Brno, Faculty of Business and Economics, Brno, Czech Republic
3Austrian Institute of Economic Research (WIFO), Wien, Austria
Volume 2021,
Article ID 253561,
Journal of EU Research in Business,
21 pages,
DOI: 10.5171/2021.253561
Received date: 21 October 2020; Accepted date: 30 August 2021; Published date: 11 October 2021
Cite this Article as:
Eva Abramuszkinová Pavlíková, Marcela Basovníková and Peter Huber (2021)," Corporate Social Responsibility Implemented by SA8000 Standard in Italy” Journal of EU Research in Business, Vol. 2021 (2021), Article ID 253561, DOI: 10.5171/2021.253561
In this paper, corporate social responsibility (CSR) adoption is measured by the implementation of SA8000 certification. This is one of the internationally most widely used social accountability standards for retailers, brand companies, suppliers and other organizations. Our study presents research by utilizing data on a group of Italian firms to assess the impact of the SA8000 standard on company profitability, wages and sales. We use synthetic control group methods to analyze the economic performance of single establishment manufacturing firms that underwent SA8000 certification in 2009 or 2010. We find positive and weakly significant effects of SA8000 certification on firms’ turnover to assets ratios, but no evidence of a positive or negative impact of SA8000 certification on firm profitability and wages. In a conclusion, SA8000 certification may be a viable marketing tool that increases company sales and firms may use such a certification to strengthen their position in worldwide delivery networks.
Keywords: Corporate Social Responsibility, Synthetic Control Groups, SA8000 certification, Company Performance
Introduction
The number of firms resorting to voluntary but costly external certification for social and environmental standards rapidly increased in the last decades. According to Kitzmueller and Shimshak (2012) more than one third of the large firms in the US resort to such certifications. As a consequence, research on the impact of corporate social responsibility (CSR) and of the certification of CSR activities on the economic performance of firms has boomed in recent years. Within this literature, the analysis has so far mainly focused on the impact of environmental standards such as ISO 14001 (e.g. Koe Hwee Nga 2009, Boulash et al. 2010, Heras‐Saizarbitoria et al. 2011 and De Vries et al. 2012). The impact of social accountability standards (e.g. ISO 28000 or SA8000) on financial performance has been much less considered. This especially applies to the SA8000 standard. For this widely used international social accountability standard two recent surveys (Hiscox et al., 2009 and Sartor et al., 2016) state that they are unaware of any evaluations of their impact on the financial performance of firms.
The current paper, therefore, extends previous research by using data on a small group of Italian firms to assess the impact of the SA8000 standard on company profitability, wages and sales. One important methodological challenge in such an evaluation is the potential endogeneity of the CSR practices (see Hiscox et al., 2009 for a discussion of this in the context of SA 8000 certification). We address this issue by using a synthetic control group method (Abadie and Gardeazabal, 2003 and Abadie et al. 2010).[1] As argued for instance by Fremeth et al. (2016) this method is particularly well suited for constructing comparison groups in cases where the sample of treated units is small as it avoids the arbitrariness involved in defining control groups.
Background
The starting point of our discussion is the rather large literature on the impact of CSR implementation on a firm’s financial performance (see Margolis and Walsh 2003, Orlitzky et al. 2003, Margolis et al. 2009, Hiscox et al. 2009, Benabou and Tirole 2010, Kitzmueller and Shimshack 2012 for surveys). This has followed two lines of reasoning to explain the impact of CSR on financial performance. The first is based on the assumption that consumers, investors and workers are indifferent as to how a good or service is produced, but that managers or owners prefer socially responsible production.[2] Proponents of this line of argument (e.g. Reinhardt et al. 2008, Melo 2012) suggest that CSR is undertaken to satisfy the preferences of managers or owners. Since more profitable firms are (all else equal) better prepared to cover the additional costs of CSR, this line of reasoning predicts that firm profitability causes CSR adoption, because higher profits allow managers and owners to implement CSR.
The second line of reasoning assumes that investors, consumers or workers prefer socially and environmentally responsible production and holds that CSR has a causal impact on a firms’ financial performance through a sale, credit and labor market channel. The sales channel arises if customers socially prefer responsibly produced goods. This implies that CSR adoption increases the demand (or the willingness to pay) for a firm’s produce. This will result in increased sales and higher profits if net revenues from increased sales exceed the costs of CSR implementation. The credit channel, by contrast, stresses that investors prefer CSR and will thus be willing to accept lower return (interests) on funds provided to firms applying CSR. If the savings from lower interest payments exceed the costs of adopting CSR, this too will improve a company’s financial performance. Finally, the labor channel argues that if workers (all else equal) prefer to work at socially responsible firms, this will increase their productivity either because working at such firms increases motivation or because socially responsible firms have more applicants and can thus choose to employ more productive workers. If this increase in productivity exceeds the cost of CSR adoption, this will also increase firm profitability.[3]
A large empirical literature aims to measure the correlation between CSR adoption and firm-level financial performance. This literature has recently been surveyed in encompassing meta-studies by Margolis et al. (2009) and Orlitzky et al. (2003). Margolis et al. (2009) survey 251 estimates the correlation between CSR and financial performance. They show that in average these studies demonstrate a weak positive correlation (of 0.13) between financial performance and CSR-adoption. Orlitzky et al. (2003) find a positive association between corporate social responsibility and firm financial performance, which is stronger for accounting-based measures of financial performance and CSR reputation indices.
Similarly, in the recent literature on the separate channels through which CSR adoption may affect firm performance El Ghoul et al. (2011) use a sample of over 12,000 US firms to show that investments into CSR, are significantly negatively correlated to a firms’ cost of equity. Tamm et al. (2010) focusing on the labor channel by using survey data from Estonia, Lithuania and Latvia show that employees in firms that are more socially responsible also have higher job satisfaction and work ethics and Korschun et al. (2014) find that employees in Fortune 500 firms that implement CSR policies are more customer-oriented. Furthermore Saedi (2015), in line with the sales channel, finds higher customer satisfaction among Iranian firms following CSR policies.
These contributions have differed in the definition of CSR and financial performance. With respect to the definition of the CSR-status of a firm some authors (e.g. Flammer 2015) use corporate disclosures, while others (e.g. Lin et al. 2009) focus on charitable donations and quite a few resort to various indices measuring the reputation of firms in implementing CSR (Wu 2013, Cavaco and Crifo 2014, Bechetti and Ciceritti 2009) or CSR awards (see Dasgupta, Laplante, and Mamingi, 2001; Jacobs, Singhal, and Subramanian, 2010; Klassen and McLaughlin, 1996). One drawback of these measures is that they provide only limited information on compliance with CSR practices. As a consequence, a number authors (e.g. Hiscox et al. 2009) advocate the use of industry standards or certifications to measure CSR implementation. This is because compliance to these is controlled by external auditors and because recent experimental evidence suggests that such standards are considered more credible signals of CSR by customers (Etile and Teyssier 2015).
With respect to the measure of financial performance authors focusing on firms listed on the stock exchange have used a firm’s value such as Tobins Q or the market value of a firm as these are likely to better reflect the long run profitability of a firm than bookkeeping shares (Becchetti and Ciciretti 2009, Becchetti et al. 2013). By contrast, contributions focusing on smaller enterprises or enterprises not listed on the stock exchange (e.g. Lin et al. 2009, Tsoutsura 2004, Wu and Shen 2013, Belu and Manescu 2013) have mostly focused on accounting proportions of profitability such as returns on assets and returns on equity.
The SA8000 Standard
In this paper, CSR adoption is measured by the implementation of SA8000 certification. This is one of the internationally most widely used social accountability standards for retailers, brand companies, suppliers and other organizations.[4] It is based on international agreements (including the International Labor Organization convention, Universal Declaration of Human Rights and the Convention of the Rights of the Child) and requires certified firms to adhere to a set of norms related to working hours, health and safety, prevention of discrimination, work of children and adolescents and forced labor. It also requires certified firms to respect the freedom of association, to follow a specific code of conduct with respect to disciplinary practices, to provide sufficient remuneration, to meet the basic needs of workers and to implement continuous control systems for improving working conditions In addition, SA8000 certified firms are required to provide a safe and healthy workplace environment and to take effective steps to prevent potential health and safety incidents and occupational injury or illness associated with, or occurring in the course of work. They are also required to abide to existing laws with respect to working hours and remuneration (Social Accountability International, 2015).
Any organization seeking certification with SA8000 must apply to an auditing firm accredited by Social Accounting Accreditation Services (SAAS), which acts as a certification body for the standard. The process consists of a preliminary assessment at the beginning of procedures. In this, any necessary improvements to meet the requirements in the standard are identified. This is followed by a certification audit, where the auditing firm examines whether the necessary improvements have been implemented and provides the certification if this is justified. After this the firm is subject to regular (annual or semi-annual) surveillance audits for three years, after which the certificate expires and must be renewed under simplified procedures. These surveillance audits ensure the continued compliance to the standard as well as continued improvements in meeting the standard and may result in a list of suggested improvements or even withdrawal of the standard in cases of severe abuse (see Gilbert 2001 and http://www.saasaccreditation.org/certification).
The out-of-pocket costs of certification consist of the costs of taking corrective and preventive action in order to comply with the standard, preparing and conducting the audit by a SAAS-accredited certifying body as well as the costs of taking corrective actions to resolve problems if nonconformities are identified. The certification bodies base their auditing activities on market prices depending on the size, scope, and location of the facility, at prices that typically range between $500 and $1,500 per day (http://www.saasaccreditation.org/certification-costs and Gilbert 2001).
Method
The central methodological issue arising in evaluating the impact of the standard on firms’ financial performance is the potential endogeneity of applying the standard. This arises because firms choose to adopt SA8000. Profit maximizing firms will therefore only do this if they expect certification to increase profits. Comparing firms implementing SA8000 to firms not implementing it, therefore implies comparing firms that expect to profit from SA8000 to firms that do not. Such a comparison will overstate the true effect of SA8000 adoption, if firm expectations of profitability of SA8000 adoption are met. To assess the impact of CSR certification on a firm’s sales, profitability and productivity, therefore, a comparison group of non-adopting firms that can be expected to have developed similarly to SA8000 adopting firms in the absence of adoption must be sought for.
In the current paper, we use synthetic control methods to define this comparison group. This method (introduced by Abadie and Gardeazabal 2003 and Abadie et al. 2010), has recently been used in many studies relating to various fields of economic analysis (e.g. Peri and Yasenov, 2015, Kreif et al. 2016, Billmeier and Nannicini 2013). It provides a systematic way to avoid the arbitrariness necessarily involved in defining ad-hoc control groups (e.g. industry averages) and to identify the impact of an event on a treated unit relative to a control group of untreated units at the hands of a control group that is derived by statistical methods. Furthermore, as emphasized by Fremeth et al. (2016) this method is particularly well suited in contexts such as ours, where few occurrences of treated units preclude the possibility of making strong inferences from traditional regression analysis.
The method consists of, in a first step, using data on firms that did not adopt SA8000 (referred to as the donor pool) to define a fictitious untreated firm (the synthetic control) that has developed as similarly as possible to the firm adopting the treatment prior to treatment. In a second step, then, the post-adoption development of the firm adopting SA8000 is compared to this fictitious firm. This method therefore, allows for identification of a reasonable control group and to conduct a difference-in-difference analysis on the outcomes of the certifying firm relative to the endogenously defined synthetic group. The method consists of considering N+1 firms (indexed by n) over a time period (indexed by ). Assuming that, without loss of generality, the first of these firms has certified for SA8000 for the first time in period , the vector of observed firm characteristics (Xn) can be defined, such that X1 denotes the treated firm’s characteristics and X= (X2,…,XN+1) the characteristics for firms in the donor pool in the pre-treatment period. The synthetic control method then consists of first estimating weights that produce a convex combination of firm characteristics among the donor pool so as to as closely as possible to the behavior of the variable vector (X1) of the treated firm in the pre-treatment period (i.e. up to ). This is done by choosing a vector of firm specific weights W=(w2,…wN+1), with and , to solve the minimization.
with V a kXk positive definite diagonal matrix (and k the number of firm characteristics included in X) which determines the weight for the contribution of each characteristic in the objective function and is chosen so as to minimize the standard error of the estimate. In a second step the weights calculated from this optimization are used to calculate hypothetical post treatment variables for the “synthetic control.” These are thus compared to the development of the variables of interest in the post treatment period in SA8000 adopting firms.
One issue related to this method is that it does not directly allow for hypotheses tests as is it is not clear what the standard deviation of the estimated effect is. Abadie et al. (2010) suggest applying procedures of classical permutation tests for inference in the synthetic control group analysis. These consist of applying the synthetic control method to untreated observations in the sample and simulating the distribution of deviations between the treated and synthetic control groups. Through this, the size of the difference between the synthetic control and the treated firm relative to the effects estimated for randomly chosen placebo firms can be assessed by standard difference-in-difference methods. To implement this approach, we conducted a synthetic control group analysis as above for a set of 250 randomly selected placebo firms from the donor pool and imposed a fictitious adoption in the same year as the treated firm.
A further issue with the synthetic control group method is that it is not entirely clear how to deal with multiple treated units. Abadie et al. (2010) suggest that in such a case, the treated units should be collapsed into a single unit by taking averages across the individual observations (see Kreif et al. 2016 for an application). We follow this suggestion by taking averages for all firms treated in 2009 and 2010 respectively and performing the synthetic control group analysis for these two aggregated firms. An advantage of this approach is that it reduces issues related to measurement error. A disadvantage is that it also masks heterogeneity in treatment effect across firms. As a consequence, we also conduct a firm by firm-level analysis.
A third issue with the method is whether the estimated effects are causal. Abadie et al. (2010) show that this is the case if the outcome indicators of the treated unit and the synthetic control follow a slightly weaker version of the parallel trend assumption in standard difference-in-difference estimates (i.e. if the synthetic control would have developed similarly as the treated firm in the absence of treatment). Although this hypothesis is cannot be formally tested, it is usually suggested that it is more credible if the synthetic control and the treated unit behave similarly before treatment (see e.g. Fremeth et al., 2016, and Lechner 2010). Thus in the subsequent analysis we will take care to compare the pre-treatment development of the treated firm and its synthetic control.
Data
We use data on Italy, as this country provides the largest number of SA8000 certified firms in the EU (see Sartor, 2016) and merge data from two sources. The first is a list of manufacturing firms that received CSR certification in the years from 2009 to 2010. This was acquired from the SA8000 accreditation homepage (see http://www.saasaccreditation.org/sites/ default/files/u5/SA8000_Q4.2016_Public_list.pdf) and provides the name of all establishments that received SA8000 certification and the year in which this certification was first granted. It also provides information on the address of the establishment and its industry affiliation.
The second is the Amadeus database of Bureau van Dijk. This was used to extract bookkeeping data on firm profitability, sales and total wage costs as well as total assets for all Italian single establishment manufacturing firms for the years 2007 to 2012.[5] Using an exact matching algorithm on names and address to merge these data sets we were able to identify 10 single establishment firms that received an SA8000 certification in the years 2009 or 2010, retained the standard until 2012[6] and have a full panel of observations from 2007 to 2012 for all indicators. These firms were defined as the treated firms, while single establishment firms that never received SA8000 certification and had a full panel of observations since 2007 to 2012 were used as the donor pool.
This data was also used to calculate values of firm-level return on assets (ROA), turnover to assets ratios and total wage costs relative to total assets[7] which are the variables in the current analysis. Returns on assets are used as a measure for the firm’s overall financial performance, while turnover to assets ratio and wage costs relative to assets account for the importance of the sales and labor channel, respectively.
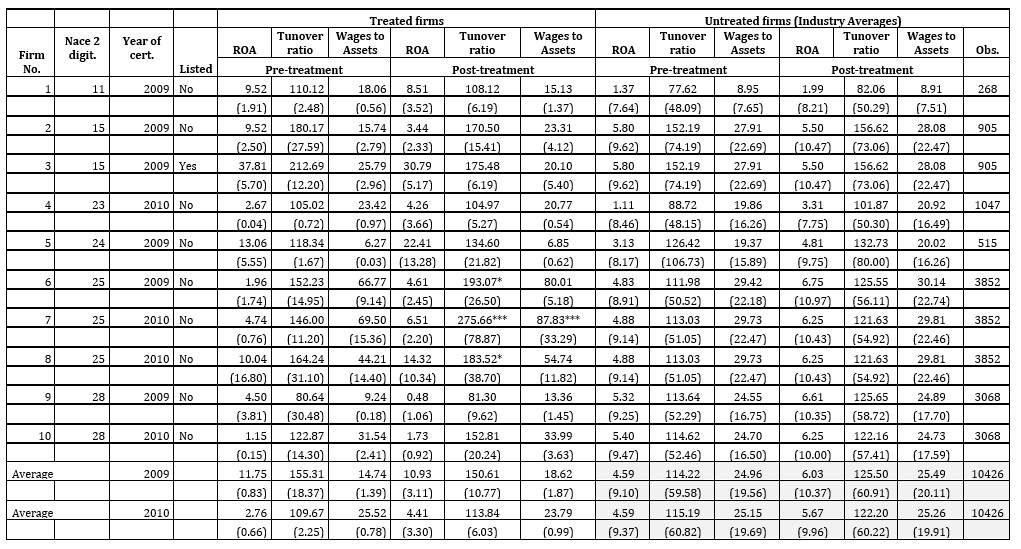
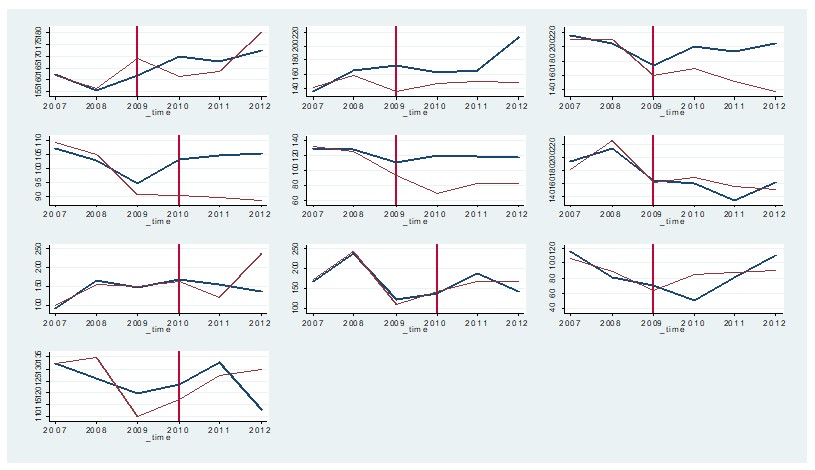
The left-hand side panel of Table 1 provides descriptive statistics for these indicators for the 10 firms adopting SA8000 for the first time in the years 2009 or 2010 by reporting the average ROA, turnover to assets ratio and wage costs as a percentage of assets in the period before and after SA8000 adoption. Of the 10 establishments, two operate in manufacturing of leather and related products (i.e. NACE 2 digit industry 15)[8], other non-metallic mineral products (NACE 2 digit industry 28) and in manufacturing of fabricated metal products (excluding machinery and equipment – 25) and one each in the manufacture of beverages (11), chemicals and chemical products (20), basic metals (24) and other non-metallic mineral products (23). Six received SA8000 certification in 2009 and four in 2010. Only one firm is a public limited liability company all others are private limited liability companies.
The left-hand side panel of Table 1 presents descriptive statistics for the indicators in the pre- and post-treatment period for firms that are potential members of the donor group by NACE-2digit industry groups. In general, the industry level trends between the pre- and post-treatment period of these indicators accord with the firm-level trends over that time period. In the majority of cases analyzed ROA, turnover to assets ratio’s as well as wage costs relative to assets were lower in the post-treatment period than in the pre-treatment period both among the firms applying SA8000 as well as in the average firm of the respective industry group these firms belonged to. Standard difference-in-difference tests for differences among the treated firms relative to the developments in the respective industry group, however, are mostly statistically insignificant[9] and a comparison of the pre-treatment mean of the indicators suggests substantial differences between the firms applying the SA8000 standard relative to their respective industry averages. In particular 9 of the 10 SA8000
Table 1: Descriptive statistics for SA8000 firms and industry averages
S: Amadeus, own calculations. Notes. Firm level statistics are means and standard deviations (in parentheses) over the respective time period. Industry level means and standard deviations (in parentheses) refer to means across firms with a full set of observation for the respective time period, Obs.=number of firms, ROA= Return on assets. *** (**) (*) signify significance of the coefficient a difference-in-difference test at the 1% (5%) (10%) level applicant firms have higher turnover ratios than their respective averages, while 6 respectively 5 have higher ROA and wages to assets ratios. This suggests that a comparison with industry averages may be invalid as SA8000 applying firms and their respective industry averages already differed prior to SA8000 adoption and thus provides justification for the synthetic control group approach.
Results
Results for aggregates
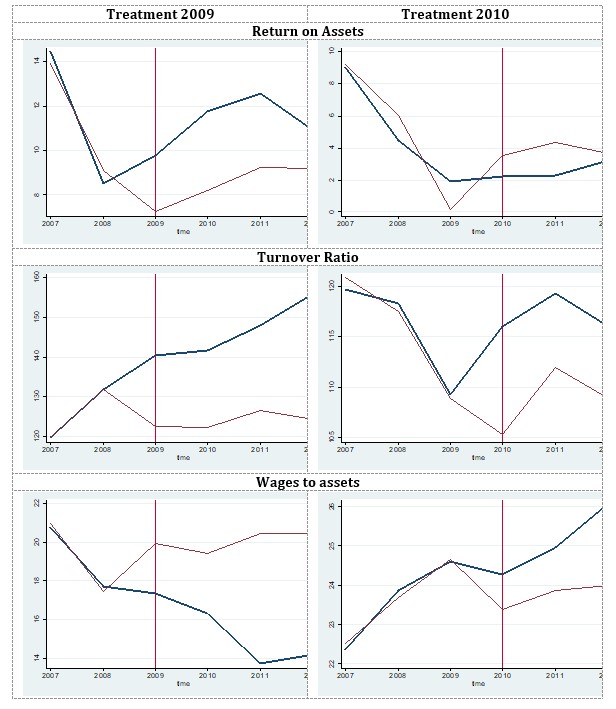
Figure 1 presents the key results of the synthetic control group analysis for the pre- and post-treatment period. It compares the evolution of the respective outcome indicators (ROA, turnover to assets ratio and the wage costs as a share of assets) of the average firm applying the SA8000 standard in 2009 (in the left-hand panel) and 2010 (in the right-hand panel) to the respective synthetic control in the period from 2007 to 2012. In this figure, bold lines represent averages of the treated firms, while thin lines show the developments of the synthetic control. Furthermore, the top panel of this figure presents results with respect to ROA, the middle panel for the turnover to assets ratios and the lowest panel for wage costs. The horizontal lines mark the year of SA8000 certification. In all of these diagrams, the lines for the treated firms and their respective synthetic control are very close to each other in the period before SA8000 adoption for all outcome variables. This provides (ex-post) validation of the method used, as it indicates that the treated and the synthetic control group follow very similar trends before treatment.
In the post-treatment period, however, the developments of the treated firms and the synthetic control start to diverge. The evidence on ROA suggests a positive impact of SA8000 adoption on firm profitability for firms that adopted this standard in 2009, as their average ROA is by around six percentage points higher at the end of the observation period than among the synthetic control group. For firms that adopted the SA8000 standard in 2010, by contrast, results indicate a decline in profitability after the introduction of the standard relative to the synthetic control, as the ROA of firms adopting SA8000 certification in 2010 is by around three percentage points lower throughout the post- treatment observation period than that of their synthetic control group.
Evidence with respect to the turnover to assets ratio (in the middle panel of Figure 1) is more compelling. Both firms adopting SA8000 in 2009 and 2010 experienced a noticeable increase in their turnover to assets ratio relative to their synthetic control after SA8000 adoption. This difference amounts to over 20 percentage points (i.e. around one third of a standard deviation of this indicator among non-adopting firms) throughout the post-treatment period for firms adopting SA8000 in 2009 and to five to ten percentage points for firms adopting SA8000 in 2010. Finally, the results with respect to the total wage costs of the firm suggest a sizable negative impact of SA8000 adoption on total wage costs for firms adopting the SA8000 standard in 2009 but a sizeable positive one for firms adopting SA8000 in 2010.
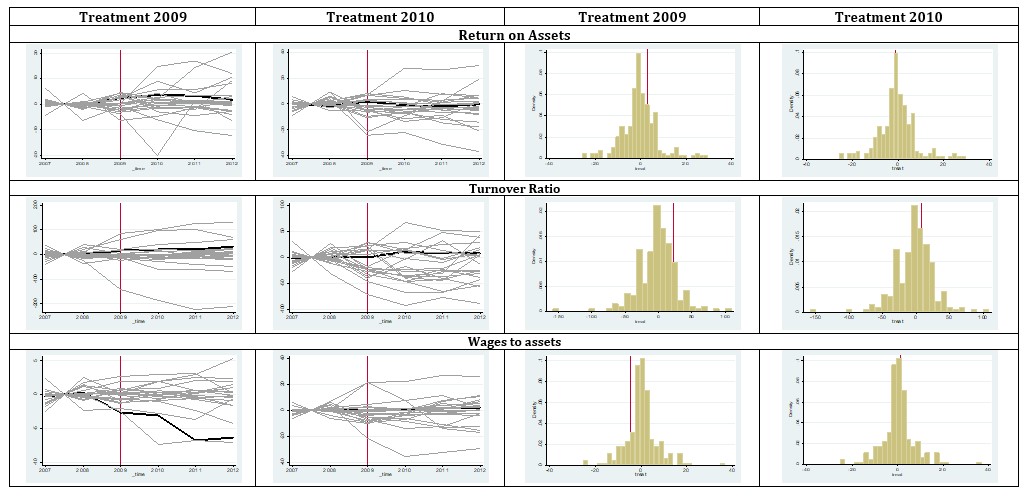
These results must, however, be interpreted in the context of the variability of the variable of interest among untreated firms. To allow for such an interpretation Figure 2 (in its top panel) shows the estimated gaps for the first 50 of a total of 250 placebo treatments estimated for firms not adopting SA8000 and compares them to the estimated gap for the average firms treated in 2009 and 2010. Again in this figure in the pre-treatment period, most series are located very close to zero. This indicates a good fit for the placebo treatments. Furthermore, in the post-treatment period the placebo effects – although varying more than in the pre-treatment period – are well centered on zero. This provides further ex-post validation to the method used, as in average no effects are found in the post-treatment period for firms where no treatment occurred.
The bars of the bottom panel of Figure 2 shows the empirical distribution of the placebo treatment effects for all 250 placebo treatments. These are defined as the differences-in-differences between the treated firms and the control group over the pre- and post-treatment period in the outcome variable generated. The horizontal line in these figures shows the estimated effect for the average of the firms adopting SA8000 in 2009 and 2010, respectively. A vertical line that is far to the right of the placebo distribution suggests that the estimated effect for the respective group of firms is positive and large relative to the placebo treatments, while a vertical line to the left of this distribution indicates a large negative effect of SA8000 adoption.
Fig. 1: Results of synthetic control group analysis (aggregated firm data)
Notes: Bold lines represent development of the indicators for the average firm adopting SA8000 in 2009 (left hand side) and 2010 (right hand side). Thin lines represent the development of the respective synthetic control group. The horizontal line indicates the year of adoption of the SA8000 standard.
Fig. 2: Results of placebo treatments for synthetic control group analysis (aggregated firm data):
Notes: Left hand side: bold lines are differences in the development of the indicators for the average firm adopting SA8000 in 2009 (left hand side) and 2010 (right hind side) and synthetic control group. Thin lines represent differences in development of the first 50 placebo treatments. Right hand side: Bars show the simulated distribution of placebo ATTs, line represents ATT of the treated unit.
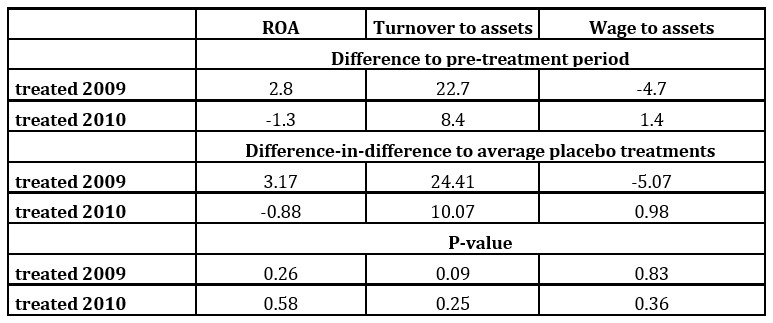
Finally, Table 2 summarizes the results reported in Figure 2 by comparing the estimated pre- to
Post-treatment differences in pre-tax profits, sales and wage costs (reported in the top panel of this table) to the average pre- to post-treatment differences in the placebo treatments (middle panel) in a difference-in-difference estimate of treatment effects (bottom panel). This bottom panel can thus be interpreted as a test of the null hypothesis that SA8000 had no effect on firm-level returns on assets, turnover to sales ratios and wage costs relative to assets. A number smaller than 0.1 in this table suggests a statistically significant positive impact of SA8000 certification on the respective indicator at the 10% significance level, while a value larger than 0.9 indicates a statistically significant negative impact of SA8000 certification on the respective indicator at the 10% level.
Table 2: Estimated Average Treatment Effect on Treated (ATT) at Aggregate Level
Notes: Top panel reports pre- to post-treatment differences in outcomes. Middle panel reports the difference-in-difference estimate of the treatment effect. Bottom panel reports the share of the placebo distribution to the right or the left of the estimated treatment effect.
Taken together the evidence presented in Figure 2 and Table 2 indicates that in the average firm adopting the SA8000 standard in 2009 ROA increased by 2.8 percentage points, while the turnover to assets ratio increased by 21.7 percentage points and total wage costs as a share of assets reduced by 4.7 percentage points. By contrast, in the average firm adopting the SA8000 standard in 2010 returns on assets reduced by 1.3 percentage points while the turnover to assets ratio and wage costs as a share of assets increased by 8.4 and 1.4 percentage points. Comparing these figures to the effects found for placebo treatments suggests an average treatment effect on the treated (ATT) for firms adopting in SA8000 in 2009 of 3.2 percentage points for ROA, 24.4 percentage points for the turnover to assets ratio and 5.1 percentage point for wage costs as a percentage of assets, with all these effects except for the one on turnover to assets ratios statistically insignificant at conventional significance levels. For the firms adopting SA8000 in 2010, by contrast, the estimated ATT is -0.9 percentage points for ROA, 10.1 percentage points for the turnover to assets ratio and 1.0 percentage points for wage costs as a percentage of assets, with all effects statistically insignificant at conventional levels of significance.
Heterogeneity in treatment effects and results for individual firms
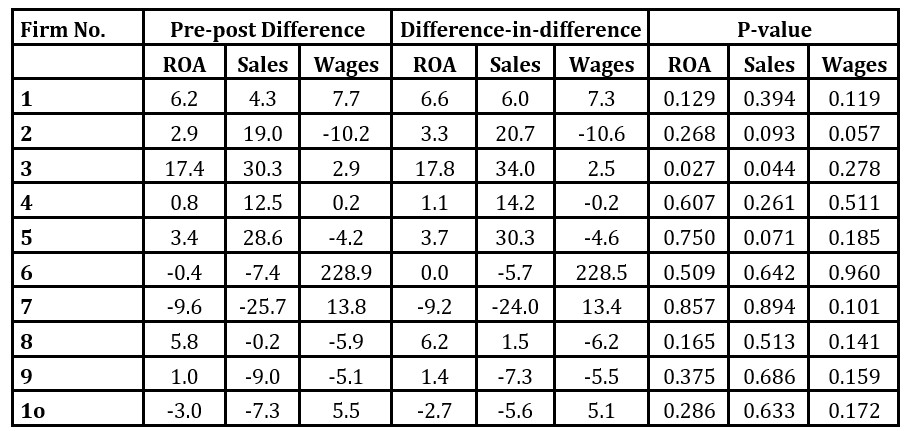
The results of a similar analysis as above for each firm in the sample[10] are reported in Figures A1 to A3 in the Appendix, These present similar graphs as Figures 1 and 2. Table 3 summarizes these results by repeating the information displayed in Table 2 on a firm by firm level. These results are almost always statistically insignificant at conventional significance levels for the development of ROA and wages as a share of assets, and often also disagree in a sign for these outcome indicators. Thus ROA increased statistically significantly (by 17.8 percentage points) only in firm number 3, while wages as a share of assets decreased statistically significantly in firm number 2 but increased statistically significantly in firm number 7. This also suggests an insignificant or at least highly heterogeneous impact of SA8000 on wage costs.
The only outcome indicator where results are statistically significantly more often is the turnover to assets ratio. This increased statistically significantly in 3 of the 10 firms considered. In addition for these firms, this increase is also of economic significance as it amounts to 19.0 to 30.3 percentage points (i.e. around one third of a standard deviation of this measure in the industries to which the firms were affiliated).
Table 3: Estimated Treatment Effect on Treated (ATT) at Firm Level
Notes: The right-hand panel of the table reports pre- to post-treatment differences in outcomes, the second panel reports the difference-in-difference estimate of the treatment effect. The right-hand side panel reports the share of the placebo distribution to the right of the estimated treatment effect. ROA= Return on assets.
Furthermore, correlating the average treatment effects on a firm-level with indicators of a firm size such as the number of employees and total assets before SA8000 adoption, suggests that larger firms are more likely to profit from SA8000 adoption than small ones in terms of turnover ratios. The correlation coefficient of the treatment effect for the turnover ratio with the number of employees at a treated firm is 0.46 and with total assets 0.60. By contrast for ROA and wages as a share of total assetshe correlation of the firm-level treatment effects with firm size is much smaller. They amount to 0.13 respectively -0.14 with the number of employees, and to 0.09 respectively 0.29 with total assets.
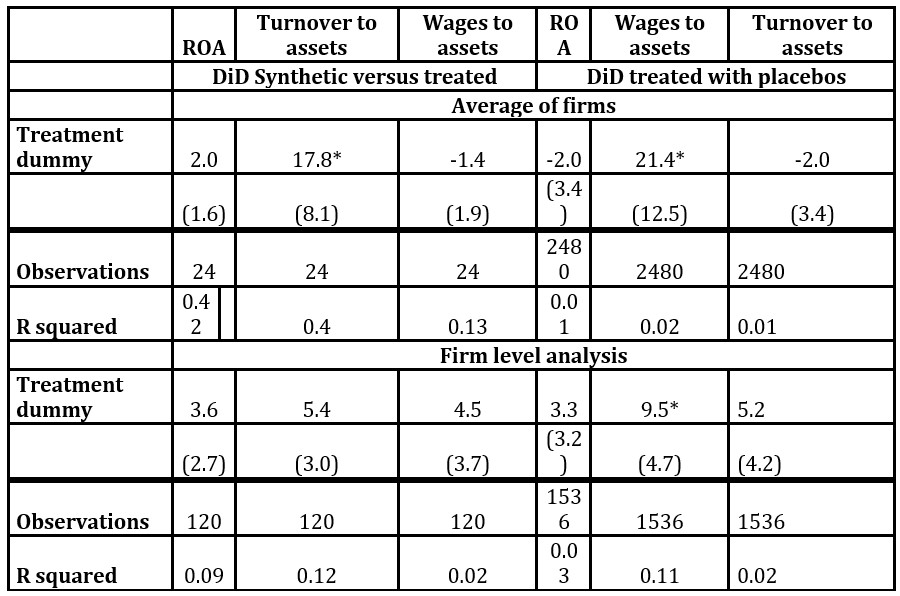
Regression Results
Finally, we follow Peri and Yasenov (2010), who use a difference-in-difference analyses to assess the significance of the estimated effects from the synthetic control group method. This approach consists of a regression analysis in which the pre- to post-treatment difference in the outcome variable under consideration between treated firms and their synthetic control group as well as the same difference for the 250 placebo treatments are entered as observations. Thus dividing the output from the synthetic control group method into a subset of observations (R) that refer to the differences of the treated firms to their synthetic control group and another subset of observations that refer to the same differences for the placebo treatments, the impact of SA8000 adoption can be assessed by the significance of the parameter in a regression of the form:
where is a disturbance term and is the respective outcome variable of the firm adopting the SA8000 standard or of its respective synthetic control group and is a dummy variable for each firm and for each year, while and are indicators for the post-treatment period and the set of SA8000 adopting firms.
Notes: Table report result of the estimated treatment effect in a regression as in equation (2). Values in parentheses are standard errors of the estimate, ***, (**), (*) signify significance of the coefficient at the 1%, (5%), (10%) level. ROA= Return on assets. Treatment dummy is interaction of post treatment period with indicator for treated firms (i.e. in Equation 2)
The results of this analysis are reported in Table 4. In this table, the right-hand side presents results for the regression in which differences between the treated firm and the synthetic control as well as placebos are analyzed while the left-hand side focuses on the comparison of treated firms to their respective synthetic control. In addition, the top panel reports the regression results for the analysis on the level of averages across firms, while the bottom panel presents the same analysis for the analysis at the firm-level. Once more these results do not suggest a significant impact of SA8000 certification on either firm level profitability or wages, as the coefficient on the interaction term on the treated firms and the post treatment period are insignificant in all specifications. Also, the sign of these coefficients differs between specifications. By contrast, SA8000 certification has a weakly significantly positive impact on sales as a share of assets in three of the four specifications and the coefficient on the treated firms and post-treatment period interaction is positive in the fourth of these specifications.
Conclusion
In sum, using a synthetic control group analysis to identify the effects of SA8000 certification as one of the internationally most often applied standards for social accountability, we find little evidence of either a positive or negative impact of SA8000 certification on firm profitability and wages. Our results, however, indicate a potential impact of such certifications on sales. This suggests that SA8000 may be a viable marketing tool that increases company sales.
Given that most of our firms do not operate in consumer industries we would argue that firms may use such certification to strengthen their position in worldwide delivery networks. Our results, however, also indicate substantial heterogeneity in the impact of SA8000 certification on different firms. Exploring these sources of heterogeneity, using larger data sets than those available to us, may therefore be an interesting task for future research.
Literature
Abadie, A., and Gardeazabal, J. (2003), `The economic costs of conflict: a case study of the Basque Country´. American Economic Review, 93(1), 113-132.
Abadie, A., Diamond, A., and Hainmueller, J. (2010), `Synthetic control methods for comparative case studies: Estimating the effect of California’s tobacco control program,´ Journal of the American statistical Association, 105(490), 493-505.
Becchetti, L. and Ciciretti, R. (2009), `Corporate social responsibility and stock market performance,´ Applied Financial Economics, 19(16), 1283-1293.
Becchetti, L., Ciciretti, R. and Giovannelli A. (2013), `Corporate social responsibility and earnings forecasting unbiasedness,´ Journal of Banking and Finance, 37(9), 3654-3668.
Belu, C. and C. Manescu C. (2013), `Strategic corporate social responsibility and economic performance,’ Applied Economics, 45(19), 2751-2764.
Bénabou, R and Tirole, J. (2010), `Individual and corporate social responsibility,´ Economica,77(305), 1-19.
Billmeier, A., and Nannicini, T. (2013), `Assessing economic liberalization episodes: A synthetic control approach,´ Review of Economics and Statistics, 95(3), 983-1001.
Bouslah, K., M’Zali, B., Turcotte, M. F., and Kooli, M. (2010), `The impact of forest certification on firm financial performance in Canada and the US,´ Journal of Business Ethics, 96(4), 551-572.
Cavaco, S., and Crifo, P. (2014), `CSR and financial performance: complementarity between environmental, social and business behaviours,´ Applied Economics, 46(27), 3323-3338.
de Vries, H. J., D. K. Bayramoglu and van der Wiele, T. (2012), `Business and environmental impact of ISO 14001,´ International Journal of Quality and Reliability Management, 29(4), 425-435.
Dasgupta, S., Laplante, B. and Mamingi, N. (2001), `Pollution and capital markets in developing countries,´ Journal of Environmental Economics and Management, 42(3), 310-335.
El Ghoul, S., Guedhami, O., Kwok, C.C.Y. and Mishra, D.R. (2011), `Does Corporate Social Responsibility Affect the Cost of Capital?,´ Journal of Banking and Finance, 35(9), 2388-2406.
Etile, F. and Teyssier S. (2016), `Signaling Corporate Social Responsibility: Third-Party Certification vs. Brands,´ Scandinavian Journal of Economics, 118(3), 397-432
Flammer, C. and Kacperczyk, A. (2016), `The impact of stakeholder orientation on innovation: Evidence from a natural experiment,´ Management Science, 62(7), 1982-2001
Flammer, C. and Luo, J. (2017), `Corporate Social Responsibility as an Employee Governance Tool: Evidence from a Quasi-Experiment,´ Strategic Management Journal, 38(2):163-183..
Flammer, C. (2015) `Does Corporate Social Responsibility Lead to Superior Financial Performance? A Regression Discontinuity Approach,´ Management Science,61(11), 2549–2568.
Fremeth, A. R., Holburn, G. L. F. and Richter, B. K. (2016), `Bridging Qualitative and Quantitative Methods in Organizational Research: Applications of Synthetic Control Methodology in the US Automobile Industry,´ Organization Science, 27(2), 462-482.
Gilbert, D.U. (2001), `Social accountability 8000: ein praktikables Instrument zur Implementierung von Unternehmensethik in international tätigen Unternehmen?,´ Zeitschrift für Wirtschafts-und Unternehmensethik, 2(2), 123-154.
Heras-Saizarbitoria, I., Molina-Azorín, J. F. and Dick, G. (2011), `ISO 14001 certification and financial performance: selection-effect versus treatment-effect,´ Journal of Cleaner Production, 19(1), 1-12.
Hiscox, M.J., Schwartz, C. and Toffel, M. (2009), Evaluating the Impact of SA8000 Certification, SA8000 The First Decade: Implementation, Influence, and Impact., Leipziger D (ed), Greenleaf,:London, 1-11.
Jacobs, B. W., Singhal, V. R. and Subramanian, R. (2010), `An empirical investigation of environmental performance and the market value of the firm,´ Journal of Operations Management, 28(5), 430-441.
Kang, C., F. Germann, and Grewal, R. (2016), `Washing away your sins? Corporate social responsibility, corporate social irresponsibility, and firm performance,’ Journal of Marketing, 80(2), 59-79.
Kitzmueller, M. and Shimshack, J. (2012), `Economic perspectives on corporate social responsibility,´ Journal of Economic Literature, 50(1), 51-84.
Klassen, R. D., and McLaughlin, C. P. (1996), `The impact of environmental management on firm performance,´ Management Science, 42(8), 1199-1214.
Korschun, D., Bhattacharya, C.B. and Swain, S.D. (2014), `Corporate Social Responsibility, Customer Orientation, and the Job Performance of Frontline Employees,´ Journal of Marketing, 78(3), 20-37
Koske, I., Wanner, I., Bitetti, R. and Barbiero, O. (2015), `The 2013 update of the OECD product market regulation indicators: policy insights for OECD and non-OECD countries,´ OECD Economics Department Working Papers, No. 1200.
Koe Hwee Nga, J., (2009) `The influence of ISO 14000 on firm performance,´ Social Responsibility Journal, 5(3), 408-422.
Kreif, N., Hangartner, G. R, Turner, D, Nikolova, A.J. and Sutton, M. (2016), `Examination of the Synthetic Control Method for Evaluating Health Policies with Multiple Treated Units,´ Health Economics, 25(12), 1514-1528.
Lechner, M. (2010) `The Estimation of Causal Effects by Difference-in-Difference Methods, University of St. Gallen Department of Economics working paper series 2010 2010-28, Department of Economics, University of St. Gallen, revised Oct 2011.
Liang, H. and Renneboog, L. (2017), `On the foundations of corporate social responsibility,´ The Journal of Finance, 72(2), 853-909.
Lin, C.H., Ho-Li, Y. and Dian-Yan, L. (2009), `The impact of corporate social responsibility on financial performance: Evidence from business in Taiwan,´ Technology in Society, 31(1), 56-63.
Margolis, J.D. and Walsh, J.P. (2003), `Misery Loves Companies: Rethinking Social Initiatives by Business,´ Administrative Science Quarterly, 48(2), 268-305.
Margolis, J.D., Elfenbein, H.A. and Walsh, J.P. (2009), `Does it Pay to Be Good…And Does it Matter? A Meta-Analysis of the Relationship between Corporate Social and Financial Performance http://dx.doi.org/10.2139/ssrn.1866371
Melo, T. (2012), `Slack-resources hypothesis: a critical analysis under a multidimensional approach to corporate social performance,´ Social Responsibility Journal, 8(2), 257-269.
Orlitzky, M., Schmidt, F. L., and Rynes, S. L. (2003), `Corporate social and financial performance: A meta-analysis,´ Organization Studies, 24(3), 403-441.
Peri, Giovanni, and Vasil Yasenov (2015), `The labor market effects of a refugee wave: Applying the synthetic control method to the Mariel boatlift,´ NBER Working Paper No. w21801. National Bureau of Economic Research.
Reinhardt, F.L., Stavins, R.N. and Victor, R.H.K (2008), `Corporate Social Responsibility Through an Economic Lens,´ NBER Working Paper 13989, NBER.
Sartor, M., Orzes, G., Di Mauro, C., Ebrahimpour, M., and Nassimbeni, G. (2016), `The SA8000 social certification standard: Literature review and theory-based research agenda,´ International Journal of Production Economics,175, 164-181.
Social Accountability International, (2015), SA8000:2014 Standard Documents, http://www.sa-intl.org/index.cfm?fuseaction=Page.ViewPage&PageID=937.
Tamm, K., Eamets, R. and Mõtsmees, P. (2010), `Are Employees Better Off in Socially Responsible Firms?,´ IZA Discussion Paper No. 5407, IZA:Bonn.
Tsoutsoura, M, (2004) `Corporate social responsibility and financial performance,’ Working Paper. Center for Responsible Business, Berkeley
Wu, M.W. and C.H. Shen, (2013), `Corporate social responsibility in the banking industry: Motives and financial performance,´ Journal of Banking and Finance,37(9), 3529-3547
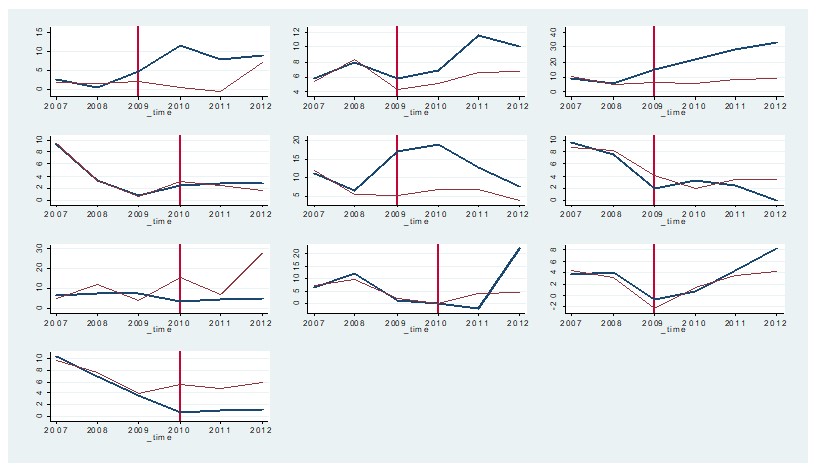
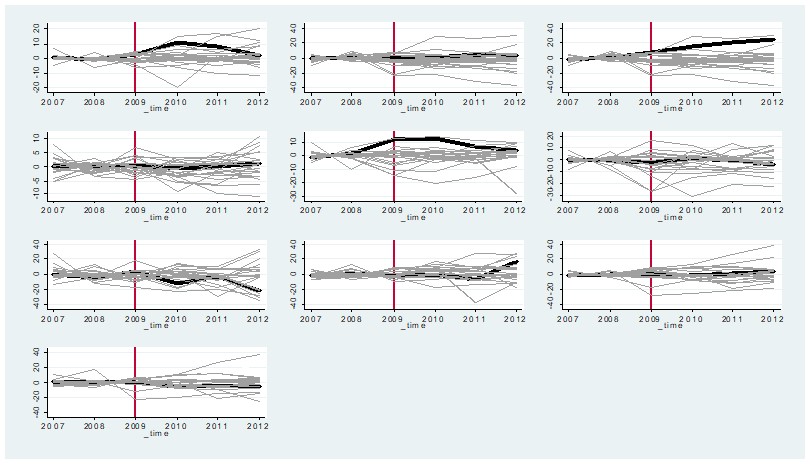
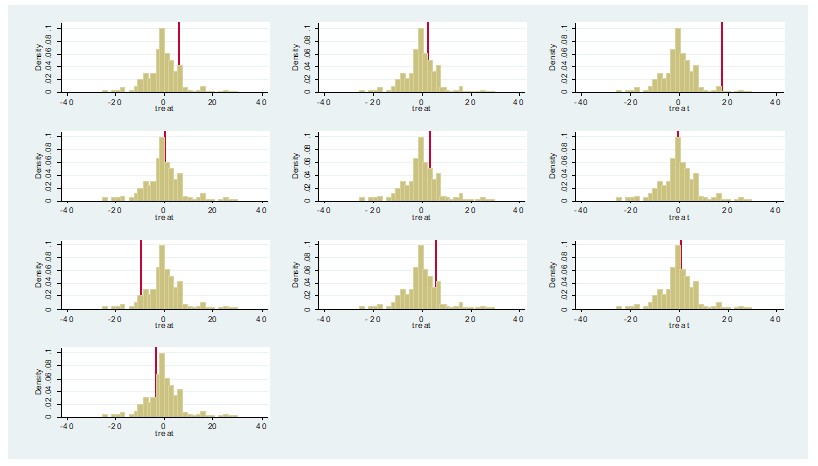
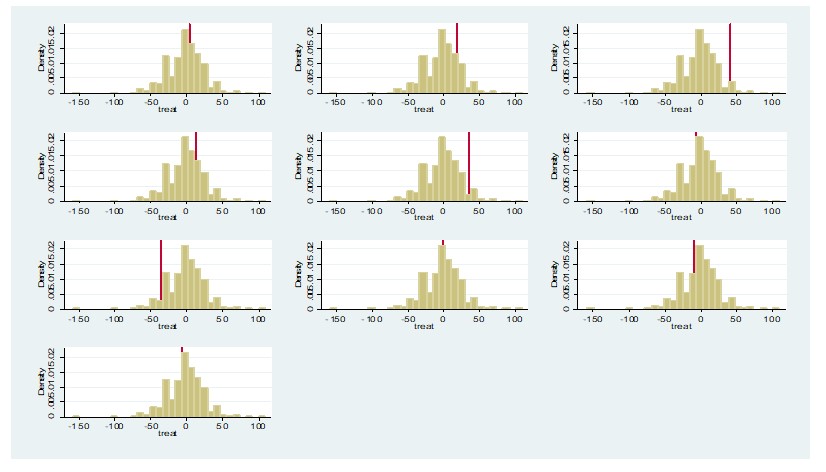
Fig. A1: Results of synthetic control group analysis for return on assets (individual firm level data)
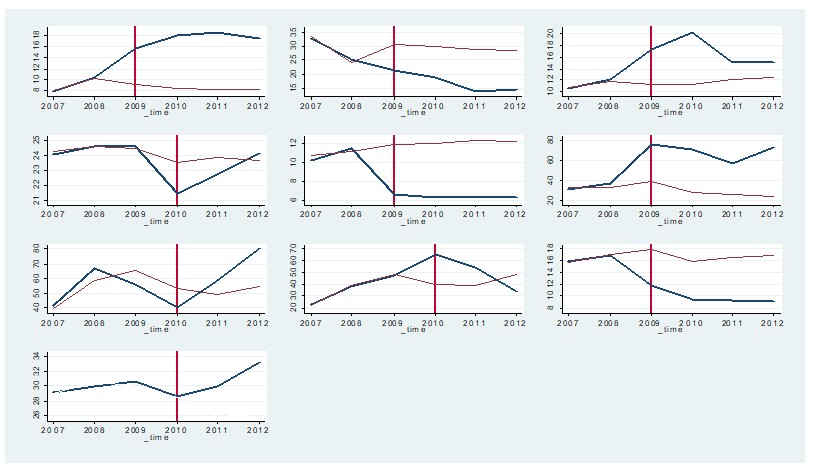
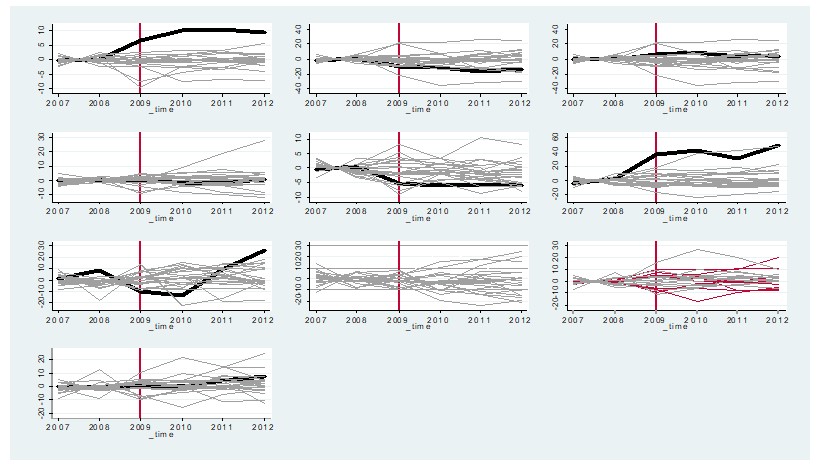
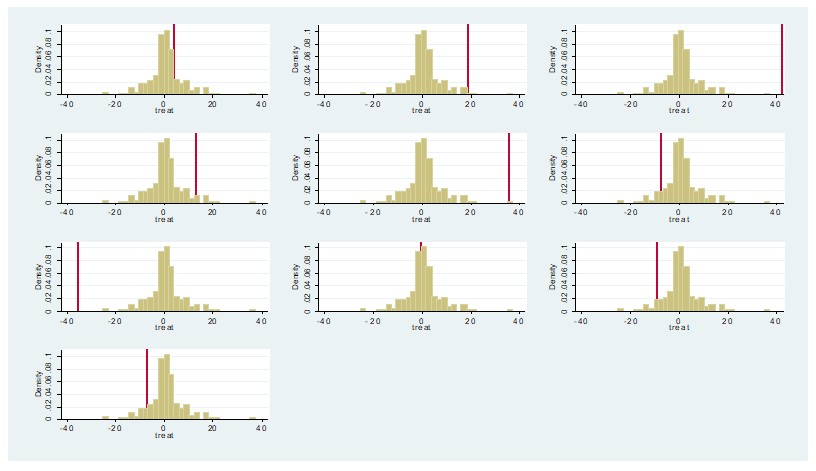
Notes: Top left panel: presents the results of a synthetic control group analysis for. The bold line shows the development of sales in the treated firm, the thin line the predicted sales for the synthetic control group before and after adoption of the SA8000 standard. The horizontal line indicates the year of adoption of the SA8000 standard. Top right panel: Bold lines represent differences in development for the average firm adopting SA8000 and synthetic control groups. Thin lines represent the differences in development of the first 50 placebo treatments. Bottom panel: bars show the simulated distribution of 250 placebo ATTs, line represents ATT of the treated unit.
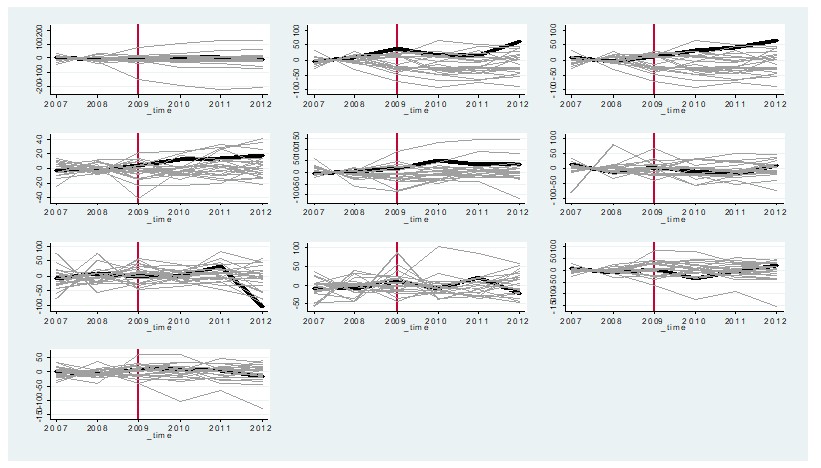
Fig. A2: Results of synthetic control group analysis for turnover to assets ratio (individual firm level data)
See Figure A1 for notes
Fig. A3: Results of synthetic control group analysis for wage cost as a percentage of assets (individual firm level data)
See Figure A1 for notes
[1] See Flammer (2015), Flammer and Luo (2017), Flammer and Kacperczyk (2016) and Liang and Renneboog (2017) for recent contributions identifying the causal impact of other CSR policies on company performance.
[2] This may be either due to an ideological conviction of these actors or because CSR offers them the possibility to increase their social prestige (Benabou and Tirole, 2010).
[3] The CSR literature has developed several further hypotheses to explain why firms may engage in CSR. Kang et al. (2016) argue that firms may engage in CSR to offset negative image effects resulting from past (publicly known) irresponsibility or to create goodwill to attenuate negative reactions when things happen.
[4] In 2016 3888 facilities in 68 countries and 55 industries were certified through SA8000 (http://www.saasaccreditation.org/certfacilitieslist)
[5] As SA8000 certification is awarded to establishments we focused on single establishment firms by checking that the considered firms have no subsidiaries in the Amadeus data.
[6] Firms which adopted SA8000 before 2009 were omitted to avoid confounding the synthetic control group with previously treated firms.
[7] To ensure measurement on a comparable scale all variables are measured relative to total assets ROA was thus calculated as the ratio of before tax profits to total assets, turnover to assets ratios as the ratio of sales to assets and wage costs as the firm’s wage bill relative to assets.
[8] NACE (“nomenclature statistique des activités économiques dans la Communauté européenne”) is the implementation of the UN industry classification ISIC used in the European Union.
[9] The only exceptions are three firms (number 7, 8 and 9) when focusing on the developments of the turnover to assets ratio, and two firms (number 7 and 8) in the case of wage costs as a percentage of assets.
[10] This analysis is based on the same procedure as for firm averages. The only difference is that we limit the donor pool for the analysis to firms of the same industry.