2CICF(IPCA), Polytechnic Institute of Bragança (IPB), Bragança, Portugal
Volume 2021,
Article ID 935298,
Journal of EU Research in Business,
7 pages,
DOI: 10.5171/2021.935298
Received date: 12 September 2019; Accepted date: 2 September 2020; Published date: 20 January 2021
Academic Editor: Maria José Palma Lampreia Dos-Santos
Cite this Article as:
Carlota QUINTAL and José LOPES (2021)," Catastrophic Expenditure on Medicines: An Analysis Based on The Portuguese Household Budget Survey 2015/2016” Journal of EU Research in Business, Vol. 2021 (2021), Article ID 935298, DOI: 10.5171/2021.935298
Financial protection is a core dimension of health system evaluation; therefore, several works on catastrophic health expenditure (CHE) have been developed. There are, however, some gaps in the literature; hence, this work aims to look at CHE from a different angle, analysing the money spent by households. The objectives are to identify how many and which health services are driving CHE and analyse the profile of households with CHE. The data of this work come from the Portuguese Household Budget Survey 2015/2016 and the study includes 11,398 observations. The WHO methodology for CHE identification was adopted. Over one fifth of the households incurring CHE spent money only on medicines, and this presented, by far, the highest expenditures. All families with CHE spent money on medicines, and about two thirds spent on up to three items. Expenditures on medical devices and hospital services were low. Dental care expenditures tended to assume extreme values. Although primary care services are spread across the country, expenditures on GP services were not at all negligible. The typical household with CHE consists of an old poor person living alone. Exempting these people from medicine co-payments is crucial to prevent catastrophic expenditure.
Keywords: Catastrophic health expenditure, financial protection, Portugal.
Introduction
Financial protection was recognised by the World Health Organisation (WHO) as a core dimension for the evaluation of the health system performance almost two decades ago (World Health Organisation, 2000). Later, WHO reinforced the relevance of ensuring that everyone is able to access health services and not to be subject to any financial hardship in doing so (World Health Organisation, 2010a). In this line, the framework used by WHO to continuously monitor progresses towards a universal health coverage builds on two main indicators, one of which is the financial protection dimension. The financial protection dimension, in turn, has been evaluated through the analysis of catastrophic health expenditure (CHE) and the impoverishing spending on health. The focus of this paper is on CHE, which is out-of-pocket expenditure (OOP) exceeding a given threshold of a household’s resources (Wagstaff, 2002; World Health Organisation and The World Bank, 2017).
Despite the relevance of this topic, a recently published systematic review of literature (Yerramilli et al., 2018) identified several gaps, concluding that there is a scarcity of up-to-date analysis and no studies drawing on data beyond 2011. These authors also point out that identifying the groups who experience financial hardships, while breaking down catastrophic out-of-pocket payments by health service is a useful starting point for exploring the health system factors that lead to financial hardships. The need to address gaps in the geographical coverage is also mentioned. The literature further shows a bias towards middle-income countries but, although it is acceptable to prioritise monitoring in countries with weak financial protection, attention should also be focused on high income countries. This is so because in some cases, the financing of health systems relies, to a considerable extent, on direct payments, putting at risk some vulnerable groups of the population, and even countries with strong financial protection should be studied in order to identify good practice and highlight transferable lessons for policy (Yerramilli et al., 2018).
One of the limitations of the CHE approach is that some people might not be exposed to catastrophic expenditure simply because they are not getting the care they need either because they cannot access it or because they cannot afford it (Yerramilli et al., 2018). Hence, there is a recommendation by the World Health Organisation and The World Bank (2017) that financial protection always needs to be jointly monitored with service coverage.
Portugal is an interesting case in the context of this work because it is considered a high income country but the share of OOP in the total health expenditure is among the highest in OECD and EU countries. In 2016, OOP represented 28% of the total health expenditure in Portugal, which compares to 18% in the EU28 (OECD/EU, 2018). Additionally, the country has a National Health Service (NHS), which is universal, comprehensive and almost free at the point of delivery (according to the Portuguese Constitution, Article 64), but there are shortcomings in the provision. The NHS predominantly provides primary care and specialized hospital care. Dental consultations, diagnostic services, renal dialysis and rehabilitation are more commonly provided in the private sector (Simões et al., 2017). Typically, the latter three services are carried out under contractual arrangements with the NHS. However, the NHS does not cover dental care (it is neither provided nor funded by the NHS). Most dental care is paid by OOP, as are many specialist consultations in private ambulatory care (Thomson et al., 2009; Simões et al., 2017). Regarding pharmaceutical expenditure, there are cost-sharing schemes, however, in 2016, 45% of the expenditure on retail pharmaceuticals was financed by OOP, compared to 34% in the EU28 (OECD/EU, 2018).
This paper’s objectives are, therefore, to contribute to the financial protection literature by focusing the analysis on the types of health care which are consuming people’s money alongside the analysis of the types of health care on which people are not spending money. Although these aspects have been absent from previous works, they provide relevant information, namely how many and which items are driving CHE. This paper also aims to contribute to the literature on financial protection by analysing recent data from a high income country and exploring, in more details, the profile of households incurring CHE. At the same time, it provides evidence that might be used to monitor the financial protection of Portuguese families.
Methods
Data were taken from the 2015/2016 wave of the Portuguese Household Budget Survey. This survey contains data from a representative stratified clustered sample of households living in non-collective dwellings across the country. It was carried out by Statistics Portugal. Data were collected in the mainland and islands (Azores and Madeira) between 16 March 2015 and 13 March 2016 (INE, 2017). This study includes 11,398 observations.
The variables directly extracted from the database were: total expenditure, food expenditure, out-of-pocket health care payments (total, and for different types of health care considered separately: medicines; other pharmaceutical products, including contraception; glasses and contact lenses; hearing devices; other medical devices; visits to general practitioners; visits to specialists; dental care; diagnostic tests; paramedic services, including ambulance services; hospital services), equivalent household size (OECD scale), type of household (one non-elder adult, one elder adult, two or more non-elder adults, two or more adults with at least one elder individual and no children, one adult with children, two or more adults with one child, two or more adults with two or more children), and region of residence (as in Figure 2 – Panel 2c).
To identify households with CHE, the methodology proposed by WHO researchers (Xu et al., 2003; Xu, 2005) and followed by several authors was adopted (e.g. Yerramilli et al., 2018). In this case, a household is said to have incurred catastrophic expenditure if its OOP are equal to, or higher than, 40% of its capacity to pay. The capacity to pay corresponds to a household’s nonsubsistence spending. Subsistence spending is the amount each household is expected to spend on food, taking into account its equivalent size and the amount spent by the household on the sample median food share of the total expenditure.
In a second step, binary variables were defined to identify null expenditures (variables assume the value 1 if expenditures are null). Then, only households with CHE were considered, identifying how many and which items they spent their money on as well as expenditure levels. The composition of this group was further analysed in terms of expenditure quintiles, household types and region of residence.
All the analyses were carried out in SPSS 25.0, and sample weights provided in the database were used.
Results
Considering the whole sample, there were 0.46% of households incurring catastrophic health expenditure. The prevalence of CHE among the poorest (first expenditure quintile) was 1.96%, while it was 0.26% in the second expenditure quintile and basically null in the remainder quintiles. In terms of null expenditures, more than 80% of the families in the whole sample did not spend money on visits to specialists, exams, dentists, glasses/lenses and hospital services. More than 90% of all the families reported no expenditure on other medical devices and paramedic services. Regarding GP visits, the percentage of families with no expenditures was about 75%. The lowest percentage was found for medicines, in which only 16% of the households in the whole sample did not spend money on this item. The percentage of families reporting null expenditures continuously decreases from the first to the fifth expenditure quintiles for all the types of health services. In the case of specialist consultations, the percentage decreases from 94% to 61%. In the case of dental care, it decreases from 93.5% to 65.5%, and for glasses/lenses, it decreases from 93% to 71.5%.
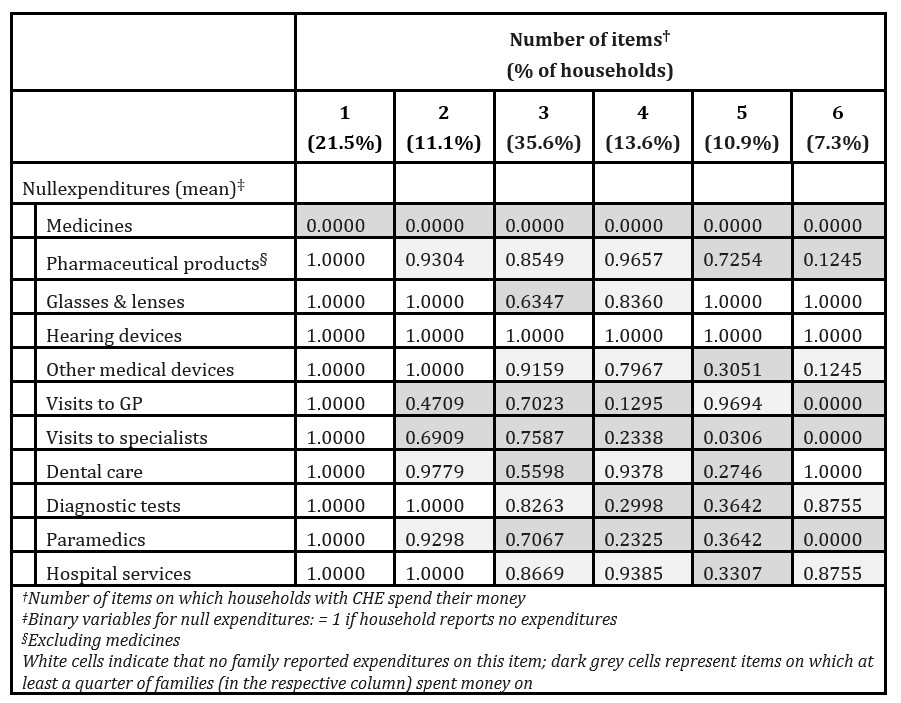
Table 1: Destination of payments of households with catastrophic health expenditure
Now, focusing on families with CHE (Table 1), and taking into account where they spent their money (for health care), it is observed that over one fifth of these households incurred catastrophic expenditure by spending money on medicines alone. The majority (68.5%) spent money on up to three items, and no family with CHE spent on more than six types of health services (from the list presented in section 2). Looking at Table 1, it is further observed that all the families with CHE spent money on medicines and none spent on hearing devices. Few families with CHE spent money on glasses/lenses as well as on hospital services and paramedics. Differently, expenditures on GP and specialists consultations were more frequently reported.
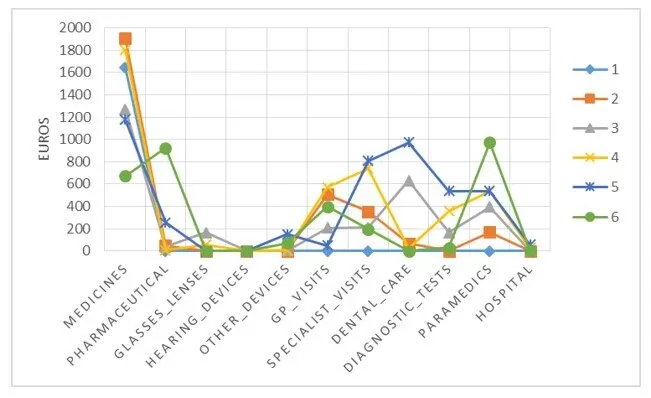
A large percentage of households reporting expenditures on a given item does not necessarily mean that it is greatly relevant in terms of the financial burden imposed on families, hence, the information presented in Figure 1 complements the previous analysis.
Fig. 1: Average annual expenditures of households with catastrophic health expenditure, according to the number of items on which they spent money
As observed in Figure 1, expenditures on medicines not only were reported by all families with CHE but also presented the highest average value (with the exception of families spending on 6 items). However, to a lesser extent, specialist and GP consultations also attracted important shares of families’ resources. In the case of dental care, expenditures tended to be more extreme (either very low or quite high).
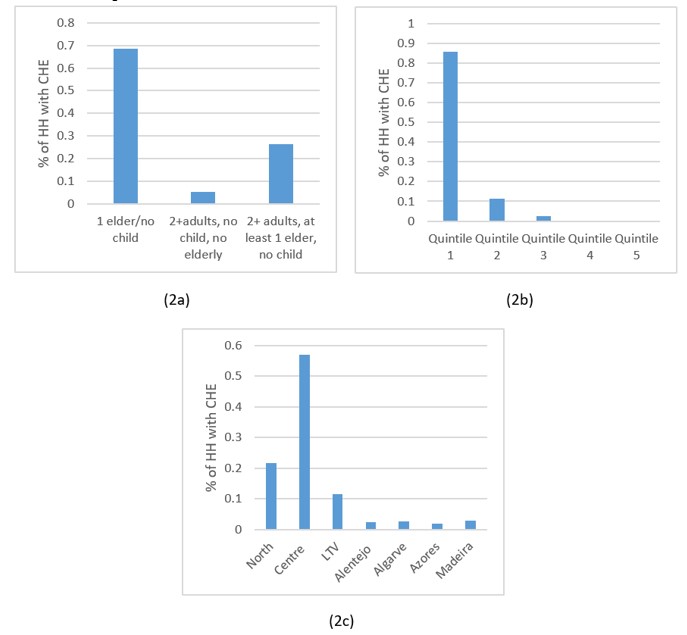
Fig. 2: Profile of households (HH) with catastrophic health expenditure (CHE) according to household composition (Panel 2a), expenditure quintile (Panel 2b) and region of residence (Panel 2c)
The profile in Figure 2 suggests that households with catastrophic expenditure were mainly poor elder people living alone in the Centre of the country. Still, about a quarter of households with CHE included two or more adults, of which, at least one was an elder person, and 20% of the households with CHE lived in the North.
Discussion
In this study, it was found that 0.46% of Portuguese families incurred catastrophic health payments in the period 2015/2016. Compared to 2010/2011, this result represents an improvement in financial protection, as this percentage was then 2.1% (Quintal and Lopes, 2016). Considering the poorest families (first expenditure quintile), there was still an improvement but less pronounced (in this case, the percentage of families with CHE decreased from 4.1% to 1.96%). The value of 0.46% also means that Portugal is now aligned with the best performing countries (World Health Organisation, 2010b; Yerramilli et al., 2018). Nonetheless, these results should be interpreted with caution taking into account that, where the NHS fails to provide health care, the absence of spending may represent unmet health care needs. The pattern of null expenditures, with always higher prevalence among the poorer groups, supports these concerns.
A worrying result is the fact that over 20% of the families with CHE spent on a single item: medicines. Moreover, the average expenditure on medicines among families with CHE surpasses 1,400€, reaching a maximum of 4,675€. The average expenditures (among families with CHE) for other relevant items such as GP and specialist consultations, and dental care were between 250€ and 350€. Some results are understandable, given the characteristics of the Portuguese health system. For example, most hospital care is provided within the public sector, and it is observed that mean expenditures for this service were low, both in the whole sample and among families with CHE (the maximum value in the whole sample is, however, much higher). The impact of specialist consultations and dental care was also comprehensible as they are mainly financed by out-of-pocket payments. However, the results regarding expenditures on GP visits are rather surprising. Primary care services are spread across the country, thus, individuals with low resources should not feel the need (or should not be impelled to) use private health care.
Although the global level of CHE obtained in this study is low, the risk among poor families should raise concerns. Authorities have implemented some protective measures regarding pharmaceutical expenditure (Simões et al., 2017), but they seem to be failing when it comes to poor old people living alone and, to some extent, to poor families with elderly members. Moreover, because there are households incurring CHE with few health care services, this means that these expenditures might be jeopardising not only the access to other goods and services but also the access to needed health care services which are not provided by the NHS. Actually, the maximum expenditure on dental care in the whole sample (15,900€) is found precisely within the group of families with CHE. This is unexpected given the profile of these families. Finally, Portuguese health authorities in the Centre region should be particularly attentive to the situation of poor old people.
INE (2017). Portuguese Household Budget Survey 2015/2016. Lisbon: INE, I.P.
OECD/EU (2018). Health at a Glance: Europe 2018: State of Health in the EU Cycle.Paris: OECD Publishing.
Quintal, C., & Lopes, J. (2016). Equity in health care financing in Portugal: findings from the Household Budget Survey 2010/2011. Health Economics, Policy and Law, 11(3), 233-252.
Simões, J., Augusto, G. F., Fronteira, I. & Hernández-Quevedo, C. (2017). Portugal: Health system review. Health Systems in Transition, 19(2), 1–184.
Thomson, S., Foubister, T.&Mossialos, E. (2009).Financing health care in the European Union – Challenges and policy responses. Copenhagen: World Health Organization.
Wagstaff, A. (2002). Poverty and health sector inequalities.Bulletin of the World Health Organization, 80 (2), 97-105.
World Health Organisation (2000).World Health Report 2000: Health systems: improving performance. Geneva: World Health Organization.
World Health Organisation (2010a).World Health Report 2010: Health Systems Financing – The path to universal coverage. Geneva: World Health Organization.
World Health Organisation (2010b). Exploring the thresholds of health expenditure for protection against financial risk -World Health Report 2010 – Background Paper 19. Geneva: World Health Organization.
World Health Organisation and The World Bank (2017).Tracking universal health coverage: 2017 global monitoring report. Geneva: World Health Organization.
Xu, K., Evans, D. B., Kawabata, K., Zeramdini, R., Klavus, J. & Murray, C.J. (2003). Household catastrophic health expenditure: a multicountry analysis. TheLancet,362(9378), 111–117.
Xu, K. (2005). Distribution of health payments and catastrophic expenditures: Methodology. Geneva: World Health Organization.
Yerramilli, P., Fernández, Ó. & Thomson, S. (2018). Financial protection in Europe: a systematic review of the literature and mapping of data availability. Health Policy, 122, 493–508.