The Bucharest University of Economic Studies, Doctoral School of Finance, Bucharest, Romania
Volume 2022,
Article ID 540675,
Journal of EU Research in Business,
12 pages,
DOI: 10.5171/2022.540675
Received date: 6 January 2021; Accepted date: 17 July 2022; Published date: 10 January 2022
Cite this Article as:
Cosmina - Ștefania CHIRICU (2022)," Economic Growth and Fiscal Policies in Scandinavia” Journal of EU Research in Business, Vol. 2022 (2022), Article ID 540675,
DOI: 10.5171/2022. 540675
This paper comprises the research of the impact that taxation exerts on the economic growth rate in Denmark, Norway and Sweden, through an econometric approach during the years 2002 – 2018. The analysis is based on the estimation of a Panel Data model by taking in account fiscal, economic and control factors as explanatory variables. The empirical evidence emphasizes the fact that fiscal policies in Scandinavia usually exert negative impact on the economic growth due to the discrepancies between the tax systems of each of the analyzed countries.
Taxation in Scandinavian countries is a highly debated subject of public policy and is well-renowned for its high level among Denmark, Norway and Sweden. Whilst criticized, high taxation in Scandinavia is also perceived as an efficient and essential support for public services such as healthcare, education, social security and many others. Each tax system of these Scandinavian countries shares common aspects with each other and with many other tax systems in the European countries. However, during the past century, tax systems have grown complex in order to respond to globalization and economic changes. Also, entrepreneurship in Scandinavia seems to be successful and flourishing due to the efficiency of the business productivity combined with high taxation. In addition, citizens are repaid by their governments in high quality public services.
The structure of each tax system implemented by the three Scandinavian countries is characterized by progressivity. Moreover, tax systems are based on the concept of providing the population with equal access to public services and helping anyone in difficult situations. Scandinavian countries apply taxes on income, profit and other capital gains on a higher level than other European countries and OECD state members. The structure of taxation also includes social securities paid by the employee and the employer. Moreover, governments also gain public revenues from taxes levied on properties, goods and services, primarily through value added taxes (i.e., VAT) with an important emphasis which should be considered on the rates of VAT, which are in line with the rates applied in other EU countries due to the harmonization of this indirect type of taxes. On the other hand, excises are applied on alcohol and tobacco consumption in order to discourage the related consumption which has negative effects on consumers’ health. It is also important to emphasize that in Scandinavia the environmental taxes and vehicle related prices are at a high level.
The aim of the present paper is to assess in a comparative manner the level of taxation in Denmark, Norway and Sweden by using graphic charts and figures for a period of time between 2002 and 2018. Additionally, an empirical analysis has been conducted in order to estimate the impact of the usual taxes on economic growth during the period considered. In this respect, the empirical analysis seeks to measure the impact that fiscal policy has on the economic growth rate considering that the countries located in this European area pay the highest tax rates compared to other European countries. Surprisingly, the Scandinavian countries have different tax structures, thus a comparative assessment is performed in order to highlight the differences between these countries. For this reason, the comparative approach is based on a graphical analysis with a further description of the results. On the other side, the econometrical analysis is based on the estimation of an equation of regression which considers the economic growth rate as dependent variable. As regards the explanatory variables, factors of economical, fiscal and general nature were considered in this respect. The variables are estimated by applying the least squares method.
The paper is structured in six main chapters that include: the literature review, the comparative assessment, the methodology used in the econometrical approach, as well as the results together with their scientific comments, while the last chapter of the paper comprises the conclusions.
Literature Review
Recent studies regarding the impact of taxation on the economic growth rate emphasize the positive impact of taxation on the economy. Gemmell et al. (2011), Acosta-Ormachea and Yoo (2012) and Arnold et. al (2011) present specific solutions in the assessment of the impact which take in consideration the structure of the tax systems and the tax rates that have long term impact on economic growth. Further to the model presented by Acosta-Ormachea and Yoo (2012), researchers Neog and Gaur (2020) have examined the impact of tax structure on economic growth in India for a period of time between 1991 and 2016 by using a panel data regression method comprising information related to 14 Indian states. According to Neog and Gaur (2020), the taxes applied on income, goods and services, have negative effects, while taxes applied on property and capital transactions have positive effects on economic growth, thus recommending governments to focus more on property taxes than on reduction of income taxes. Munir and Sultan (2016) analyze the impact of taxation on economic growth by using data between 1976 and 2014 and a distributive lag model in order to assess the short and long term correlation betwen direct and indirect taxes and economic growth in Pakistan. The authors concluded that there is a long term correlation betwen taxes and GDP real growth.
Dladla and Khobai (2018) focus on assessing the impact of taxation on economic growth in South Africa by applying the Auto-Regressive Distribution Lag (ARDL) method on a database for the period 1981 – 2016. For this reason, the researchers understand that fiscal policies are efficient in sustaining economic growth, while there is a negative relationship between taxation and economic growth in South Africa. Furthermore, Musanga (2007) uses data from 1987 to 2005 in order to test the economic negative impact of taxes in case of a possible increase. Musanga (2007) concluded there is a high potential for the governments to generate fiscal revenues based on higher tax rates. Another paper focuses on the economy of Turkey and the connection between direct and indirect taxation and economic growth for a period of time between 1968 and 2006. On the other hand, Arisoy and Unlukaplan (2010) concluded that indirect taxes are significantly and positively correlated with economic growth in Turkey.
Another scientific paper that considers recent evidence in tax structures and economic growth is developed by McNabb (2018), who used government related revenue data with the view of finding a causality between taxation and GDP growth within a 100 countries panel data approach. In this respect, the author found that results differ in accordance to the income level and draws the attention to policymakers in developing countries to be way more cautious. Mdanat et al. (2018) analyse the tax structure and its implications on economic growth in Jordan for years between 1980 and 2015 by using error corrections techniques. According to their results, fiscal policy in Jordan is not sufficient to highlight the policymaking factors for the reason that Jordan has a weak tax performance and an inneficient tax structure. Also, authors recommend policymakers to focus on the growth of GDP per capita by adressing the importance of customs and consumption taxes in the context of a sustainable economic growth supported by poverty reduction and social welfare development.
In the research article concerning the political aspects of the high income taxation in Denmark, Ganghof (2007) started from the assertion that Denmark’s income tax burden as percentage of GDP is larger than the total tax burden of the United States and has been continously increasing since 1980. In order to explain how this phenomenon happens, the research is based on three factors and considers that high taxes on income are feasible only if the capital tax burden is moderated within the income tax. Moreover, the author explains that drastic changes in the legal structure of the income tax and stability in the tax policy were promoted by the legislative majority rule. Lockwood et al. (2002) discuss the progressive character of the tax system in Denmark by taking in consideration how such system contributes to wage moderation. The authors conclude a progressive taxation of the income leads to wage reduction. Further to their conclusions, an increase in progressivity would reduce the pre-tax earning of workers paid with mid-wage, while high-wage workers may raise their pre-tax earnings. However, they also concluded there are no significant effects of progressive taxes on the low-wage workers. Scandinavian countries however have been considered in policy debates as models showing how to employ equity and efficiency in public expenditure and fiscal revenues.
Although progressive, tax systems in Scandinavian countries combine individual contribution to public sector with collective financing through taxation, the research paper conducted by Andersen (2007) proposed a Scandinavian model of welfare in which various challanges are discussed. The author brings forth the need for a high employment rate in order to ensure financial viability, demographic changes, economic growth and globalization. As evidence from the European Union, Stoilova (2017) aims to assess the impact of tax structure on economic growth in the EU-28 member states during 1996 – 2013 by focusing on emphasising the cross-country differences in respect to taxation based on a panel data regression. Stoilova (2017) concluded that consumption, personal income and property taxes support economic growth.
Comparative Graphical Assessment
The comparative assessment of the present paper aims to present a brief graphical approach of the tax structures in Denmark, Norway and Sweden by using data reported between 2002 and 2018. In addition, it also brings forward a graphical representation of the GDP growth rate. For the purpose of this assessment I have used Microsoft Excel and the data provided by WorldBank and Eurostat.
Great Domestic Product growth rate
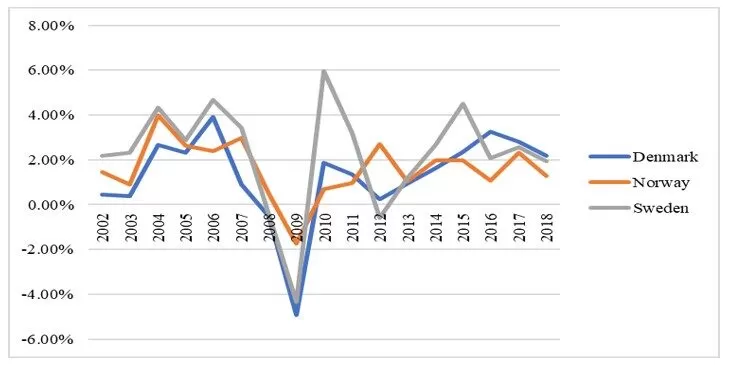
The economic growth rate is based on the real annual GDP growth and is an important indicator of the position of the economy that a country has at a certain point in time. The figure 1 below is the graphical representation of the economic growth trend in Scandinavia during the period under review. The amount values of the GDP growth are measured in percentage. Furthermore, the economic growth of Sweden recorded higher values than the other countries in the period under review with a maximum of 6.1% in 2010. However, the minimum value of economic growth was recorded also by Sweden in 2009 with a value of -5.2%.
Figure 1: Economic growth in Scandinavia during 2000-2017
Source: Author’s own computation of data from Worldbank website.
Although the economic growth rate in Scandinavia followed a slow-paced trend, it is important to emphasize the significant downturn point of 2009 when, as a consequence of the economic crisis, economies of these countries started to follow a decrease trend. Moreover, the graph shows Sweden has quickly recovered its position as lead from an economic point of view, considering that in 2010 it has reached almost 10% in growth.
Taxes on goods and services
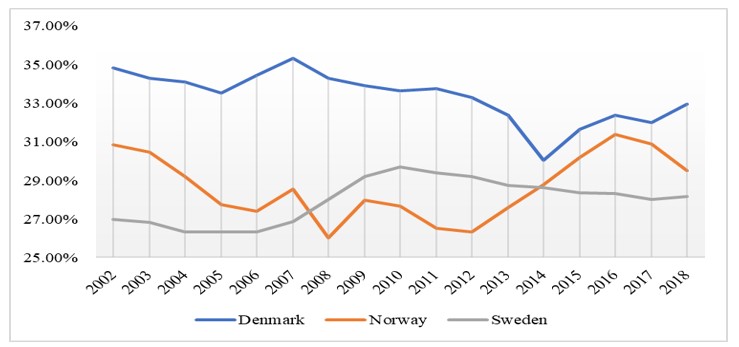
Further to the comparative analysis, figure 2 presents the level of taxation on goods and services measured as share of total tax revenues. According to the representation of the available data, Denmark is the country which recorded the highest revenues from taxes on goods and services during the period under review, while Sweden recorded the lowest revenues in this regard. As a result, Denmark’s tax structure is based on consumption taxes while Sweden, followed by Norway, tends to balance the consumption taxation. For this reason, the results represented in figure 1 emphasized the fact that Sweden, though it has lower taxes on goods and services, has a sustainable economic growth.
Figure 2. Share of taxes on goods and services in the total tax revenues
Source: Author’s own processing
Income Taxes
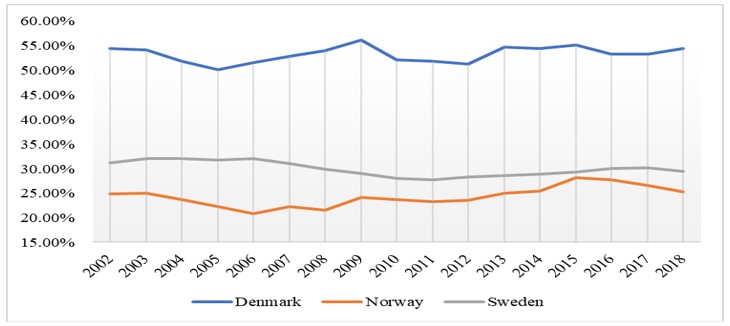
Figure 3 below represents the share of income taxes in GDP and highlights differences between the three Scandinavian countries. In this regard, the highest value was reported by Denmark in 2009, with 56.03% income taxes as share in GDP, while the lowest value of 20.73% was reported by Norway in 2006.
Figure 3: Share of income taxes in the GDP
Source: Author’s own processing
Furthermore, while Norway and Sweden apply equitable income tax rates, it is highly noticeable that Denmark applies higher income tax rates compared to the other Scandinavian countries analysed. A reasonable explanation for the high income tax rates applicable in Denmark is supported by the fact that this country has a high living standard with very good social services and lower corruption (Lockwood et al. 2002)
Profit Taxes
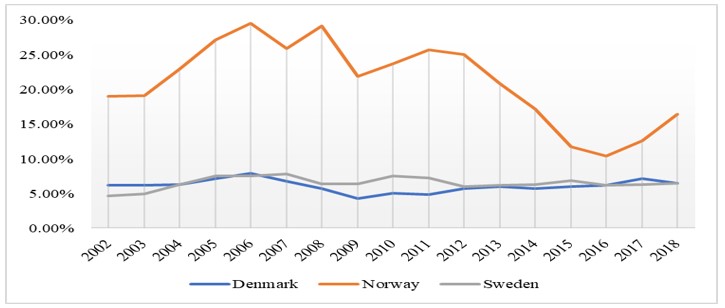
According to the graphical representation in figure 4, corporate taxation in Scandinavian countries is at lower values than the other taxes measured as GDP percentage. Norway recorded in the period under review high revenues from profit taxes compared to the other Scandinavian countries. Moreover, the highest value reported was of 29.05% by Norway in 2009, while the lowest value of 4.22% was reported by Denmark in 2009.
Figure 4. Share of profit taxes in the GDP;
Source: Author’s own processing;
Social contributions
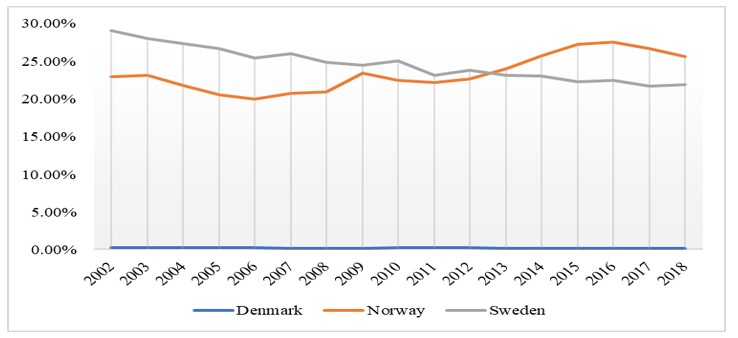
On the other hand, social contributions are at lower values in Denmark (i.e., under 1%), considering this country already has higher income taxes that cover up for social contributions, while Norway and Sweden recorded values between 20% and 30% as share of GDP from social contributions.
Figure 5. Share of social contributions in the GDP
Source: Author’s own processing
Ownership taxes
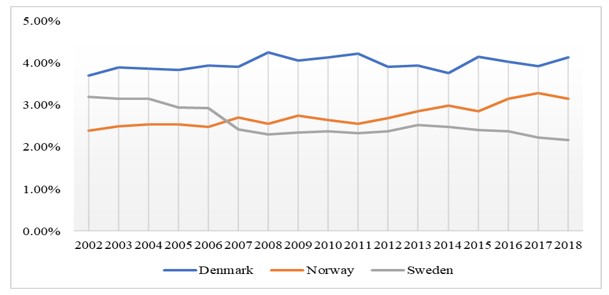
Figure 6 shows the values of the ownership taxes recorded by Denmark, Norway and Sweden during the period under review, measured as GDP percentage. It is noticeable that together with social contributions, ownership taxes have lower values which means that tax policy in this area is relaxed.
Figure 6. Share of ownership taxes in the GDP
Source: Author’s own processing
However, there are not significant differences between the values reported by each country with Denmark having the highest share of ownership taxes in the GDP, followed by Norway and Sweden. In this respect, the highest share of 4.26% ownership taxes was reported by Denmark during 2008, while the lowest share of 2.16% was reported by Sweden in 2018.
Econometrical Assessment
Database and variables description
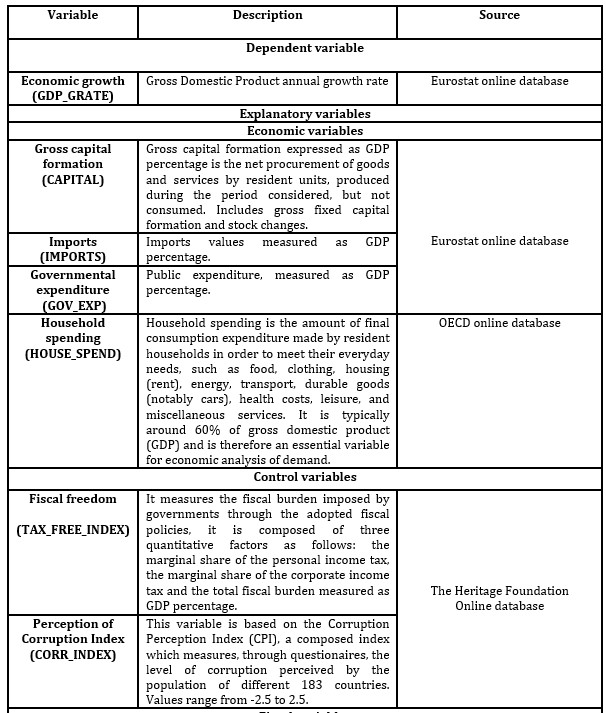
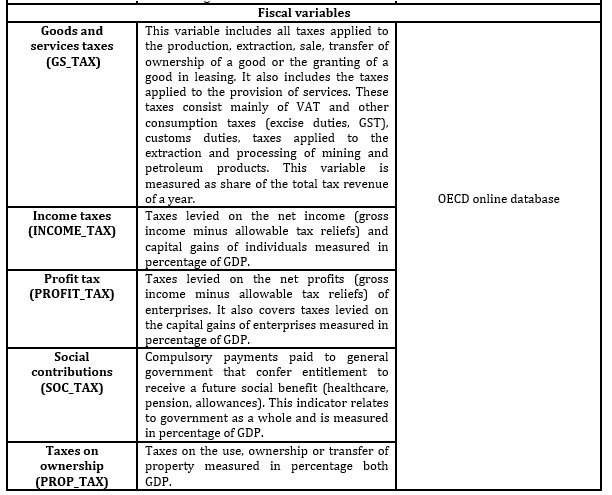
The quantitative analysis of the economic impact that taxation exerts upon the economic growth in the Scandinavian countries consists in the econometrical estimation of the most usual taxes applied in this geographical area. In this respect, the assessment is based on a Panel data regression with values between 2002 and 2018. The main sources for database are the public information available on the Eurostat, MyHeritage, WorldBank and OECD Internet websites. Table 1 shows the variables used within the study, together with their source and description. The software program used for the empirical analysis is EViews 10.
Table 1: Variables used within the model
Source: Author’s own processing;
Regression equation and work hypothesis
The econometric model consists in the analysis of the variables presented in table 1, considering the GDP growth rate as dependent variable. The explanatory variables are represented by both economical and fiscal factors. Also, for the efficiency of the testing, two control variables measuring the fiscal burden and perception of corruption are added. The empirical testing is based on the estimation of an equation of regression which consists in a mix of fiscal variables in order to check the impact that taxation has on economic growth in Scandinavia.
The equation of regression is as follows:
Where i stands for the name of the analyzed country (Denmark, Norway and Sweden) and t for the year (2002 – 2018).
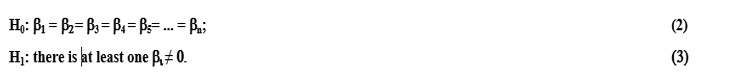
The method used in the estimation of the regression equation is the „least squares”, having the following testing hypothesis:
The following results are tested under the above-mentioned work hypothesis and are also based on the regression equation related to implication (1). For this reason, the present paper aims to find a relationship between fiscal policy and economic growth in Scandinavia, considering as general fact that consumption taxes are regressive and have negative effects on economy (Dladla and Khobai, 2018; Neog and Gaur, 2020), while direct taxation has progressive characteristics.
Panel Data Results
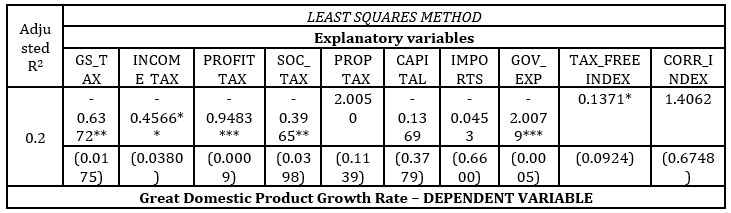
The estimated coefficients of the regression equation are presented in table 2, together with the statistical significance of each of the results. Much more, taxes provide a counter-balance in the economy and ensure governments can build and maintain means of support and benefit for citizens while attracting investment. In this respect, the effects of the explanatory variables on the economic growth are explained by the increase in the values of the variables. For example, the output result shows that taxes on goods and services (GS_TAX) have negative impact on economic growth should an increase in the taxation rates likely materialize (Neog and Gaur, 2020).
Also, it is important to highlight that all the fiscal variables of the model proved to have negative impact on the GDP growth rate in the context of an unusually higher taxation in Scandinavian countries than in other European countries. Thus, the results are a red flag for policymakers, who should consider that increasing taxes in Scandinavia is not a feasible decision.
Table 2: Highlights of the estimated values of the variables
Source: Author`s own processing;
Notes: *** 1% Level of significance; **5% Level of significance; *10% Level of significance.
On the other hand, taxes on ownership of immovable properties proved to be statistically insignificant, while the economical variables, such as gross capital formation and imports, are also insignificant. Furthermore, according to the
estimated values of corruption in Scandinavian countries, such phenomenon has lower presence in that area, thus proving no significant impact on the economic growth.
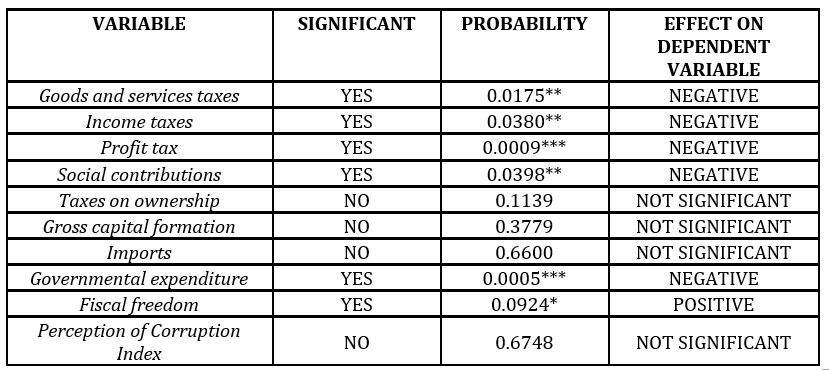
Table 3: Estimated coefficients of the explanatory variables and their significance thresholds
Source: Author’s own computation using EViews 10;
Notes: *** 1% Level of significance; **5% Level of significance; *10% Level of significance.
Moreover, profit taxes proved to have negative impact on the dependent variable for a 1% level of significance. In this regard, research in the field of corporate taxation shows that taxing businesses has damaging effects on long term economic growth because it does not allow companies to grow faster. Government expenditure has negative effects on economic growth on a 1% level of significance, while fiscal freedom shows positive impact on economic growth emphasizing the fact that if taxation in Scandinavia would be more relaxed, it will encourage investments and economic thrive. Also, according to the estimated values of the adjusted R squared, 20% of the variation of the economic growth rate is explained by the impact of the explanatory variables of the model.
Conclusions
The tax structures among the Scandinavian countries reviewed, namely Denmark, Norway and Sweden, are different between these states, but yet efficient and designed to support the social welfare and the economic growth. However, the general trend in the economic growth around Scandinavia has been recently facing a slight downturn. Much more, the results relate to findings of other studies (Dladla and Khobai, 2018; Neog and Gaur, 2020) in terms that taxation has negative impact on the economic growth rate. Furthermore, governmental expenditure has negative impact on the dependent variable, while the tax burden has a positive impact. Aditionally, the negative impact that taxation has on the economic growth rate should be considered a red flag for policymakers, as a result that increasing taxes in Scandinavia is not a feasible decision because it does not support the economical development. However, the analysis is limited by the general lack of data for the control variables and in the future, an update of the Panel model database is intended to be performed in order to comprise more years and observations and to better show the impact of fiscal policy on economic growth and also its social effects on the social welfare.
Acknowledgement
This paper was co-financed by The Bucharest University of Economic Studies during the PhD program.
References
Acosta-Ormachea S. and Yoo J. (2012), Tax composition and economic growth”, IMF Working Paper No. 12/157, International Monetary Fund, Washington, DC;
Andersen T. M., (2007), The Scandinavian model – prospects and challenges, Research Article;
Arisoy I., and Unlukaplan I., (2010), Tax composition and growth in Turkey: An empirical analysis, International Research Journal of Finance and Economics. 59: 50-61;
Arnold J. (2008), Do tax structures affect aggregate economic growth?: Empirical evidence from a panel of OECD countries”, OECD Economics Department Working Papers No. 643, OECD Publishing, Paris;
Arnold J. et al. (2011), „Tax policy for economic recovery and growth”, Economic Journal, Vol. 121 No. 550, pp. 59-80;
Barro, Robert J, 1990. “Government Spending in a Simple Model of Endogenous Growth,” Journal of Political Economy, University of Chicago Press, vol. 98(5), pages 103-126, October. Dladla K, Khobai H (2018) The impact of taxation on economic growth in South Africa, MPRA Paper No. 86219, 1–15;
Ganghof S. (2007), The Political Economy of High Income Taxation: Capital Taxation, Path Dependence, and Political Institutions in Denmark, Research Article, https://doi.org/10.1177/0010414006288973;
Gemmel N. et al. (2011), The timing and persistence of fiscal policy impacts on growth: evidence from OECD countries”, The Economic Journal, Vol. 121 No. 550, pp. 33-58;
europa.eu/eurostat/data/database;
org/index/explore;
Lockwood B., Sløk T., and Tranaes T., (2002), Progressive Taxation and Wage Setting: Some Evidence for Denmark, https://doi.org/10.1111/1467-9442.00222;
Mcnabb K (2018) Tax structures and economic growth: new evidence from the government revenue dataset. J Int Dev 30:173–205. https://doi.org/10.1002/jid.3345;
Mdanat, M. F., Shotar, M., Samawi, G., Mulot, J., Arabiyat, T. S. & Alzyadat, M. A. (2018), Tax structure and economic growth in Jordan, 1980-2015. Euromed Journal of Business, 13, 102-127;
Munir K. and Sultan M. (2016), Are some taxes better for growth in Pakistan? A time series analysis”, MPRA Paper No. 68828, MPRA, University Library of Munich;
Neog, Y., Gaur, A.K. Tax structure and economic growth: a study of selected Indian states. Economic Structures9, 38 (2020). https://doi.org/10.1186/s40008-020-00215-3;
Stoilova D (2017) Tax structure and economic growth: evidence from the European Union. Contaduría y Administración. 62:1041–1057. https://doi.org/10.1016/j.cya.2017.04.006.