Ramesh Chandra Babu and Aaron Ethan Charles Dsouza
CHRIST University, Bangalore, India
Volume 2021,
Article ID 418441,
Journal of Financial Studies and Research,
20 pages,
DOI: 10.5171/2021.418441
Received date: 4 August 2020; Accepted date: 18 January 2021; Published date: 31 May 2021
Academic Editor: Gatot Nazir Ahmad
Cite this Article as:
T. Ramesh Chandra Babu and Aaron Ethan Charles Dsouza (2021)," Post Listing IPO Returns and Performance in India: An Empirical Investigation", Journal of Financial Studies & Research, Vol. 2021 (2021), Article ID 104815, DOI: 10.5171/2021.104815
Objectives: (a) To analyse the performance of Indian IPOs in the short term. (b) To determine the significance of abnormal return of the IPOs. (c) To study the impact of over-subscription, profit after tax, promoters’ holdings, issue price and market returns on IPO performance. Design/ Methodology/Approach: This research paper is based on empirical analysis. All the 52 IPO’s listed in the NSE (National Stock Exchange, India) during the year 2018 to 2020 were considered for the study. The study is based on secondary data. The daily share price and Nifty-50 index value were taken from NSE website (www.nseindia.com) and other relevant data from red-herring prospectus of the respective company. The research / statistical tools used are: Market adjusted short run performance model, Wealth relative model, ‘t’ test and regression analysis. Scope of the study: The scope of the study is limited to the IPO’s listed only in the National Stock Exchange (NSE), India. Period of study: The study covers a period from January 2018 to December, 2020. Limitation of the study: The study considers only the influence of the external factors on the performance of IPOs. Findings: The average IPO return on the first trading day is 13.52%, ranging from -23.15% to 82.16% with standard deviation of 26.72%. The average IPO return on the third trading day was the highest and is found to be14.52%, ranging from -19.22% to 117.55% with standard deviation of 18.57%. The analysis reveals that the over subscription impacts the IPO performance and the other factors namely, issue price, Profit after Tax, market returns and promoters holdings do not influence IPO returns.
Originality / Value: This is an original work that analyses the listing gain or loss and the post listing performance of IPO’s in India and other factors that might influence the listing gain or loss.
Keywords: IPO Underpricing, IPO performance, listing gains, subscription ratio, Market adjusted short run performance model, Wealth relative model.
Post listing IPO returns and performance in India: An empirical investigation
Introduction
Initial Public Offering (IPO) refers to the issue of shares by the company directly to the public for the first time. The subsequent issue of shares by the company directly to the public is referred to as Follow on Public Offer (FPO). It is really a tricky decision to put the money in a relatively new company. In IPO investing, there is a chance of getting a significant first day capital gains, or long-term capital gains. On the other hand, there is a chance of incurring a significant first day capital loss, or long-term capital loss.
Usually, a company hires an investment bank to manage an IPO before it goes for a public issue. The under-writers and investment bankers assess the quality of management, future cash flows and returns before arriving at the final offer price and the comparative valuation is done based on the listed peer company.
The usual anomaly which an investor finds in an IPO issue are (a) underpricing or overpricing (b) information asymmetry (c) agency problem between the investment bank and the issuing firm. IPO underpricing refers to a situation where the listing day closing price is greater than the initial offer price and the overpricing refers to a situation where the listing day closing price is lesser than the initial offer price. An IPO maybe underpriced deliberately or accidentally. Sometimes, an IPO maybe deliberately underpriced to woo the investors or accidentally underpriced when the underwriters underestimated the demand. Information asymmetry refers to the imbalance in the knowledge of information among the investors (and other stakeholders) about the company and its potential growth.
Theories related to the study
The theories closely related with this study are the theories of Under Pricing. The IPO Underpricing theories can be broadly classified into (1) Information Asymmetry theories (2) Institutional theories (3) Ownership and Control theories (4) Behavioral theories.
The theories that support Information Asymmetry theories are: (a) Principal – Agent theory (b) Ex-ante Uncertainty theory (c) Book-Building theory (d) Signaling theory (e) Certification (f) Winner’s Curse theory (g) Entrepreneurial Wealth loss theory (h) Partial adjustment theory.
The theories that support Institutional theories are: (a) Law-suit avoidance theory (b) Price Stabilization theory (c) Tax argument theory.
The theories that support Ownership and Control theories are: (a) Entrenchment Managerial Control theory (b) Agency-cost theory.
The theories that support Behavioral theories are: (a) Information cascade theory (b) Investor Sentiment theory (c) Prospect theory.
All the above said theories tried to give explanations as to why the IPO Under-pricing happens and the variations in in the IPO Under-pricing among different firms across different countries. Despite enough evidence of underpricing, all the available research papers show that there are no universal explanations for IPO underpricing.
Review of literature
Madan (2003) – “Investments in IPOs in the Indian capital market” examined the relationship between return on listing and issue price, issue size, age of firm, issue capital listing and was found negative. The study found that the relationship between the variables was statistically significant. The researcher also found that the issue rating was positive for relationship between returns on listing of the IPO shares and foreign equity. The study concluded that in the long run, there was a significant fall in IPO returns. The returns of initial public offerings was observed to be negative for the period of the 2nd to the 5th year of listing.
Vichakorn C, Kennedy D. G. (2005) –“The factors affecting on IPO return in Thai Stock Market”. The research was carried out by applying multiple regression models to study
the relationship between several variables and the initial return of the IPO. Secondary data was the necessary information for the analysis. The initial return of the IPO was regarded by the investigator as the dependent variable and 7 other variables as the independent variable.
It was found that there was 14% to 24% returns by IPOs in Thai stock market. The figure was similar with the returns seen in the international Stock markets.
Datar and Mao (2006) – “Deep underpricing of China’s IPOs: sources and implications” have suggested that the issuer company knowingly underprice the IPOs to encourage a wider subscription. According to the researcher, on the listing day of the shares, it is noted that investors are over-enthusiastic and thus bid for IPOs at a price well above the true fundamental value of the stock. This is the major reason for abnormal returns of the IPO on the listing day.
Alok Pande and R. Vaidyanathan (2007) – “Determinants of IPO Underpricing in the National Stock Exchange of India” , looks at the pricing of IPOs in the NSE. In terms of the demand that the IPO has generated among the investors, the delay in listing of the shares on the stock exchange, and the money that the company spends on marketing the initial public offering, the researchers try to understand empirically the 1st day underpricing of initial public offerings. The researchers are also trying to understand whether the Indian IPO market has any emerging trends. The research also tries to find a month in the post IPO returns. The study’s key findings was that the demand which the initial public offering had generated and the listing delay of the IPO had a significant positive impact on the first day of pricing. The money spent on the promotion of the IPO had no major effect on pricing on the first day. The study also found that the performance of the IPO post 1 month of listing is negative.
Singh and Sehgal (2008) – “Determinants of Initial and Long-Run Performance of IPOs in Indian Stock Market” investigated the possible determinants of underpricing and the long run performance of 438 Indian initial public offerings (IPOs) listed on the Bombay Stock Exchange during June 1992–March 2001. The researchers found that underpricing in Indian IPO’s has been found to be 99.20%. The level of under-pricing is extremely high compared with the international evidence. The study also found that some of the important determinants of under-pricing are Age of the firm, listing delay of the IPO and the demand for the IPO. It was also found that in the long run, the Indian initial public offerings don’t tend to underperform.
Sahoo and Prabina (2010) in the research paper titled, “After Market Pricing Performance of Initial Public Offerings: Indian IPO Market 2002-2006” studies performance of 92 IPOs. The researchers have determined that the average level of under pricing of initial public offerings in India is to the extent of 46.55%. The level of under-pricing was obtained by comparing the listing day performance with the market index.
Nurwati A. Ahmad-Zaluki and Lim Boon Kect (2012) – “The investment performance of MESDAQ market initial public offerings(IPOs)” provided evidence on both the short-run and long-run investment performance of Malaysian initial public offering (IPO) companies that are listed on the Mesdaq market. The researchers studied about the factors that influence the performance of IPOs. The results of the study were in line with previous Malaysian studies. It was found that the raw returns and the market-adjusted initial returns of IPOs are extremely under-priced in the short-run. However, it was seen that the IPO companies were underperforming the market in the long run. In contrast to the results found in previous Malaysian studies using a subset of listed firms, the researchers’ findings concentrated on long-term success. Researchers determined that businesses in the technological sector that launched IPOs in the hot issue period and under-priced their IPOs did less well in the long term. The fad hypothesis of long-run under performance is confirmed by this observation. The results obtained also suggest that investors who buy shares of the IPO on the Mesdaq market make significant returns in the short-run. However, they do not fare well in the long-run. The research provides new information to investors in order to evaluate IPOs listed on bursa Malaysia.
Bansal &Khanna (2012) analyzed that there is significant difference between the magnitudes of level of underpricing of IPOs that priced through the book build with those priced through the fixed price option and IPOs price through book build are more underpriced than fix price option IPOs.
Bagga, Khurana & Singh (2012) analyzed that IPOs of January, 2001 to August, 2011, most of the stocks have generated listing profits whereas in long term most of the companies have underperformed compared to market returns. The researchers advised the investors the following 3 strategies while investing in an initial public offering. The first strategy is that the investors could sell all their shares on the listing day itself and thereby make listing gains in most cases. The second strategy is that the investors could book partial profit on the listing day and hold the remaining shares for a long term. This will help in reducing risk. The third strategy is that the investors could hold their shares for a period of more than 5 years. However, they should ensure that the company is fundamentally strong if they decide to invest for a long period.
Jotwani and Singh (2012) noted that subscription rate of the IPO plays major role only in short run. The sudy concluded that the investors may try to analyse the demand and supply for an IPO before deciding whether to invest or not. They can use the over subscription rate of IPO, before deciding whether to invest or not. It was found that the demand for the IPO has a significant impact on the performance in the short run
Puri H (2012) in his research entitled “An Empirical Investigation of Short-Run Performance of IPOs in India” analyzeded the short run market adjusted performance of 100 IPOs listed on National Stock Exchange (NSE) from the period April 2008 to March 2011(3 years). This study found that Indian IPO market provides positive abnormal return to investors on short-run basis (1st and 7th day). The researchers found that the IPO returns start decreasing at the end of 30th day and the IPO shows negative return. It was found that market adjusted average return of the IPO for the first, seventh and thirtieth trading day is 7.23%, 2.09%, and -8.58%. The researchers also used T-Statistic to determine the significance of the market adjusted returns. The researchers made use of the wealth relative model to analyze the short run performance of IPOs. This model also proved the same results that the returns start diminishing towards the end of the 30th trading day. It was found that the wealth relative index values are 1.07, 1.02 and .91 for first, seventh and thirtieth trading day. The researchers presented the performance of IPOs on yearly basis. It was found that for the year 2009-10, IPO’s showed exceptional performance.
Ganesamoorthy, L., & Shankar, H. (2013) in their study entitled “The performance of initial public offerings based on their size: An empirical analysis of the Indian scenario” focused on the performance of Initial Public Offerings (IPOs) made by the Indian companies on the basis of the IPO size. For this analysis, the researchers used a sample of 219 Indian IPOs that were released during the 2001 to 2010 period. The research used the traditional approach of event study and an event window was built for a span of 75 days from the shares’ listing date. The researchers calculated the market-adjusted return by subtracting the market returns from the actual return of shares in order to eliminate market factors. The researchers classified the IPOs into 3 categories namely small, medium and large based on the size of the issues. It was found that large-size IPOs performed better compared to small and medium-size IPOs. The research also found that small-size IPOs were relatively overpriced compared to medium and large-size IPOs.
Batool K. Asiri and Aalaa J. Haji (2014) – “The determinants of IPO underpricing in the GCC countries” documented the phenomenon of underpricing initial public offerings (IPOs) for 194 firms that went public between 2000 and 2013 in the markets of the six gulf cooperation council (GCC) countries. The research was carried out to determine the factors that potentially influence abnormal returns on the listing day. The researchers have used several variables which have been previously evaluated like. The researchers also made use of various other variables and additional variables like seasonal affective disorder. The key findings of the study were that both the firm age and the size of the bid are negatively linked to the under-pricing stage. The study also indicated that there exists a relationship between financial and non-financial companies, and that there are many gaps which exist between insurance and banking firms. One of the significant results of the analysis was that it seemed that the discrepancy between the month of Ramadan and the month of the IPO was significant. The author had carried out the models during the financial crisis period and it was found that almost all appeared to be significant.
Leila B & Farshid A. (2014) –“Study of Factors Affecting the Initial Public Offering (IPO) Price of the Shares on the Tehran Stock Exchange.” The research was carried out to determine if the pricing of IPOs in Tehran Stock Exchange is less than actual. The researchers also study the different factors which affect pricing of IPOs on the Tehran Stock Exchange. To carry ou the study, a sample of 115 stock exchange companies which were listed between 2006 to 2012 was considered. The finding of the study was that the Price to Earnings ratio of a firm has a significant impact on the price changes of IPO’s. The ration had the highest impact on price of the IPO.
Shah S, Metha D (2015) – Initial performance of ipos in india: evidence from 2010-2014 studied listing day performance pertaining to 113 IPOs in India during January, 2010 to December, 2014, listed in National Stock Exchange (NSE) India. The researchers found that, on an average, most IPOs have a significant positive return on the first trading day. It was also found that the Market Adjusted Abnormal Returns (MAAR) of the IPO companies was 7.19%. The researchers observed that most IPOs are underpriced initially. They made use of t-test to verify the returns of the IPOs. The mean initial return of the IPOs was 7.19%. In order to analyse whether there is a link between the degree of underpricing of IPOs and other independent variables such as the issue price, the scale of the problem, over subscription and the returns from the market index, the researchers used the regression model. The findings obtained from the regression analysis showed that there was no important relationship except over subscription between the IPO’s degree of underpricing and the other independent variables. As the IPOs are underpriced during the initial days, the researcher recommends that investors should consider to invest a part of their capital in a new issue during the initial days.
Reddy K S (2015) in his article entitled “The aftermarket pricing performance of initial public offers: Insights from india” examined the underpricing of initial public offers (IPOs), which were announced by Indian firms for the period 2007 through 2009. The fact that well-developed capital markets are a function of the economic development of a nation and a reflection of its financial system motivated the report. The key findings of the analysis were that, in the short run, post-listing IPOs produce a good return. In the long run, however, the returns begin to plunge and they become negative. The highest returns from IPOs were observed during the first week of post-listing.
Jampala, R. C., Lakshmi, P. A., & Dokku, S. R. (2016) – “A Study on Factors Influencing the Initial Public Offerings (IPO) in the Bombay Stock Exchange (BSE), India: During 2007-2013” This study has examined the IPO performance in India from 2007 to 2013. The major finding of the study was that underpricing exists in the 1st day of trading. However, the researcher has observed that the degree of underpricing has significantly decreased compared to the previous studies. The research also found that the issue variables influence the initial public offerings. It is observed that the face value of shares and level of over subscription influence the listing day performance of IPOs in a major way. After 3 years from listing, it is seen that IPOs are underperformed by 29.09%. The researcher found that some of the factors impacting the IPO performance in the long term are the market capitalization of the company, issue share premium, face value of the shares, issue price of the IPO, and the number of times the IPO is over-subscribed are some of the factors affecting IPO success in the long run. The researchers considered a sample of 146 companies to identify the various factors influencing the Initial Public Offerings (IPO) in the Bombay Stock Exchange (BSE)
Poornima S, Haji A (2016) – “A study on the performance of initial public offering of companies listed in NSE, India & Gulf base GCC index.” The researcher analyzed the short-term performance of the companies in this analysis in order to explain the phenomenon of irregular returns as well as the long-term performance in order to evaluate the long-term performance of the IPOs. Between Jan 2013 and Dec 2014, the thesis was performed. The researchers considered a sample of nine companies listed in NSE for the study. The researchers found that IPO stocks are a good instrument for long term investment. In order to maximize their profits, they recommended that investors subscribe to the initial public offering or buy the shares from the primary market and retain them for a defined time in the secondary market.
Patel A (2016) – “Determinants of Listing Day Performance of IPOs: Study from Indian Equity Market” carried out a study based on listing day performance of 80 initial public offerings (IPOs) in India during January, 2011 to June, 2016, listed on National Stock Exchange (NSE), India. The researchers observed that on an average, the listing day returns of IPOs were positive. The investigator performed a sample t-test to check whether or not the average raw returns and the average market adjusted excess returns (MAER) are substantially below values. The researcher found that during the study period, the MAER of all samples IPOs was 14.01 percent and it was important at the 1 percent stage. The investigator concluded, therefore, that IPOs were substantially underpriced. The researcher also used the Multiple Regression model to examine the relationship between MAER and other independent variables such as the size of the problem, subscription question, listing delay, keeping of the business age and post problem promoters. It was found that there was no important association between MAER and the other independent variables such as the keeping of age and post problem promoters through the multiple regression study. It was also noticed that MAER showed a significant link with the size of the issue, over-subscription and delay in listing.
Ambilya. M et al (2016) in their paper entitled “A Study On Performance of IPOs under NSE from issue price to last trading price in the year 2013-2015”, studied the performance of IPO’S listed in National Stock Exchange (NSE) during, 2013 to 2015. The study found that, on average, initial public offerings yield dramatically positive returns. The majority of investors were also found to invest in the IPO primarily on the basis of the company’s image and not on the basis of a fundamental analysis. It has also been found that most shareholders tend to buy at a lower cost. It is noted that the last trading price is often greater than the price provided by the IPO. The new trade price comes after the price offered in the analysis by the IPO.
Roopa P. (2016) investigated on introductory execution of Initial public offerings’ in India during 2015-2016 – Valuing Instruments is a significant choice before giving Initial public offerings. The study assumes that any initial public offerings in the stock market are an indispensable job in success and failure. One of the big developments Indian Capital Markets has seen in the past is the presentation of deals through the method of book building.The researchers considered in this paper the execution of 69 initial public offerings on the posting day either by Book Building technique for open initial public offerings or through fixed value strategy during the monetary year 2015-16.
Bhanu M et al. (2016) in their article entitled “Long-run performance of IPO market in India” examined the Long-run performance of initial public offerings (IPOs). The data was obtained for 31 IPOs from the period 2000 to 2003. Using SPSS Version 16, the researchers used the Logistic Regression Model to test the relationship between long-term IPO output and short-term company performance variables. The study reveals that long-term variables have no relationship or negative relationship with short-run variables. It has a positive relationship with some of the theory supporting the view that there should be small listing gains, moderate short-run gains and large long-run gains for IPO markets to be successful. Only then will the long-term growth of the IPO sector take place. But the true scenario is the opposite. Companies have listing earnings, short-run earnings, but they do not make long-term gains.
Dhamija, S., & Arora, R. K. (2017) in their article entitled “Determinants of long-run performance of initial public offerings: Evidence from India” studied the the long-run performance of 377 initial public offerings (IPOs) made by Indian companies during the period 2005–2015. The aim of the paper is to examine if, in the long run, Indian IPOs are underperforming or outperforming the large market and to identify the key determinants of their long-term success. The findings indicate that Indian IPOs outperform the general market, preceded in the long run by considerable under-performance initially. During 2005-2015, the IPOs listed on the main board yielded an average initial excess return (IERs) of about 22 percent. Negative IERs were, however, provided by 37 per cent of the IPOs. The IPOs underperformed the wide industry, producing an abnormal buy-and-hold return of 57.33 percent (BHAR) over 36 months following listing. Over 36 months holding time, just 38 out of 377 IPOs (10 percent) outperformed the benchmark index. The type of issuer (government-owned or private), lead manager credibility (LMP), promoter retention and the scale of the issue are the significant problem characteristics that affect the long-term success of IPOs in India.
Suri A, Hada B (2018) in their article entitled “Performance analysis of initial public offerings in India” examined the performance of 107 IPO’s in Indian stock market . The time period for the study was between the period 2011 to June 2017. The researchers verified the IPOs on the basis of two main performance metrics namely the over-subscription ratio of the IPO and the listing day gains generated by the IPO. The purpose of the study was to compare between January 2011-May 2014 and June 2014-June 2017 the performance of the IPOs. The study findings indicate that the performance of the IPOs launched between 2011 and May 2014 was substantially different from the performance of the IPOs launched between June 2014 and June 2017. It was also investigated that the amount of IPOs and the fund raised from them also varied significantly for the two years.
Tanted N, Mustafa S (2019) – “ A Study of Returns Between IPO Issue Price and Listing Day Price” (2019) conducted a study to identify the difference in returns between IPO offered price, Listing day opening price, closing price. The goal of the study was to assist investors to make an investment decision through the IPO or buy it directly from the secondary market. Data is collected for the review of all IPOs released over 10 years. The study concluded that the price offered by the IPO, the open-day listing price and the closing-day listing price did not vary statistically significantly. The mean value for the open price listing day was higher than the price provided by the IPO. For the listing day close price, the mean value was high compared to the listing day open price. For the listing day closing price, when the price offered by the IPO was high, the mean value was high.
Statement of problem
IPO’s are often seen as a speculative possibility to make exceptional gains on the listing day. There is, however, uncertainty about the effects of various determinants such as issue size, over subscription, age of business, holding of promoters post issue and various other fundamental factors on the success of the IPOs. There also exists confusion among investors whether to hold the stock for a short term or to sell it on listing day. If these problems are not addressed, investors may not be able to effectively analyze the stock while formulating an investment strategy.
Objectives of the study
The objectives of the study are:
To analyse the performance of Indian IPOs in the short term.
To determine the significance of abnormal return of the IPOs.
To study the impact of over-subscription, profit after tax, promoters’ holdings,
issue price and market returns on IPO performance.
Scope of the study
The scope of the study is limited to the IPO’s listed only in the National Stock Exchange (NSE), India.
Hypothesis
H0 = There is no association between IPOs performance and various determinants.
H1 = There is significant association between IPOs performance and various determinants.
Research Methodology
Research Design
Descriptive research design is used to assess the efficiency of IPOs and the effects of different determinants such as issue size, over subscription, listing delay,age of the firm and post issue promoter’s holding on the performance of IPOs.
Period of study
The study covers a period from January 2018 to December, 2020.
Data Collection
This study was completely based on secondary data. The official website of NSE India is used to collect the list of IPOs during the study duration, the daily stock price and the data on the market index namely, nifty. The red herring prospectus issued by the company ois used to get details regarding the listing date, issue size, age of firm and Promoter’s holding. Over subscription and listing date data are collected from NSE website.
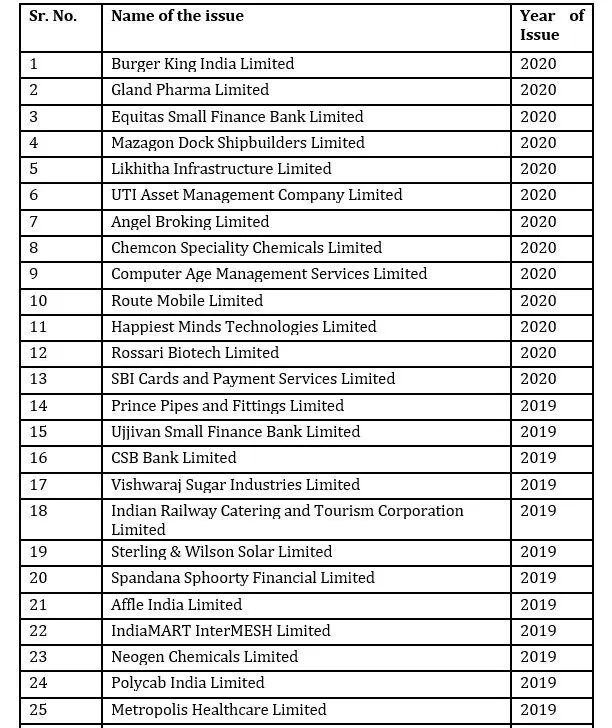
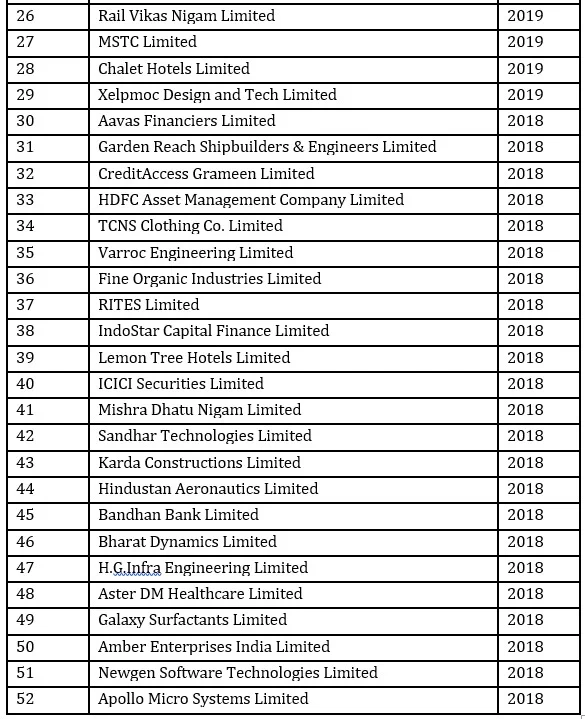
Sample Selection
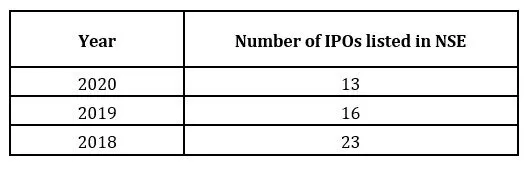
The sample consists of all Indian companies which issue IPOs and listed on National Stock Exchange (NSE) during January 2018 to December 2020. The below table shows the number of IPOs which have been listed
Table 1: Sample Details
Data Analysis & Interpretation
Short Term Returns
The methodology for investigating the short-run performance of IPOs has been kept simple and is based on the methodology used by many of such past researchers.
Returns for first 22 trading day for stocks and market are calculated based on the below formulas.
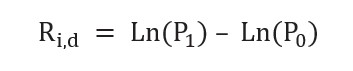
The logarithmic returns for stock “i” at the end of the dth day is calculated as:
Where,
Ri,d is the return on “i” at the end of the dth day,
P1 is the closing price of the stock i at the dth day
P0 is its issue price
Table 2: Mean Stock Returns
The logarithmic return on the market index (NIFTY 50) during the same time period is:
Rm,d = Ln(I1) – Ln(I0)
Where,
Rm,d is the return on index at the end of the dth day,
I1 is the closing S&P CNX Nifty value at the dth day and
I0 is the closing S&P CNX Nifty value on the offering day of the stock
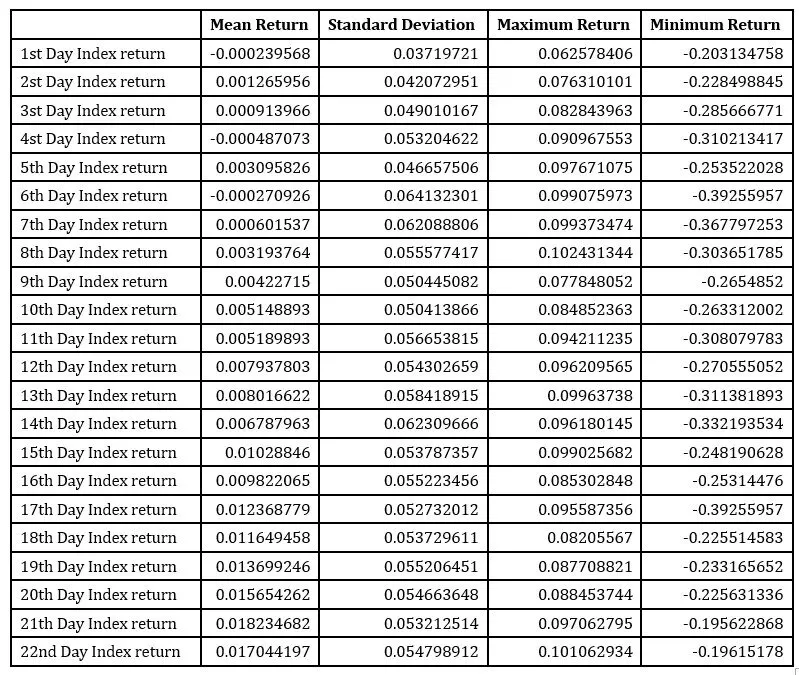
Table 3: Mean Index Returns
Interpretation
The above tables show the various statistics like mean return, minimum return, maximum return and standard deviation on the stock and index value for the first 22 trading days. It is observed that on an average, the stock return was 13.52%, ranging from -23.15% to 82.16% with standard deviation of 26.72% after first trading day. For the similar 1st trading day, Index return on average remains -0.0%, while it ranges from -20.31% to 6.25% with standard deviation of 3.72%. Therefore, we can conclude that the IPO outperforms the market on the first trading day.
It is observed that the highest returns are observed on the 3rd trading day. The average returns were 14.52%, ranging from -19.22% to 117.55% with standard deviation of 18.57%. For the similar 3rd trading day, Index return on average is 0.09% and it ranges from -28.56% to 8.26% with standard deviation of 4.90%
On 5th trading day, it is seen that the average stock return were 13.59%, ranging from -20.65% to 98.66% with standard deviation of 28.83%. For the similar 5th trading day, Index return on average remains 0.30% and it ranges from -25.65% to 9.76% with standard deviation of 4.66%. Therefore, we can conclude that the IPOs continued to outperform the markets at the end of one week of listing.
On the 22nd trading day, the stock return on average was 13.44%, ranging from -36.67% to 104.21% with standard deviation of 29.44% . For the similar 22nd trading day, Index return on average remains 1.70%, while it ranges from -19.61% to 10.10% with standard deviation of 5.47%. This implies that there is a small decrease in the performance of the compared to the first and fifth trading day. The IPO under performs compared to the broader market.
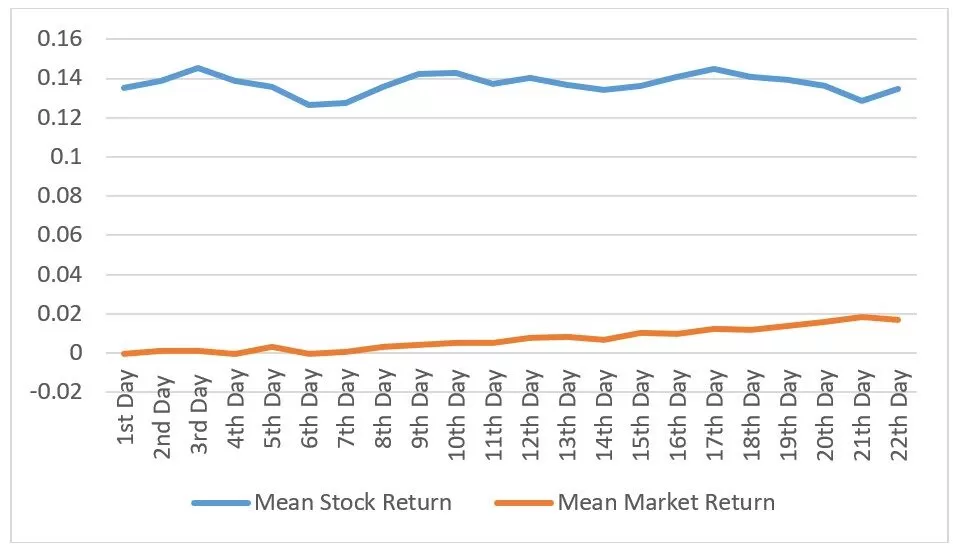
Graphical Representation of mean IPO return and market return
Figure 1 : Graphical Representation of mean IPO return and market return
Interpretation
From the above graph, we can observe that the IPO’s outperform the markets in the short run. It is seen that the IPO deliver superior returns during the first three trading days. The highest returns are seen on the third trading day. Following the third trading day, there is a small fall in the returns of the IPO which could be due to profit booking of investors. The fall continues till the 6th trading day. Following this the returns gradually start increasing again.
It is also observed that towards the end of the month, the returns start decreasing. On the last day of the month (22nd trading day), the returns of the IPO are slightly lower compared to the first day returns.
Market-adjusted Short Run Performance & Wealth Relative Model
Using these average stock returns and the market returns, the market-adjusted short run performance for each IPO on dth day of trading is computed as:
MASRPi,d = { [ ( 1 + Ri,d ) / ( 1 + Rm,d )] – 1 }
This model measures the initial trading returns adjusted with the market returns. This sort of measurement has been commonly used in many past studies to measure the short run performance of IPOs with risk adjustment, assuming the systematic risk of the newly listed stock to be 1.
The average of market adjusted short run performance return for the dth trading day is represented in the formula by MASRPd, which is a performance index. It is actually the return in excess of the market return on investment divided equally among n new:
MASRPd = 1N ∑ MASRPi,d
To test if the MASRP equals zero, the associated t statistic is computed:
t = (MASRPd) / (S/√N)
Where,
S is the standard deviation of MASRP,d across the companies and N is the no. of sample.
The wealth relative model has also been applied to measure the short run performance for group of IPOs.
WRd = (1+ 1/N ∑Ri,d) / (1+ 1/N ∑Rm,d)
Where WRd is the Wealth Relative for the dth trading day
and n is the total number of IPOs in the sample.
A wealth relative score of more than one means that the IPOs has performed better than market during the period of study. Wealth relative index score less than one indicates poor performance in comparison to market.
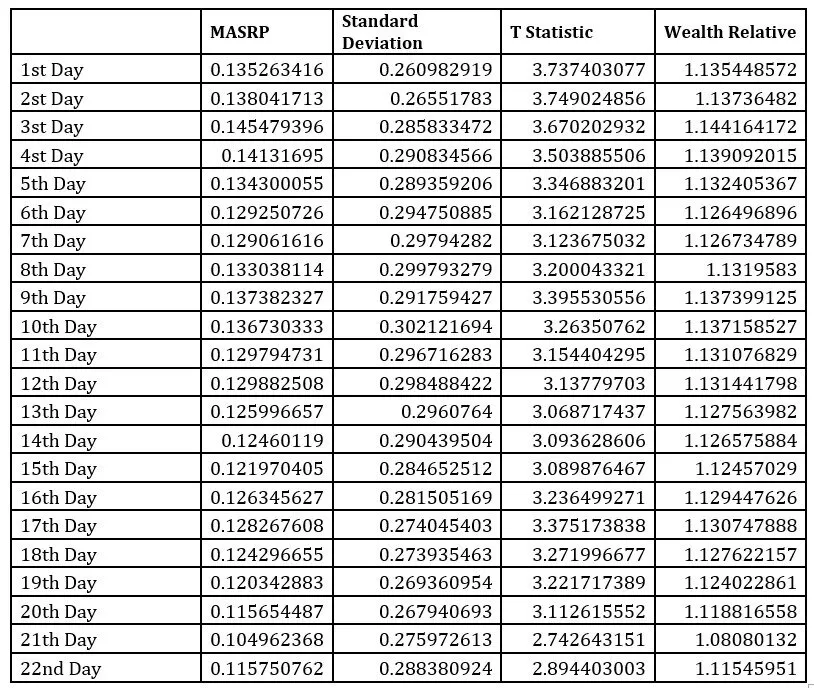
Table 4: Market-adjusted Short Run Performance & Wealth Relative Model
Interpretation
The above table shows the market adjusted initial returns, standard deviation and wealth relative index along with t-statistic. The market adjusted short run performance for the 1st, 5th and 22nd day are 13.52%, 13.43% and 11.58% respectively which simply means that the abnormal returns are slightly falling near the end of the month. The similar result is being shown by the wealth relative index which is 1.14, 1.13 and 1.11 for respective days. The critical value of T at 95% confidence level is 2.009. It is observed that the calculated values for all the days are greater that the critical value. Hence, we can conclude that the returns are significant.
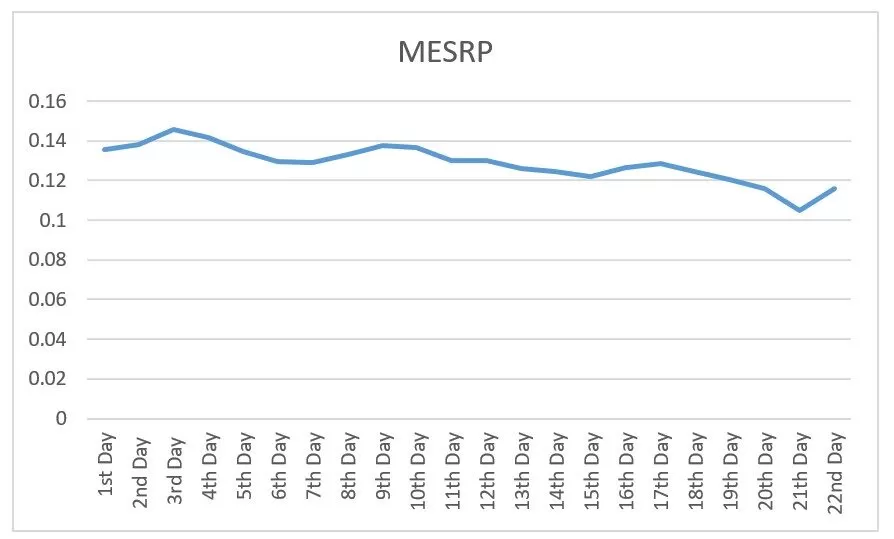
Graphical Representation of Market Adjusted Short Run Performance
Figure 2 : Graphical Representation of Market Adjusted Short Run Performance
Interpretation
From the above graph, we can observe that the market adjusted sort run performance of the IPO rises between the first and the third trading day. The performance is the highest on the 3rd trading day.
Toward the end of the month, the market adjusted short run performance is falling which shows that the returns of the IPO in comparison to the market returns is slowly decreasing.
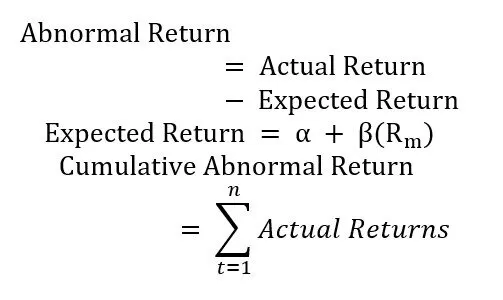
Calculation of Abnormal Returns
Abnormal return is the difference between the actual return of a security and the expected return. Abnormal returns are sometimes triggered by “events.” Events can include mergers, dividend announcements, company earning announcements, interest rate increases, lawsuits, etc. all of which can contribute to an abnormal return. Events in finance can typically be classified as information or occurrences that have not already been priced by the market.
The abnormal returns and cumulative abnormal returns are calculated using the below formulas.
Table5: Abnormal Returns
Interpretation
From the above table, we can observe that there is significant abnormal returns delivered by the IPO on the first trading day. The mean abnormal returns on the first trading day is 11.09%. From the second day, the abnormal returns are negative. At the end of the 22nd trading day, it is observed that the cumulative abnormal returns are approximately equal to zero.
The critical value of T at 95% confidence level is 2.009. It is observed that the calculated T value for mean abnormal return is greater that the critical value for the first day only. Therefore, only the first day Mean Abnormal Return are significant.
The T statistic of the mean cumulative abnormal returns is greater than the critical T Value for the first 19 trading days. Therefore, only the first 19 days Mean Cumulative Abnormal Returns are significant.
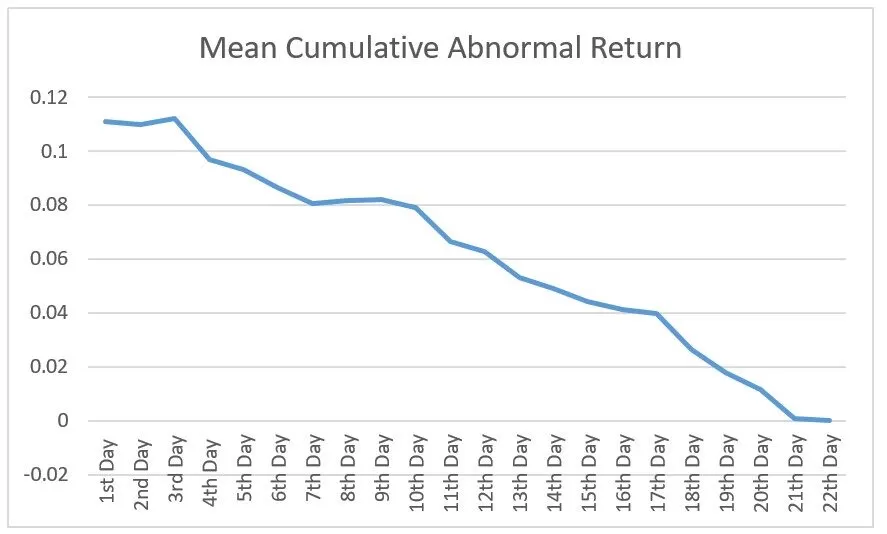
Graphical Representation of Cumulative Abnormal Returns
Figure 3 : Graphical Representation of Cumulative Abnormal Returns
Interpretation
From the above graph, we can observe that the mean cumulative abnormal returns are highest on the first trading day. The cumulative abnormal returns have been subsequently falling. At the end of the month, the cumulative abnormal returns are approximately equal to zero.
Determinants of IPO performance
Multiple regression analysis has been applied to examine the effect of issue price, over subscription, profit after tax, post IPO promoters’ holdings and the market returns on the IPO returns at the end of 22 trading days. This technique helps in identifying the extent and direction of relationship between the dependent variable and several independent variables. The R square and the adjusted R square generated by it indicates the proportion of variation in the dependent variable explained by the independent variables
Hypothesis
H0 = There is no association between IPOs performance and various determinants.
H1 = There is significant association between IPOs performance and various determinants.
ln_OS = Natural Logarithm of the over subscription
ln_PAT = Natural Logarithm of the profit after tax
ln_PH = Natural Logarithm of the promoters’ holdings
Market Returns = Mean Market returns
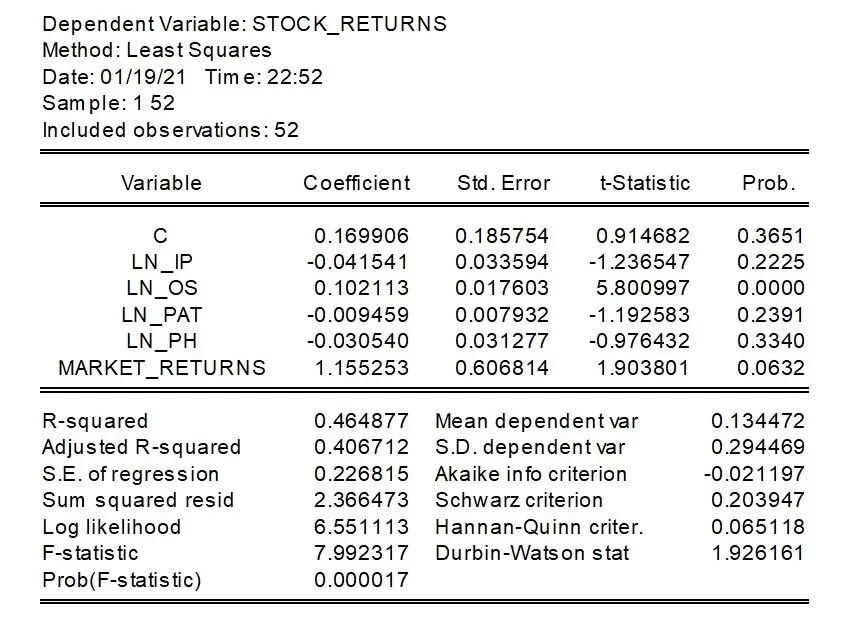
Figure 4: Results of Regression Analysis
Interpretation
From the probability values, it is observed that except over subscription (P =0.0000), all the other factors like Issue Price (P = 0.2225), Profit after tax (P= 0.2391), promoters holdings (P= 0.3340) and market returns (0.0632) have no impact on IPO returns.
For 1 unit increase in the over subscription causes 0.102-unit increase in the IPO returns. Looking at the Adjusted R squared value i.e. 0.406712, we can say that around 40.67% variations can be explained from all independent variables.
F Statistics probability i.e. 0.000017 also shows that when independent variables are taken
simultaneously, they are equal to zero.
Findings
Based on the daily IPO returns, the study found that the IPOs outperform the markets on the first trading day (listing gain). The average stock return on the first trading day were 52%, ranging from -23.15% to 82.16% with standard deviation of 26.72%. For the similar 1st trading day, Index return on average remains -0.0%, while it ranges from -20.31% to 6.25% with standard deviation of 3.72%.
It was found that the IPOs offered the highest returns on the third trading day. The average returns were 14.52%, ranging from -22% to 117.55% with standard deviation of 18.57%. For the similar 3rd trading day, Index return on average is 0.09% and it ranges from -28.56% to 8.26% with standard deviation of 4.90%.
The research found that there was a small fall in the IPO returns after the third trading day. At the end of the month, the IPO returns was slightly lesser compared to the returns on the listing day.
It is found that the market adjusted short run performance starts falling from the 3rd trading day. This indicated that the returns of the IPO in comparison to the market returns is slowly decreasing, which is due to the decrease in the abnormal returns. From the ‘t’ test, it is found that the market adjusted short run performance is significant.
The wealth model signified that the IPOs have performed better than market during the first month from listing.
It is found that the abnormal returns are highest on the first trading day. The cumulative abnormal returns have been subsequently falling. At the end of the month, the cumulative abnormal returns are approximately equal to zero
It is found that the critical value of ‘t’ at 95% confidence level is 2.009. It is observed that the calculated ‘t’ value for mean abnormal return is greater that the critical value for the first day only. Therefore, only the first day Mean Abnormal Return are significant.
The T statistic of the mean cumulative abnormal returns is greater than the critical T Value for the first 19 trading days. Therefore, only the first 19 days Mean Cumulative Abnormal Returns are significant.
From the results of the regression analysis, it is found that only over subscription impacts the IPO performance. For 1 unit increase in the over subscription causes 0.102 unit increase in the IPO returns. The other factors namely, issue price, Profit after Tax, market returns and promoters holdings do not influence IPO returns.
Conclusion
From the study we can conclude that an initial public offering is a great opportunity for investors to earn good profits in the short run. The investors also use this as a speculative opportunity and sell off their shares on the listing day. The abnormal returns are also highest on the listing day after which the gradually decrease. One of the major factors an investor should consider while applying for an IPO is the over subscription as it has a significant impact on the performance of the IPO.
Scope for Further Studies
The scope for further research:
This study is focused on the short run performance of IPOs. A study can be conducted on the performance of IPOs in the long run and the factors that influence the long run
A study can be conducted to understand the factors which influence the customers to invest in an IPO and the various factors that are considered while evaluating the IPO.
Madan, A. (2003). Investments in ipos in the indian capital market. Bimaquest, 24–34. Retrieved from https://www.academia.edu/3311699/ Investments_in_IPOs_in_the_Indian_Capital_Markets
Chiraphadhanakul, V., & Gunawardana, K. D. (2005). The Factors Affecting on IPO Return in Thai Stock Market. SSRN Electronic Journal, 19.1-19.6. https://doi.org/10.2139/ssrn.2932633
Datar, V., & Mao, D. Z. (2006). Deep underpricing of China’s IPOs: sources and implications. International Journal of Financial Services Management, 345–362. https://doi.org/10.1504/ijfsm.2006.009635
Pande, Alok and Vaidyanathan, Ramamurthy, Determinants of IPO Underpricing in the National Stock Exchange of India (2007). ICFAI Journal of Applied Finance, Forthcoming, Available at SSRN: https://ssrn.com/abstract=1081272
Sehgal, S., & Singh, B. (2008). Determinants of Initial and Long-Run Performance of IPOs in Indian Stock Market. Asia Pacific Business Review, 4(4), 24–37. https://doi.org/10.1177/097324700800400403
Sahoo, S., & Rajib, P. (2010). After Market Pricing Performance of Initial Public Offerings (IPOs): Indian IPO Market 2002–2006. Vikalpa: The Journal for Decision Makers, 35(4), 27–44. https://doi.org/10.1177/0256090920100403
Ahmad-Zaluki, N. A., & Kect, L. B. (2012). The investment performance of mesdaq market initial public offerings(IPOs). Asian academy of management journalof accounting and finance, 1–23. Retrieved from http://web.usm.my/journal/aamjaf/vol%208-1-2012/8-1-1.pdf
Bansal, R., & Khanna, A. (2012). Determinants of IPOs Initial Return: Extreme Analysis of Indian Market. Journal of Financial Risk Management, 01(04), 68–74. https://doi.org/10.4236/jfrm.2012.14012
Bagga, A., Khurana, S., & Singh, I. P. (2012). Study of IPO wealth creators or destroyers: An Indian perspective. International Conference on Technology and Business Management, 261-267.
Jotwani, D., & Singh, S. (2012). What Factors Drive IPO Prices: An Empirical Study of Alternative Factors
Ganesamoorthy, L., & Shankar, H. (2013). The performance of initial public offerings based on their size: An empirical analysis of the indian scenario. IUP Journal of Applied Finance, 19(4), 84-99. Retrieved from https://lavasalibrary.remotexs.in/scholarly-journals/performance-initial-public-offerings-based-on/docview/1468899135/se-2?accountid=38885
Bateni, L., & Asghari, F. (2014). Study of Factors Affecting the Initial Public Offering (IPO) Price of the Shares on the Tehran Stock Exchange. Research in World Economy, 5(2), 21–35. https://doi.org/10.5430/rwe.v5n2p68
Shah, S., & Harshadbhai Mehta, D. (2015). Initial Performances of IPOs in India: Evidence from 2010-14. SSRN Electronic Journal, 77–86. https://doi.org/10.2139/ssrn.2708995
Reddy, K. S. (2015). The aftermarket pricing performance of initial public offers: Insights from india. International Journal of Commerce and Management, 25(1), 84-107. doi:http://dx.doi.org/10.1108/IJCoMA-03-2013-0032
Jampala, R. C., Lakshmi, P. A., & Dokku, S. R. (2016). A Study on Factors Influencing the Initial Public Offerings (IPO) in the Bombay Stock Exchange (BSE), India. International Journal of Corporate Finance and Accounting, 3(1), 22–35. https://doi.org/10.4018/ijcfa.2016010102
Poornima, S., & Haji, A. (2016). A study on the performance of initial public offering of companies listed in nse, india & gulf base gcc index. International Journal of Research in Finance and Marketing (IJRFM), 31–47. Retrieved from http://euroasiapub.org/current.php?title=IJRFM
Ambily (2016).A study on Performance of Ipo’s under NSE from issue price to last trading price in the year 2013-2015, Global Journal of Finance and Management. ISSN 0975-6477 Volume 8(1) pp. 43-48
A (2016).Study on Initial Performance of IPO’s in india during 2015-16 Comparison of Book Building and Fixed Price Mechanism, International Journal of Science technology and Management, ISSN 2394-1537, Vol 5(5),Pp 81-88.
Bhanu Murthy, ,K.V., Singh, A. K., & Gupta, L. (2016). Long-run performance of IPO market in india. International Journal of Financial Management, 6(1), 17-27. Retrieved from https://lavasalibrary.remotexs.in/scholarly-journals /long-run-performance-ipo-market-india/docview/1772607064/se-2?accountid=38885
Dhamija, S., & Arora, R. K. (2017). Determinants of long-run performance of initial public offerings: Evidence from india. Vision, 21(1), 35-45. doi:http://dx.doi.org/10.1177/0972262916681243
Suri, A. K., & Hada, B. (2018). Performance analysis of initial public offerings in india. BVIMSR’s Journal of Management Research, 10(1), 126-134. Retrieved from https://lavasalibrary.remotexs.in/ scholarly-journals/performance-analysis-initial-public-offerings/docview/2038182922/se-2?accountid=38885