Poznan University of Life Sciences, Poznan, Poland
Volume 2021,
Article ID 479868,
Journal of Financial Studies and Research,
26 pages,
DOI: 10.5171/2021.479868
Received date: 3 September 2020; Accepted date: 22 February 2021; Published date: 8 June 2021
Academic Editor: Marta Nowak
Cite this Article as:
Agnieszka PIECHOCKA-KALUZNA (2021)," Measuring The Quality of Financial Statements After the Conversion To IFRS, Case of Poland", Journal of Financial Studies & Research, Vol. 2021 (2021), Article ID 479868, DOI: 10.5171/2021.479868
Financial reporting around the world tends toward harmonization. The output of this process is increasing the number of countries that decided to transfer their accounting framework into IFRS. This paper encompasses the study on how the conversion to IFRS has affected the quality of financial statements in Poland. The quality of financial statements was measured as the level of the potential earning management performed by entities which changed their accounting framework from Polish local GAAP to IFRS. To examine it, one has applied well-recognized research methodologies as well as a new approach based on XGboost (eXtreme Gradient Boosting). The paper includes an investigation referred to financial statements of the companies quoted on the Warsaw Stock Exchange (Poland) for the years 2004-2019.
Keywords: quality of financial statements, earning management, International Financial Reporting Standards (IFRS)
Introduction
Every well designed and well composed system requires certain frameworks in order to achieve its goals set. As Maciucia et al. (2015) mentioned, within an accounting system, such conceptual frameworks ought to ensure some kind of triumph of good accounting practices over bad ones. Such triumph, in turn, is necessary to release appropriate financial reports of entities, that is, reports of high quality that reflect their real financial situations and genuine results.
Since 2005, every company whose shares are quoted on the European Union (EU) regulated market must prepare its financial statements (on group level) under the International Financial Reporting Standards (IFRS), as endorsed by the EU Commission. According to Ho (2011), the IFRSs are built on a framework that provides an economic foundation for establishing accounting standards based on consistent concepts, rather than a collection of arbitrary accounting conventions such as conservatism, historical cost accounting, prudence, and matching.
The idea of international accounting convergence seems to be highly desirable by many academicals, regulators and capital markets participants (Alexander and Jermakowicz, 2006). Moreover, most of these people point at IFRS as a set of regulatory frameworks that would best match their expectations, especially those related to the quality of financial reporting. The reason why an IFRS set aspires to become the basis for future benchmark in accounting quality is that it has already been widely adopted around the world. In fact, as Ho (2016) observed, there are over 100 countries that require or permit IFRS while preparing the financial statements of entities.
It seems that the widespread adoption of a common, international set of standards will increase the transparency and comparability of financial reporting between regions, countries and corporations and will minimize global stakeholders’ apprehension. According to Rogdaki et al. (2011), the international mandatory application of IFRS is a practical demonstration of the latest effort to ensure quality information.
Having realized that many companies have changed their accounting environment and transferred their financial statements to meet the IFRS standards, it is worth using quality measurement to show whether the financial statements will be of higher quality after implementing the new (IFRS) standards in comparison with those prepared under the previous legal regime.
Review of literature on the quality of financial accounting
The measures applied in this paper refer to recognized models described in acknowledged literature on the quality of financial statements during the transformation to IFRS. These measures concentrate on one of the key areas potentially exposed to the risk of distortion, namely earning management. According to the theoretical expectations, high-quality financial statements should not bear any signs of earning management – neither earning smoothing nor tendencies towards achieving small positive results rather than losses.
In many recognized studies, such as those conducted by Barth et al. (2008), Chritensen et al. (2015) or Lang et al. (2006), earning management distortion was divided into two classes. First, it is a tendency for managers to smooth earning. In fact, direct measurement of smoothing is rather difficult to detect. Therefore, the studies should derive on indirect evidence. It is assumed that better quality standards will lead to higher earnings volatility. Since accruals are often used to smooth companies’ earnings, it is also worth analyzing the relationship between changes in the level of accruals and changes in operating earnings or changes in operating cash flows.
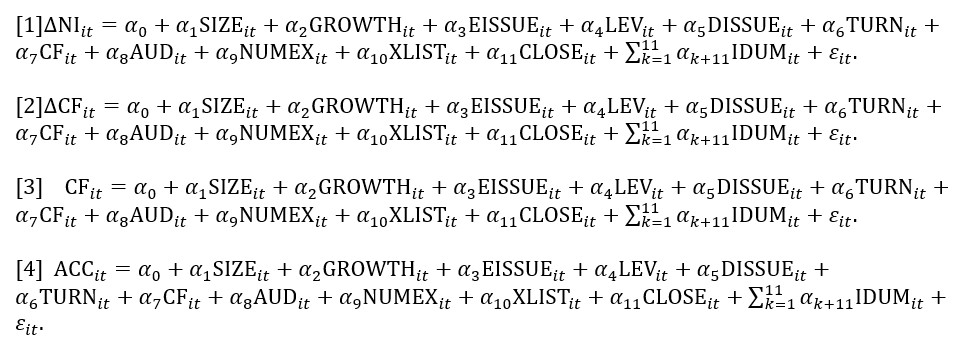
Another manifestation of earning management is management toward small positive net income rather than negative result (net loss). If there is room for some discretion in preparing the financial statements and a company is going to report relatively low loss, then there is a higher probability that management will use discretionary accruals to obtain even small but positive final result. Thereby, the application of high-quality accounting standards (IFRS) should result in reporting small positive earnings with lower frequency than when employing local domestic (worse) accounting standards. Of course, the definition of such ‘small’ income or ‘small’ loss is extremely subjective, but most recognized studies, like Burgstahler and Dichev (1997), assume that ‘small’ refers to results giving return on assets (ROA) ratio in a range from -0.01 to 0.00 for net loss and from 0.00 to 0.01 for net income. According to Barth et al. (2008) and Christensen et al. (2015), the most appropriate models for the measurement of the smoothing of financial statements would be the following ones:
where ΔNI is the change in the net income, scaled by end-of-year total assets, ΔCF is the change in the annual cash flow from operations, scaled by end-of-year total assets, ACC is the earnings less cash flow from operations, scaled by end-of-year total assets, CF is the annual net cash flow from operating activities, scaled by end-of-year total assets, SIZE is the natural logarithm of the market value of equity at the end of the year, GROWTH is the percentage change in sales, EISSUE is an indicator that equals one if the company issued equity, LEV is the end-of-year total liabilities divided by the end-of-year book value of equity, DISSUE is the percentage change in total liabilities, TURN is the sales divided by the end-of-year total assets, AUD is an indicator variable that equals one if the company’s auditor is BIG4 (which means PwC, KPMG, E&Y or Deloitte), and zero otherwise, NUMEX is the number of exchanges on which a company’s stock is listed, XLIST is an indicator variable that equals one if the company is listed on any US stock exchange, CLOSE is the percentage of closely held shares of the company reported by WorldScope, and IDUM are industry dummies.
A smaller variance of the change in the net income in model [1], change in the cash flow from operations in model [2], change in the cash flow from operations, scaled end-of-year total assets in model [3] and change in the earnings less cash flow from operations, scaled by end-of-year total assets in model [4] will be treated as an evidence of profit smoothing.
According to the study of Sun et al. (2011), profit smoothing may also be detected using the analysis of absolute value of discretionary accruals:
where ADAC is the absolute value of discretionary accruals, XLIST is an indicator variable coded 1 for cross-listed companies and 0 for matched US companies, POST is an indicator variable coded 1 for cross-listed companies in post-IFRS periods and 0 in pre- IFRS observations; for matched US companies, POST has the same value as the cross-listed company it is matched to, SIZE is the company’s size, measured as the log of market value of common equity, GROWTH is the company’s growth, measured as the annual percentage change in sales, EISSUE is an increase in equity, measured as the annual percentage change in common equity, LEV is leverage, measured as the ratio of total liabilities to common equity, DISSUE is an increase in debt, measured as the annual percentage change in total liabilities, TURN is turnover, measured as the ratio of sales to total assets, and CFO is the cash flow from operations, measured as the cash flow from operations deflated by total assets. The key for the analysis of potential smoothing under different accounting regulations (pre- and post-implementation of IFRS) is factor b3, which represents incremental change in ADAC for cross-listed companies in the post-IFRS period relative to cross-listed companies in the pre-IFRS period.
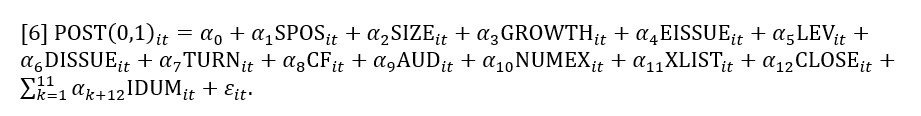
Earning management may also lead to the targeting of the level of earnings. To calculate that type of measurement of earnings management, the following model [6] can also be used.
where POST (0,1) is an indicator variable that equals one for observations in the post-adoption period and zero otherwise, while SPOS is an indicator variable that equals one for observations where the net income scaled by total assets is between 0 and 0.01. A negative coefficient on SPOS, as Christensen et al. (2015) mentioned, suggests that companies manage earnings less towards a small positive target in the post-adoption period.
The last facet of potential earning management refers to earnings persistence, which according to Dechow et al. (2010), is important because more persistent earnings can result in better inputs to equity valuation models and to higher equity market valuations. Following Sun et al.’s (2011), model [7] can be used to appraise persistence:
where Et is earnings before extraordinary items for year t, deflated by beginning-of-period market value of common equity. B7 is the most interesting factor because it represents incremental effect on persistence for cross-listed companies in the post-IFRS period. It means that if IFRS lead to more persistent or higher-quality earnings, one should expect b7 to be positive. Alternatively, b7 could be positive if the decrease in persistence was less for IFRS than for the matched sample group.
Methodology and Sample Description
This paper examines a case study based on entities listed on the Warsaw Stock Exchange that transferred the framework of their financial statements (from the Polish Accounting Act to the International Financial Reporting Standards). To evaluate if that kind of transformation led to preparing financial statements of higher quality, the measures which are recognized as the most appropriate in assessing the value and quality of financial statements were applied. This paper is the natural continuation and refinement of the comparative research conducted by Piechocka-Kaluzna (2018) and Piechocka-Kaluzna (2019) on companies that prepared their financial statements under IFRS and local accounting regulations presented on separate samples in 2019.
A novelty in relation to the approach used in the literature is the use of the XGBoost method, which is discussed later in this section. In addition, various types of modifications were applied (which had not been seen before in the world literature), such as the use of a model with fixed effects instead of an unobservable effect model for panel data. Such a step was taken because the procedure used so far in the literature gave uninterpretable results.
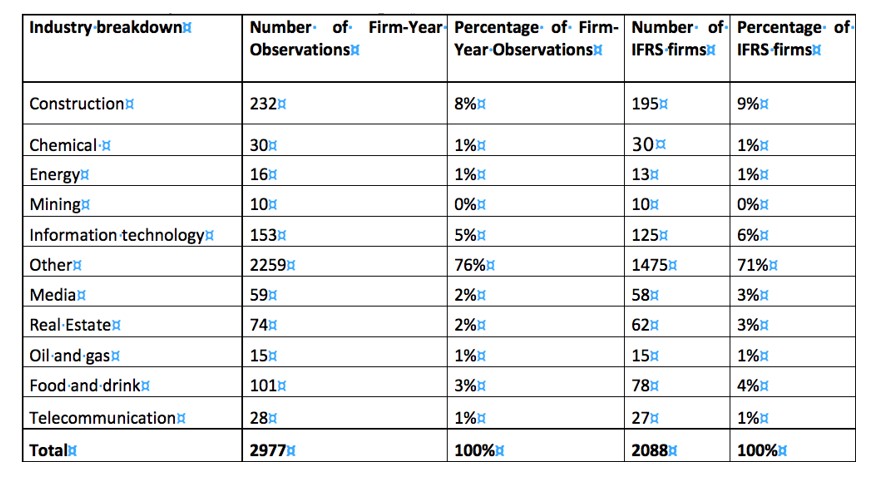
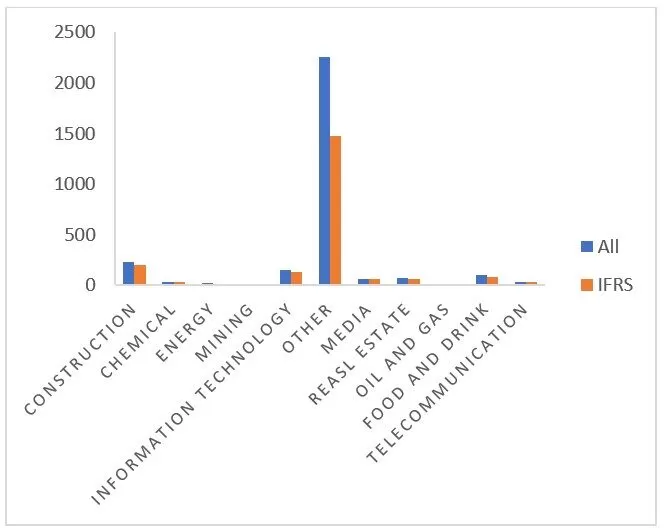
The sample consists of 2977 firm-year observations of Polish-based companies quoted on the Warsaw Stock Exchange – WSE (Poland) between 2004 and 2019. This study used year-end standalone financial statements, auditors’ opinions, and share quotations that come from the Notoria base. Additionally, data of the above-mentioned companies, obtained from a court register, were analyzed. For each of these companies, the author of this paper checked the accounting standards applied to the annual reports and designed a sample of ‘switch companies’– companies that transferred their accounting framework from the Polish Accounting Rules (PAR) to the International Financial Reporting Standards (IFRS). These were all transfers to IFRS during the years 2004-2019 on the WSE that referred solely to standalone financial statements. The sample excluded group financial statements. Table 1 and chart 1 present industry breakdown and year breakdown of the sample.
Table 1: Industry breakdown of the sample
Fig. 1: Industry breakdown of the sample
In accordance with the well-recognized studies of Ball et al. (2003), Ball and Shivakumar (2005), Basu (1997) and Barth et al. (2008), the outliers were removed using the following empirical criteria for the variables:
GROWTH > -100 or GROWTH < 100,
LEV < 100 or LEV > -100,
DISSUE < 100 or DISSUE > -100,
BVPS < 100 or BVPS > -100,
EPS < 100 or EPS > -100,
ΔNI < 100 or ΔNI > -100,
ΔCF < 100 or ΔCF > -100,
ADAC < 2.000.000.
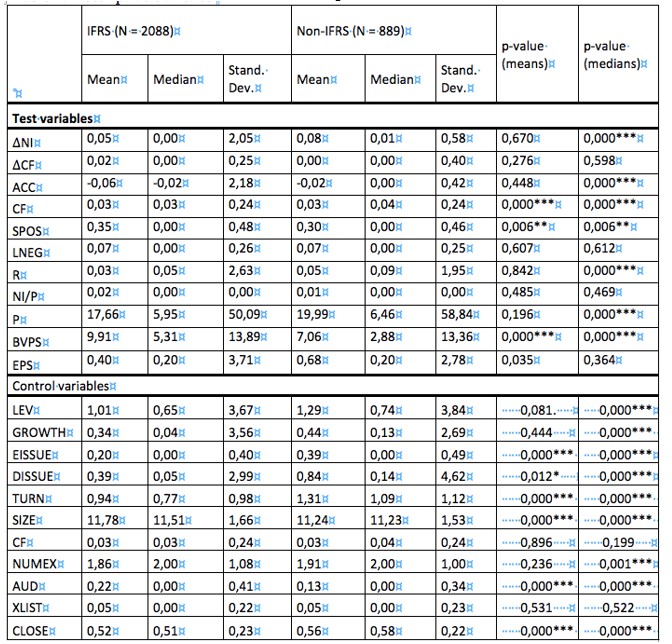
Table 2 presents descriptive statistics on all the variables chosen for the analysis of accounting quality of the ‘switch companies’. All of the test variables and control variables were defined in a manner most similar to the corresponding formulas described in models [1]-[7], except the IDUM control variable for which (following the WSE methodology) industries were divided based on sub-indices:
WIG-budownictwo – for construction industry,
WIG-chemia for chemical industry,
WIG-energia for energy,
WIG-górnictwo for mining,
WIG-informatyka for information technology,
WIG-media for media,
WIG-paliwa for oil and gas industry,
WIG-spożywczy for food and drink industry,
WIG-nieruchomosci for real estate industry,
WIG-telekomunikacja for telecoms,
Others for industries not included in any of the above sub-indices.
The significance of the means was calculated using the t-test (two-sided tests) and the significance for the medians was calculated using the Wilcox test (two-sided tests). The following are of material significance:
ACC, SPOS, LNEG, P, DISSUE, XLIST for means significance of 1‰,
ΔNI, EISSUE and CLOSE for means significance of 1%,
CF and TURN for means significance of 5%,
ΔNI, ΔCF, ACC, CF, SPOS, LNEG, P, LEV, EISSUE, DISSUE, AUD, XLIST for medians significance of 1‰,
TURN for medians significance of 5%.
Table 2: Descriptive statistics
where ‘***’ means significance of 1‰ for p-value, ‘**’ means significance of 1% for p-value, ‘*’ means significance of 5% for p-value and ‘.’ means significance of 10% for p-value.
Each of the models applied was estimated twofold, first, for companies before transformation into IFRS (which was referred to as -pre); and second, for the same companies but for periods after transferring into IFRS (which was referred to as -post).
For each of the 7 models used for measuring quality, there are estimated regressions with results (presented in tables) which depict the significance of particular variables on a given significance level (‘***’ for 1‰, ‘‘**’ for 1%, ‘*’ for 5% or ‘.’ for 10% significance). If there is no asterix or dot, it means that the variable data was statistically insignificant in explaining the control variable.
Additionally, for measuring the significance of particular features, the XGboost (eXtreme Gradient Boosting) method was applied, as described by Chen et al. (2016). This method refers to regression tree learning, characterized by Breiman et al. (1984) and is widely used for classification, regression and ranking issues. Its undisputable advantage is the possibility of measuring the importance of the features (variables) used in the model. The importance is calculated separately for each tree as an improvement in the quality of the division in the tree and then it is weighted by the number of observations in nodes. Subsequently, it is averaged over all trees and scaled so that the most important feature has a measure of importance of 100. During model construction, 1000 regression trees were used for each model considered. The results are presented using graphs. If there is no such drawing for some models, it means that the tree with only one division was optimal and only one feature is important according to this criterion.
Results
Models [1]–[5] were applied to study earning smoothing within the sample.
Tables 3 and 4 and charts 2 and 3 present results for model [1], which assesses earning management for companies before (-pre) and after (-post) the transfer into IFRS.
Applying the fixed effect panel model [1], the following parameters were received:
n = 145, T = 1-12 and N = 388 (where n is the number of companies in the model, T means the number of years and N is the number of observations) for -pre companies,
n = 205, T = 1-14 and N = 1223 for -post companies.
Table 3: Panel regression for model [1] – pre-transformation
The significant features for model [1] for companies in the years before the transfer to IFRS are the following variables:
DISSUE, CF and CLOSE at 1‰ significance level,
SIZE at 1% significance level,
Food and drink at 5% significance level.
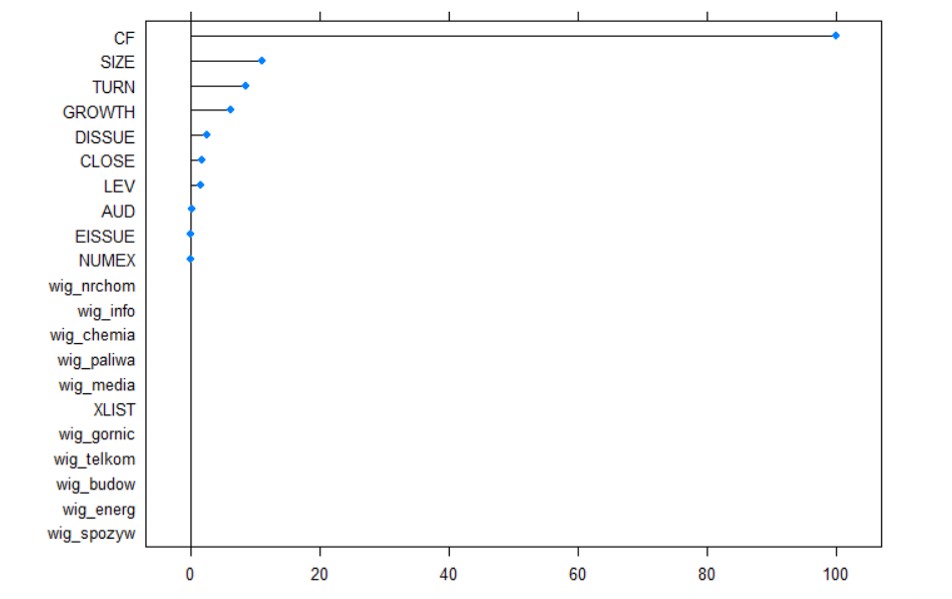
Fig. 2: Importance of features for model [1] – pre-transformation.
A ranking of importance, estimated using the XGboost method, indicates that the most important variables are CF, GROWTH, DISSUE and LEV, which is partially consistent with the panel regression results for the same model.
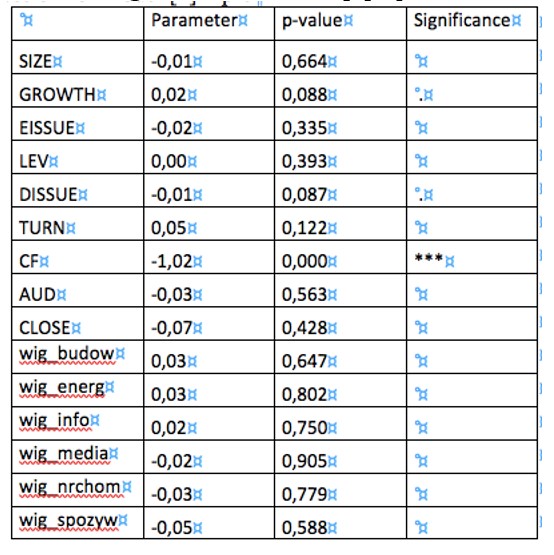
Table 4: Panel regression for model [1] – post-transformation
The following variables were significant for model [1] in the years after the application of IFRS:
CF at 1‰ significance level,
SIZE at 1% significance level,
TURN at 5% significance level.
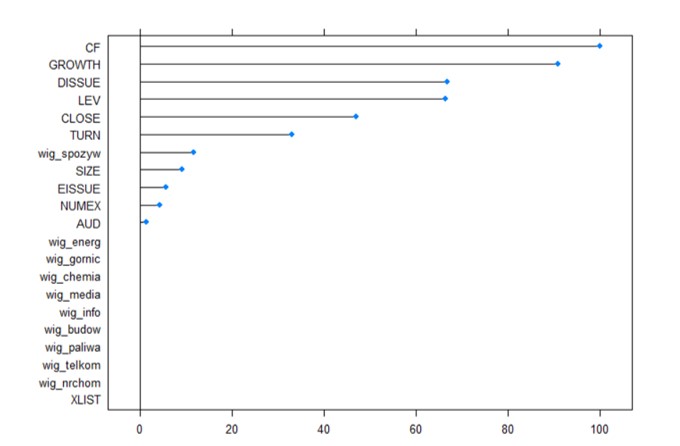
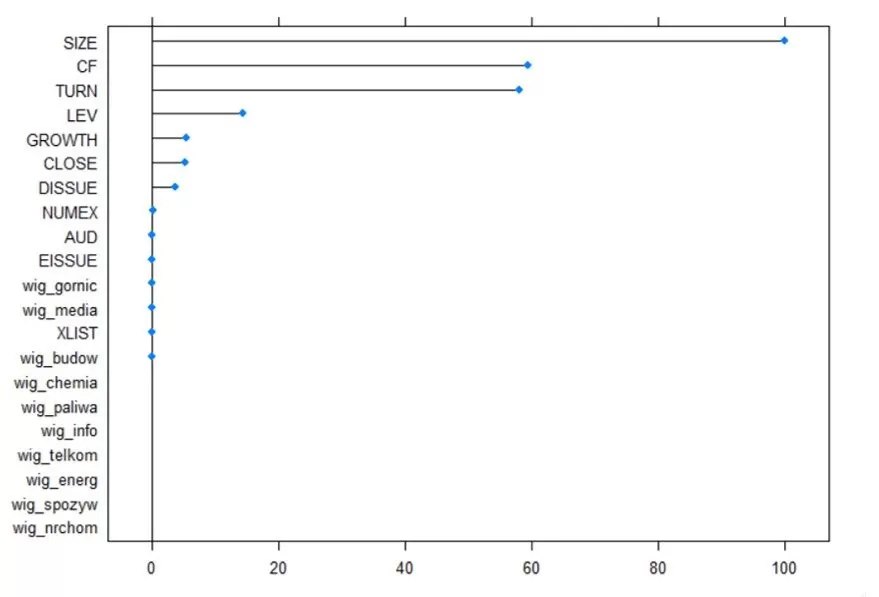
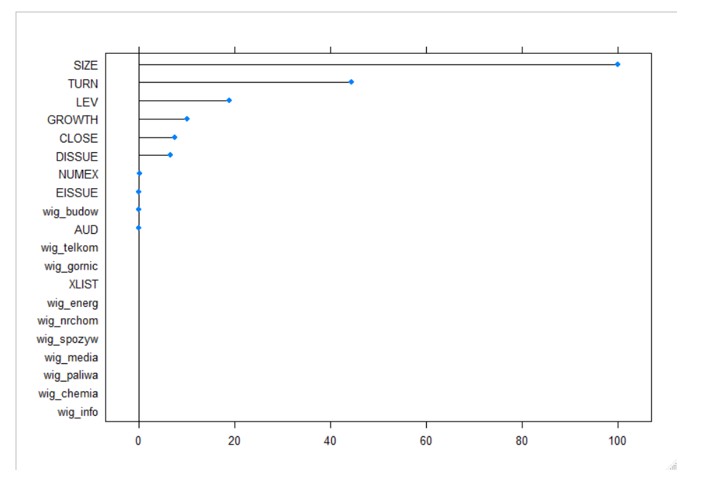
Fig. 3: Importance of features for model [1] – post-transformation.
A ranking of importance, estimated using the XGboost method, indicates that SIZE is the most important feature, which is generally consistent with the outcomes of the panel regression.
Tables 5 and 6 present results for the fixed effect panel model [2], where, following Christensen et al.’s (2015) approach, ΔCF is the change in year cash flows from operations scaled to net assets.
The following parameters were received:
n = 145, T = 1-12 and N = 388 for pre-transformation companies,
n = 205, T = 1-14 and N = 1223 for post-transformation companies.
Charts 4 and 5 show the importance of features calculated with the use of the XGboost method.
Table 5: Panel regression for model [2] – pre-transformation
In model [2], for years before the transfer to IFRS, variable CF is significant at 1‰ level and variables GROWTH and DISSUE are significant at 10% level.
Fig. 4: Importance of features for model [2] – pre-transformation
A ranking of importance, estimated using the XGboost method, indicates that CF is the most important feature in model [2] – pre-transformation, which is the same result as in the panel regression.
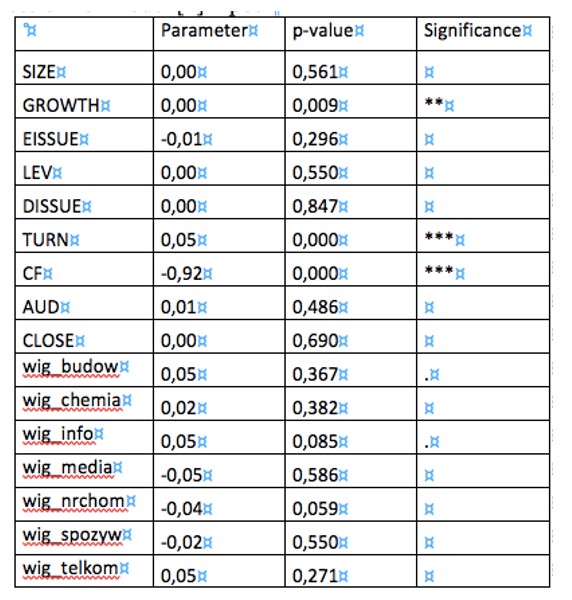
Table 6: Panel regression for model [2] – post-transformation
In model [2], for years after the transfer to IFRS, the significant variables are:
CF and TURN at 1‰ significance level,
GROWTH t 1% significance level,
Variables construction and information technology at 10% significance level.
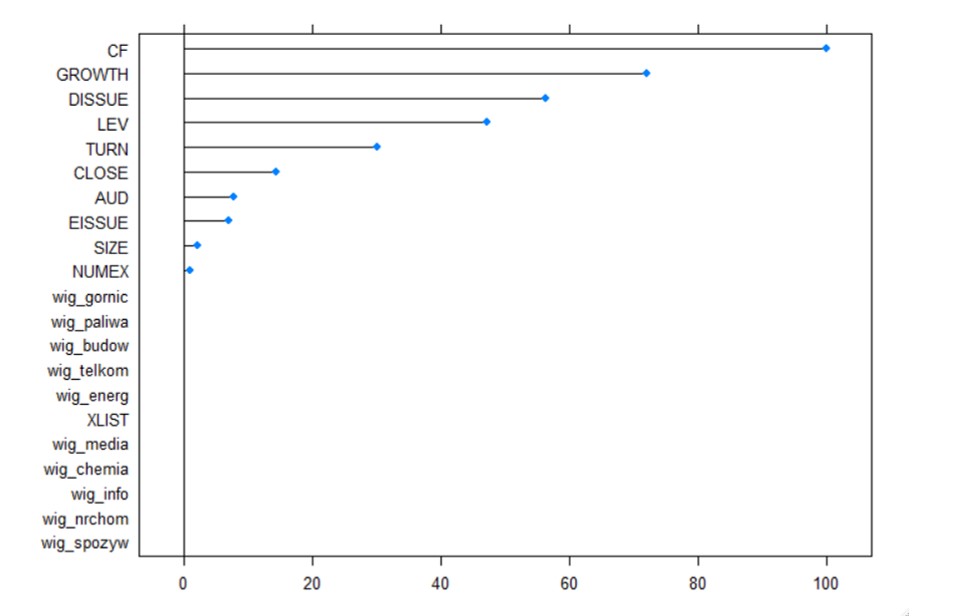
Fig. 5: Importance of features for model [2] – post-transformation
A ranking of importance, estimated using the XGboost method, indicates that CF is the most important feature in model [2] -post-transformation, which is partially consistent with the results of the panel regression.
In model [3], the control variable CF, just like in formula [2], means year cash flows from operations scaled to net assets in the beginning of the year.
Tables 7 and 8 present results for the fixed effect panel model [3] with the following parameters:
n = 145, T = 1-12 and N = 388 for pre-transformation companies,
n = 205, T = 1-14 and N = 1223 for post-transformation companies.
Charts 6 and 7 show the importance of features calculated with the use of the XGboost method.
Table 7: Panel regression for model [3] – pre-transformation
According to Table 13, only the TURN variable is statistically significant at 5%.
Fig. 6: Importance of features for model [3] – pre-transformation
A ranking of importance, estimated using the XGboost method, indicates that the most important variable is GROWTH, which gave a different result in comparison to the panel regression.
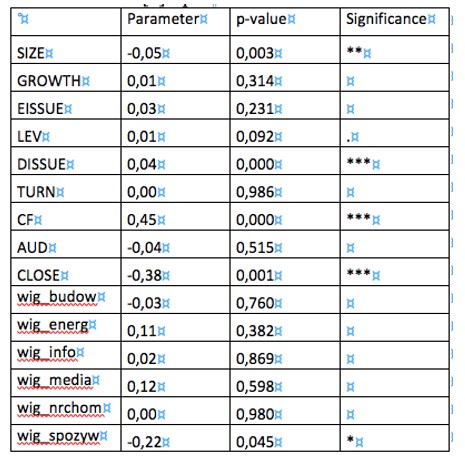
Table 8: Panel regression for model [3] – post-transformation
For model [3] – post-transformation, variables SIZE and LEV are significant at 5% level and variable CLOSE is at 10% level of significance.
Fig. 7: Importance of features for model [3] – post-transformation
A ranking of importance, estimated using the XGboost method, indicates that the SIZE and LEV variables are the most important, which is partially compatible to the panel regression.
Applying model [4], ACC were treated as accruals scaled to total assets as in the balance sheet date.
Tables 9 and10 present results for the fixed effect panel model [4] with the following parameters:
n = 145, T = 1-12 and N = 388 for pre-transformation companies,
n = 205, T = 1-14 and N = 1223 for post-transformation companies.
Charts 8 and 9 show the importance of features calculated with the use of the XGboost method.
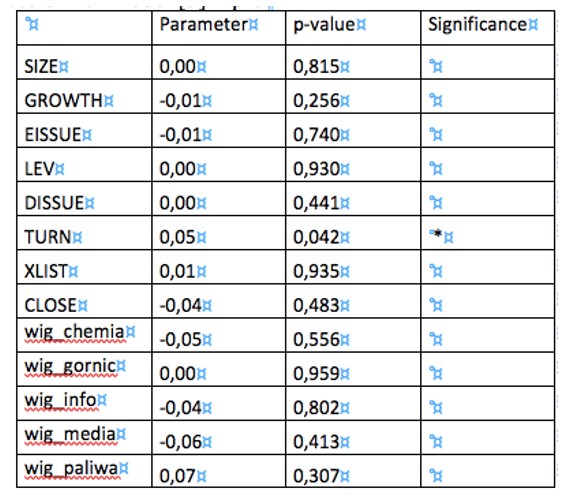
Table 9: Panel regression for model [4] – pre-transformation.For model [4], for the years before the transfer to IFRS, only variables SIZE and DISSUE are significant at 10% level of significance.
Fig. 8: Importance of features for model [4] – pre-transformation
A ranking of importance, estimated using the XGboost method, indicates that the most important variable is GROWTH, which is not consistent with the panel regression for the same model.
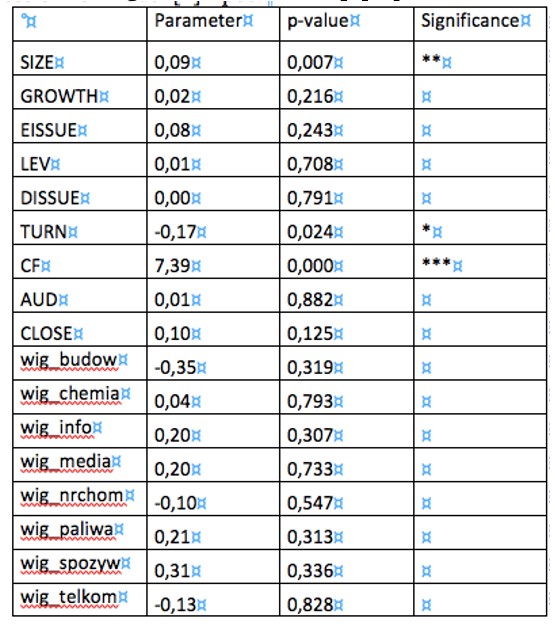
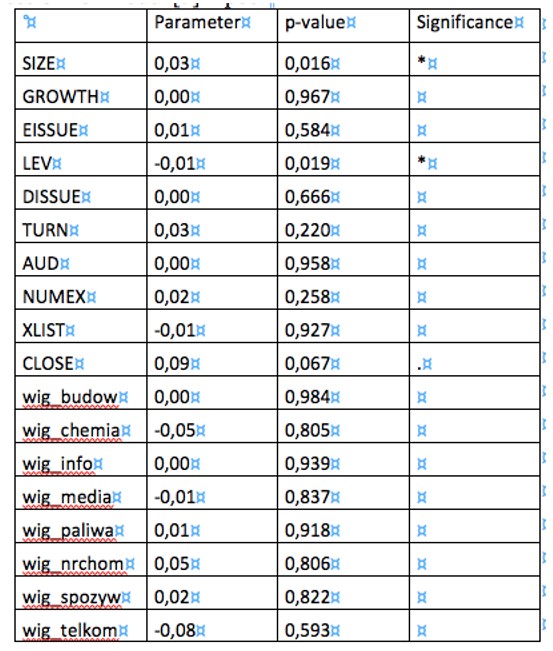
Table 10: Panel regression for model [4] – post-transformation.
The significant variables in the panel regression for model [4] -post-transformation are SIZE at 1% level of significance, SIZE at 5% level of significance and chemical at 10% level of significance.
Fig. 9: Importance of features for model [4] – post-transformation
A ranking of importance for model [4] -post-transformation, estimated using the XGboost method, indicates that the most important variable is SIZE, which partially gave the same result in comparison to the panel regression.
The results of model [5], which is difference-in-difference regression, analyzed by Bertrand et al. (2004), the ADAC control variable, means the absolute value of all the accruals.
Table 11 presents the results obtained for model [5].
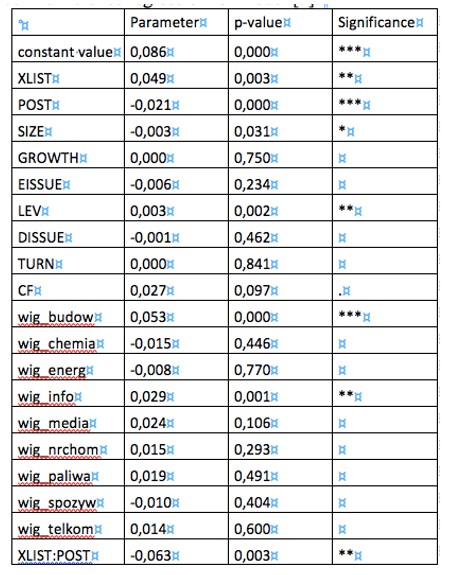
Table 11: Difference-in-difference regression for model [5].
According to model [5], the following variables are significant:
constant value, POST, construction at 1‰ significance level,
XLIST, LEV, information technology and XLIST: POST at 1% significance level,
SIZE at 5% significance level,
CF at 10% significance level.
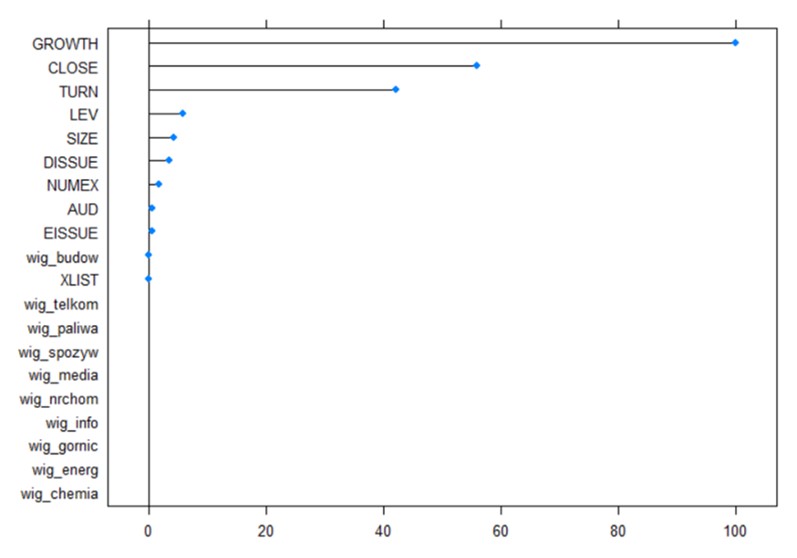
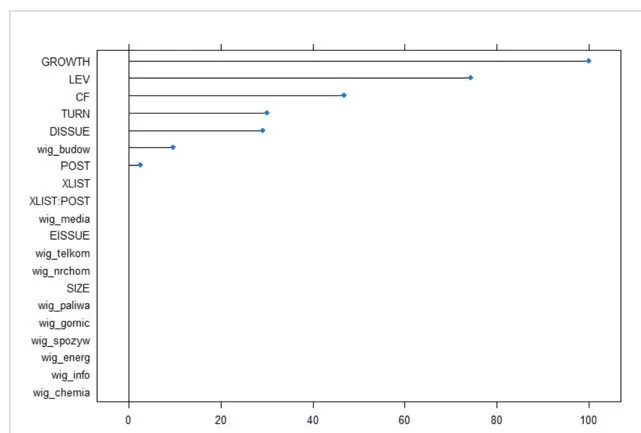
Fig. 10: Importance of features for model [5].
A ranking of importance for model [5], estimated using the XGboost method, indicates that the most important variables are GROWTH, LEV, CF and TURN, which is not consistent with the results of difference-in-difference regression.
Model [6] is a logistic regression for panel data described by Chan et al. (2015). It was applied to estimate the potential earning management toward target profit.
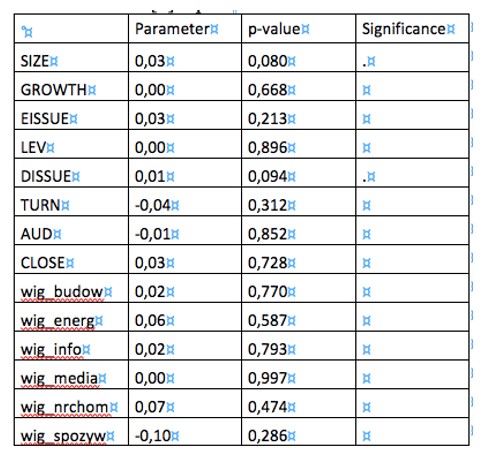
According to Table12, which presents the results for this model (where n = 221, T = 1 – 15 and N = 1611), the following variables are significant:
SIZE, TURN, NUMEX, CLOSE, construction and information technology at 1‰ significance level,
DISSUE and mining at 5% significance level,
XLIST and chemical at 10% significance level.
Table 12: Logistic regression for model [6]
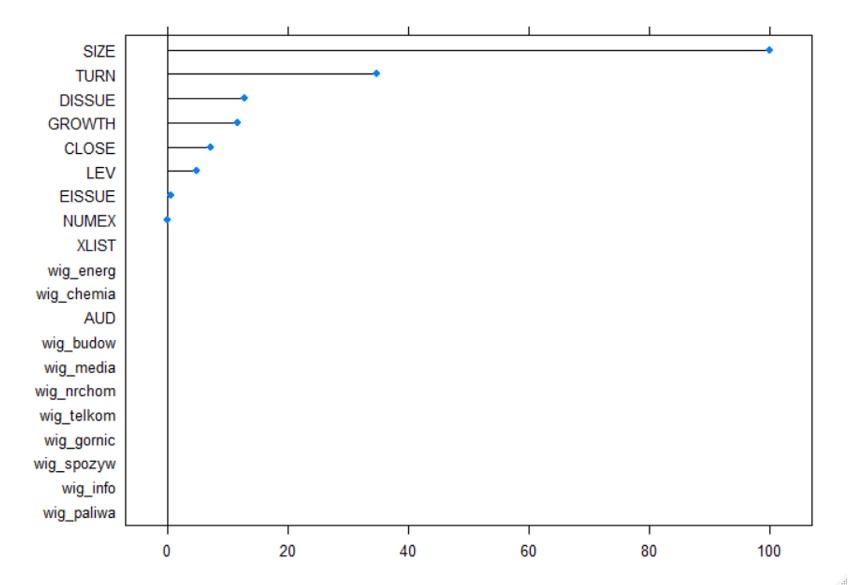
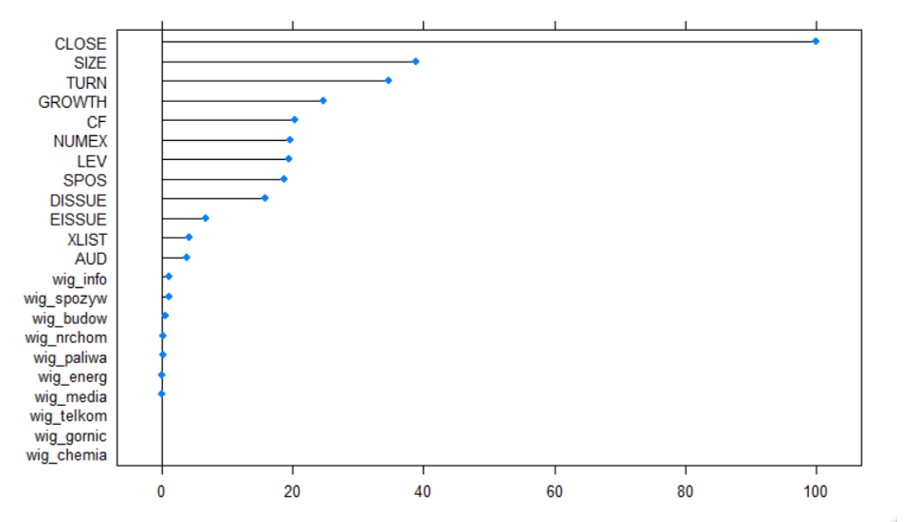
Fig. 11: Importance of features for model [6]
A ranking of importance for model [6], estimated using the XGboost method, indicates that the most important variable is CLOSE, which is practically consistent with the logistic regression model.
Model [7], applied to evaluate earnings persistence, resulted in a fixed effect panel model, where n = 229, T = 2 – 15 and N = 2829.
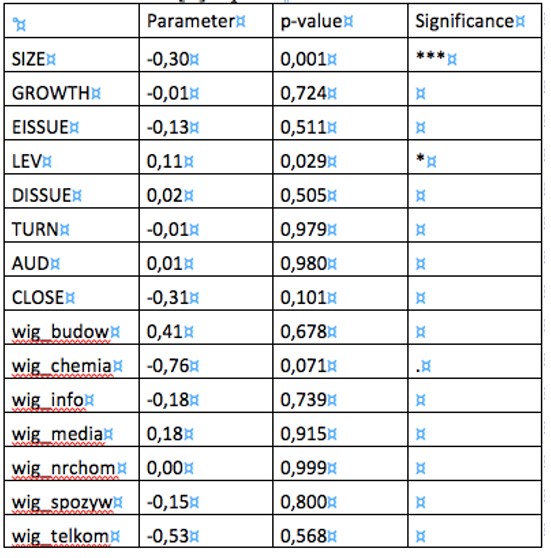
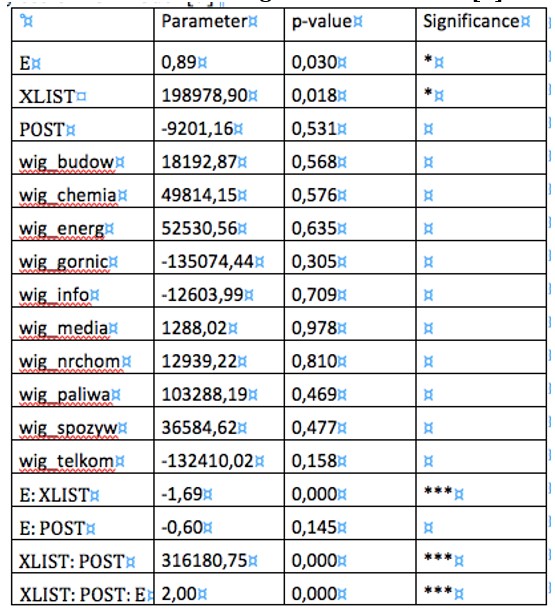
Table 13: Panel regression for model [7]
As can be seen, according to Table 13, the significant variables in model [7] are E:XLIST, XLIST:POST and XLIST:POST:E at 1‰ significance level and E and XLIST at 5%.
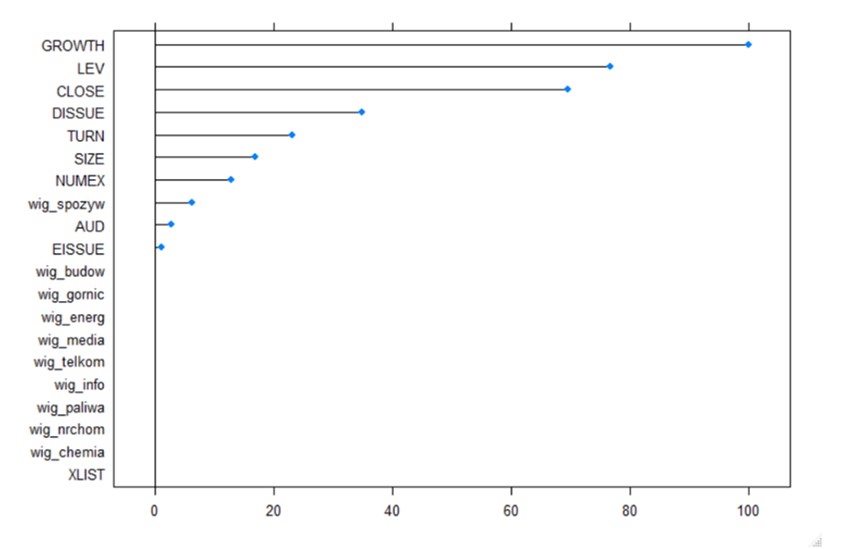
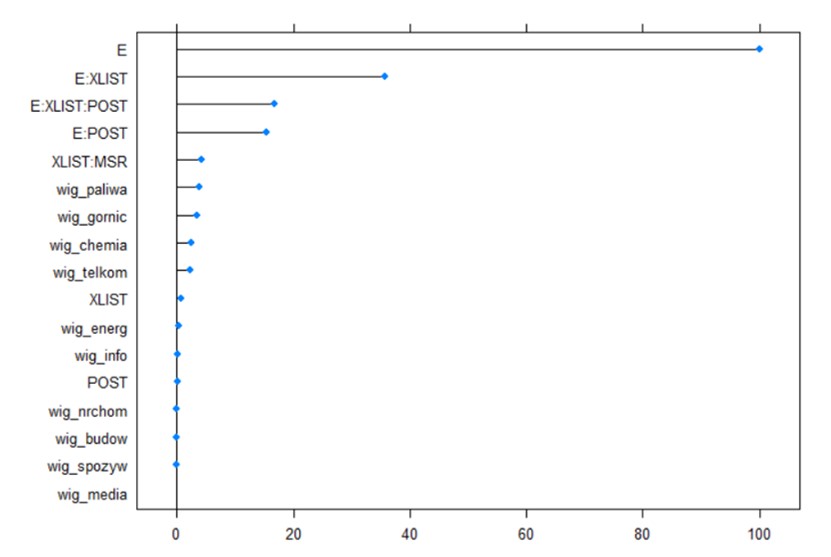
Fig. 12: Importance of features for model [7].
A ranking of importance for model [7], estimated using the XGboost method, indicates that only control data E explains its changes and none of the variable data is important.
Conclusions
The final results of increasing the accounting quality for companies after the transfer to IFRS are presented in Table 14. The volatility of the control data was calculated as the variance of the examined variable. An asterix (‘*’) means that it was based on residuals instead of raw data. Thanks to estimating models [3] and [4], it is possible to calculate the Spearman’s coefficient between cash flows from operations and accruals. According to the accepted approach, the Spearman’s coefficient level is interpreted as:
Weak correlation if it ranges from 0.00 to 0.29,
Moderate correlation if it ranges from 0.30 to 0.49,
Substantial correlation if it ranges from 0.50 to 0.69,
Strong correlation if it ranges from 0.70 to 0.89,
Very strong correlation if it is higher than 0.90.
According to recognized studies, such as the one conducted by Barth et al. (2008), it is much more appropriate to examine the residuals of the models than the absolute value of CF and ACC. To test the equality of two variations (variances), the F-test was used. When testing other differences, the bootstrap test was used. It consists in drawing (with return) a sample of companies with the same number as the whole sample. For each such sample, the size of interest was determined and compared with the observed one. The whole procedure was repeated 1000 times. The percentage, greater than the observed value, shall be recognized as p-value. The match factor reported in the Table is an improved match factor that can serve as a measure of quality of the model if the number of explanatory variables is greater than 1. It informs us how many percent of the changes in the explanatory variable are due to changes in the explanatory variables.
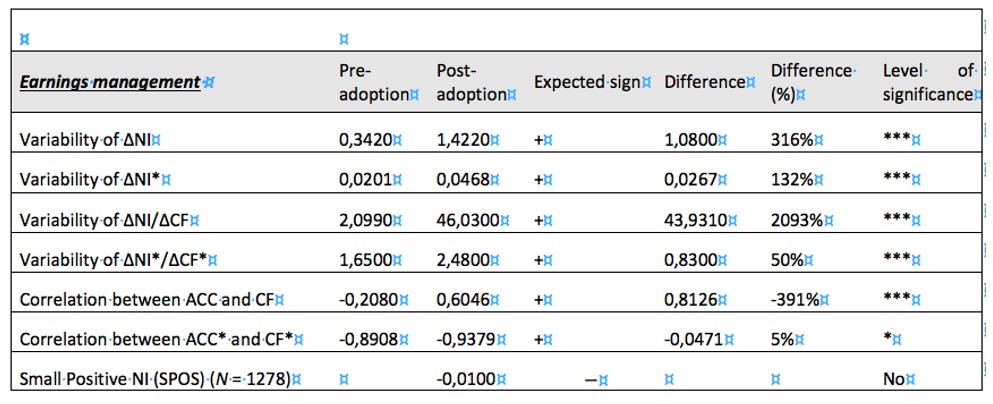
Table 14: Accounting quality of financial statements
Table 14 presents the outcomes of the comparison of accounting quality in the period before (pre-) and after (post-) the transfer to IFRS in Poland, based on 804 observations for pre- transfer and 1802 for post-transfer. The variability of earnings (ΔNI) increases significantly in post-adoption periods, which is consistent with the expected decrease in earning management. According to Christensen, the change in the variability of earnings could also be driven by a natural change of scope or nature of activity (which is also accompanied by a change in cash flows from operations), rather than merely by a positive effect of the implemented regulations. However, an analysis of the variability of earnings, relative to cash flows from operations (∆NI/∆CF), proves that it is not the case. Studies, carried out by the author, demonstrate that a positive change in the variability of earnings is a consequence of the implementation of IFRS, because the variability of earnings is higher than the variability of cash flows from operations. Consequently, it strengthens the positive effects of the implementation of IFRS on the quality of financial statements.
The negative correlation between accruals and operating cash flows in the periods before IFRS adoption changed significantly to a positive correlation, which is also argued to reduce earning management after the adoption of international standards while preparing financial statements. All of these changes were significant at 1‰ significance level.
The coefficient on small positive profits for model [6] is slightly below 0. Therefore, the inference about reduced earnings management towards the target profit in periods after the adoption of IFRS is not allowed.
To sum up, it can be said that the analysis of the sample of companies, quoted on the WSE in 2004-2019, which transferred their accounting framework into IFRS is partially consistent with the prior research. In general, within the examined sample, there is a slight trend towards a decrease in earning management. However, some changes observed are not as strong as expected, given the results of previous studies. It is demonstrated that IFRS are better than local Polish regulations (in terms of the quality of financial statements), but the difference was downright symbolic.
Consequently, this may lead to the conclusion that the prior local accounting regime (PAR) was on a fair level. However, consistent with the many caveats to this study, it can be concluded that the adoption of IFRS lead to even higher quality of accounting.
To summarize, the implications mentioned above support the conclusion that contributes to the accounting literature on IFRS in the following ways. First, because no one has done such comprehensive research in the field of accounting in Poland before. The results of the current studies confirm the outcomes of the research conducted by the author in earlier times (Piechocka-Kałużna, 2019) on a broader but more general sample.
Second, the author’s current studies exhibit the quality of financial statements prepared under IFRS in the same entities that had previously used the Polish local GAAP. Even though the current studies are more detailed, targeted and objective than those previously examined by Piechocka-Kałużna (2019) and Piechocka-Kałużna (2014), they still lead to the same conclusions. That, in effect, highlights the thesis that IFRS are rather of better quality.
Third, studies carried out by the author generally prove that the implementation of IFRS as a framework for the preparation of financial statements makes an improvement in accounting quality. Although they resulted in changes in accounting quality between the pre and post adoption periods, the difference is not big. This leads to the conclusion that Polish accounting regulations should be considered as a high-quality set of regulations as well. It likely explains why, for many years, the issue of IFRS implementation in Poland was approached with a distance. On the other hand, it may also justify why after using IFRS in practice, many respondents to the author’s earlier studies decided to change their attitude to IFRS. Like Frost et al. (2009), the author believes that academic research has a great role to play in the debate over the future of IFRS.
Moreover, there is a need to emphasize that accounting quality measures do not capture all the possible benefits from IFRS adoption. Brochet et al. (2013) find capital market benefits following the mandatory adoption of IFRS in the UK, which had previous domestic standards that are considered by Bae et al. (2008) to be very similar to IFRS. According to DeFond et al. (2010) and Wang (2014), the benefits are more likely to arise from changes in accounting comparability than changes in accounting quality.
Finally, a novelty, in relation to the approach used in the previous literature, is also associated with the innovative use of the XGBoost method. In addition, various types of modifications were applied (which had not been seen before in the world literature), such as the use of a model with fixed effects instead of an unobservable effect model for panel data.
There is no doubt that the findings of this study should be of interest for research on financial statements’ quality. This research might serve as a base for future studies on IFRS transfer on other markets. Furthermore, there exist considerable avenues for future research on applying new approaches within the financial reporting area, as XGBoost.
Alexander, D. and Jermakowicz E. (2006), ‘A True and Fair View of the Principles/ Rules Debate,’ABACUS, 42 (2), 132-164.
Bae, K., Tan, H., Welker, M. (2008),‘International GAAP differences: The impact on foreign analysts.’The Accounting Review, 83 (3), 593–628.
Ball, R., Robin A., Wu J.S. (2003), ‘Incentives versus standards: Properties of accounting income in four East Asian countries.’Journal of Accounting and Economics, 36(1-3), 235-270.
R. and Shivakumar L. (2005), ‘Earnings quality in UK private firms: Comparative loss recognition timeliness.’Journal of Accounting and Economics, 39(1), 83-128.
Barth, M.E., Landsman, W.R., Lang, M.H. (2008), ‘International accounting standards and accounting quality.’Journal of Accounting Research, 46(3), 467-498.
Basu, S. (1997), ‘The conservatism principle and the asymmetric timeliness of earnings.’Journal of Accounting and Economics, 24(1), 3-37.
Bertrand, M., Duflo, E., Mullainathan, S. (2004), ‘How much should we trust differences-in-differences estimates?’Quarterly Journal of Economics, 119(1), 249–275.
Breiman, L., Friedman, J.H., Stone, C., Olshen, R. (1984) ‘Classification and Regression Trees.’CRC press.
Brochet, F., Jagolinzer, A., Riedl, E. (2013) ‘Mandatory IFRS adoption and financial statement comparability.’Contemporary Accounting Research, 30(4), 1373–1400.
Burgstahler, D. and Dichev, I. (1997), ‘Earnings management to avoid earnings decreases and losses,’Journal of Accounting and Economics 24 (1), 99-126.
Chan, M., Yu, D., Yau, K. (2015),‘Multilevel cumulative logistic regression model with random effects: Application to British social attitudes panel survey data.’Computational Statistics & Data Analysis, 88, 173-186.
Chen, T. and Guestrin C. (2016), ‘XGBoost: A Scalable Tree Boosting System.’Proceedings of the 22ndSIGKDD Conference on Knowledge Discovery and Data Mining,785–794.
Christensen, H.B., Lee, E., Walker, M., Zeng, C. (2015), ‘Incentives or Standards: What Determines Accounting Quality Changes around IFRS Adoption?’European Accounting Review, 24 (1), 31-61.
Dechow, P., Ge, W., Schrand, C. (2010), ‘Understanding earnings quality: A review of the proxies, their determinants and consequences.’Journal of Accounting and Economics, 50 (2-3), 355.
DeFond, M., Hu, X., Hung, M., Li, S. (2010),‘The impact of mandatory IFRS adoption on foreign mutual fund ownership: The role of comparability.’Journal of Accounting and Economics, 51(3), 240–258.
Frost, C., Henry, E., Lin, S. (2009),‘Response to the U.S. Securities and Exchange’s proposed rule: Roadmap for the Potential Use of Financial Statements Prepared in Accordance with International Financial Reporting Standards by U.S. Issuers.’Journal of International Accounting Research, 8 (2), 61– 85.
Ho, H. (2011)‘A paradigm shift in teaching and learning accounting,’CGA-HK Newsletter, 12, p. 3.
Ho, H. (2016)‘A Case Study of True and Fair View Override in Financial Reporting,’Nang Yan Business Journal, 5 (1),13-19.
Lang, M., Smith Raedy, J., Wilson, W. (2006) ‘Earnings management and cross listing: Are reconciled earnings comparable to US earnings?’Journal of Accounting and Economics, 42 (1-2), 255-283.
Maciuca, G., Hlaciuc, E., Ursache, A. (2015)‘The role of prudence in financial reporting: IFRS versus Directive 34,’Procedia Economics and Finance, 32, 738 – 744.
Piechocka-Kałużna A. (2014) ‘Wykorzystanie metody teorii ugruntowanej w nauce rachunkowości na przykładzie badań nad prawdą w sprawozdawczości finansowej.’Wydawnictwo Uniwersytetu Ekonomicznego w Poznaniu, Poznań.
Piechocka-Kałużna A. (2018)‘The evolution of the importance of the true and fair view (TFV) principle. The case of Poland,’Financial Sciences, 23 (4), 89-101.
Piechocka-Kałużna A. (2019)‘Jakość jako determinanta wiarygodności współczesnej sprawozdawczości finansowej w Polsce.’ Wydawnictwo CeDeWu, Warszawa.
Rogdaki, E., Koutoupis, A., Rodosthenous, M. (2011)‘Ensuring the “True and Fair View Principle” of Banks’ Financial Statements after the Introduction of the Application of IFRS: The Case of Greece,’European Research Studies,14 (3), 19-32.
Sun, J, Cahan, S. F., Emanuel, D. (2011)‘How Would the Mandatory Adoption of IFRS Affect the Earnings Quality of U.S. Firms? Evidence from Cross-Listed Firms in the U.S.’Accounting Horizons, 25 (4), 837–860.
Wang, C., (2014),‘Accounting standards harmonization and financial statement comparability: Evidence from transnational information transfer.’,Journal of Accounting Research, 52(4), 955–992.