2Blekinge Institute of Technology, Blekinge, Sweden
Volume 2021,
Article ID 796491,
Journal of Financial Studies and Research,
8 pages,
DOI: 10.5171/2021.796491
Received date: 13 September 2019; Accepted date: 26 November 2020; Published date: 5 January 2021
Cite this Article as:
Marcin OCIESZAK and Krzysztof WNUK (2021)," Takeovers in Software Business - Recap and Days to Come", Journal of Financial Studies & Research, Vol. 2021 (2021), Article ID 796491, DOI: 10.5171/2021.796491
The article summarizes the last 30 years of the M&A market in the software industry. The authors verify a hypothesis if the takeover strategy is still effective and promising. A dataset of over 18,000 transactions was analyzed. It has been noticed that while company valuations and the S&P 500 index have been increasing over the last decade, the frequency of transactions in the software industry has decreased. One of the few countries that have increased its market share in the last decade was China. Moreover, compared to the dotcom bubble, the number of transactions decreased, while the average deal value increased significantly. Implications and research directions for the software market are also provided in this paper.
Keywords: Software Business, Merges, Acquisitions, Finance, Vision Paper
Introduction
Most innovations nowadays come from software or software-intensive products and services that bring the main innovation outcomes for many companies. An example here may be the S&P 500 index, where software companies are among the top performing companies. These companies have enormous financial resources and the ability to hire top talented people to work for them. Despite that, many innovations happen outside these organizations and many people refuse to work for large firms, pursuing an entrepreneur career. For many successful startups, being acquired by a larger firm is the final goal and exit strategy. This strategy allows the startup owners to cash-out their investment and the acquirer company to obtain an innovation that has proven to be promising for customers and investors. Therefore, many acquirers decided to purchase a company instead of creating a similar product and directly competing on the market.
Mergers and acquisitions play a dominant role in the software industry since its beginning. One of the most significant acquisitions was the purchase of the QDOS operating system for 50.000 dollars that turned into one of the main profit engines for Microsoft. Since then, executives in the software business have understood the importance of keeping track of the potential companies to buy or merging with competitors or collaborators. Still, several examples show that the strategy of mergers and acquisition may not work. Yahoo is one of the prominent examples of software business pioneers that, due to lack of investment, lost a large part of its business.
This paper investigates the last 30 years of mergers and acquisitions in the software industry with a hypothesis to explore if the takeover strategy is still valid and promising and what the implications that can be derived for the software business are. The main findings highlight that the number of deals is decreasing but the average size is increasing. Moreover, it is found out that the frequency of M&A is decreasing despite the growing S&P500 indexes. The possible hypothesis and implications from these observations are discussed.
Related Work
Buxman et al. (2012) claim that the number of mergers and acquisition transactions in the software industry dominated around 49 industries in USA and Europe. This confirms the highly dynamic nature of the software industry with a large number of start-ups and associated later takeovers. Popp (2013) looks into mergers and acquisitions in the software industry mainly from the process and due diligence perspective. He assumes that there is only one target company, there is no competitive offer and it is a friendly acquisition. He details the M&A process, due diligence and handling risks in merger due diligence.
From a financial perspective, researchers explored whether the company’s financial performance has improved after the merger. Some of these studies prove that M&As translate into improved operational efficiency (Martynova & Renneboog, 2008), while others suggest it to be just the opposite (Kruse, et al. 2007 and Ocieszak, 2015), and some do not point to any relationship between the M&A transaction and its financial performance (Ghosh, 2001).
Moreover, financial studies focus on determinants, trying to find out the reason behind the change in the financial performance or the change of the stock price following mergers. It was found that the positive impact is related to, among others, cash as a method of payment (Ghosh, 2001), tender offer as a type of the transaction (Switzer, 1996), domestic transaction (Goergen & Renneboog, 2004 and Schilingemann & Moeller, 2002) or size of the company (Powell & Stark, 2005). But, there is still inconsistency in the literature in the area of plenty of determinants like industry relatedness, changes in the management board, deal’s atmosphere or leverage and cash reserves (Martynova & Renneboog, 2008). Finally, studies suggest that M&A market is connected to the overall financial market behavior expressed as market index (Ocieszak, 2014). In other words, M&A market is growing (both in number of transactions and its total value) when the overall financial market is growing and vice versa. This phenomenon is called merger waves (Harford, 2005).
The merge process is comprehensively described by Popp (2013) and Schief (2013) and aggregated research results. Schief et al. (2013) analyze prior literature on M&A performance in software industry specific cases based on analyzing 41 scientific publications. They outline 32 success drivers of M&A performance and conclude that while the success of targets is positive, the success of acquirers can be debated. Some possible explanations of a negative performance can be related to an aggressive bidding behavior or overestimated network effects. The results of their analysis remain contradicting and inconclusive.
Research Method and Data Collection
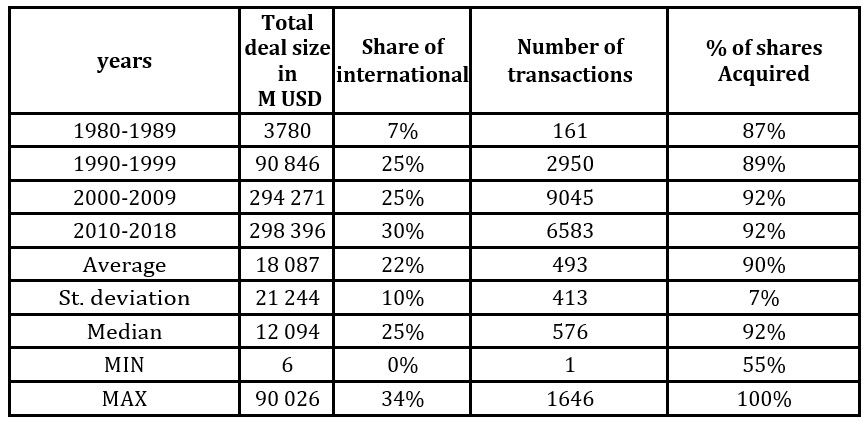
The data sample was gathered from Thomson One Database. It covered M&A transactions between companies assigned to software industry. Deals were completed between 1981 and 2018. The sample was limited to acquirers that were taking over more than 11% of the shares (Almeida, 2016) and ended up with a data set of 18.177 deals. Out of these deals, 6.592 deals have reported the deal size, and this information was used to calculate the average deal size per year. The number of deals and the average deal size in M USD is depicted in Figure 1. A significant increase in the number of deals since the 1980s with almost 10.000 in the 2000s is noticed. Thus, this data was further analyzed to understand if M&A became the dominant growth strategy for the software business.
Table 1: Basic statistics of database
Source: own work
Results
Deal size and frequency
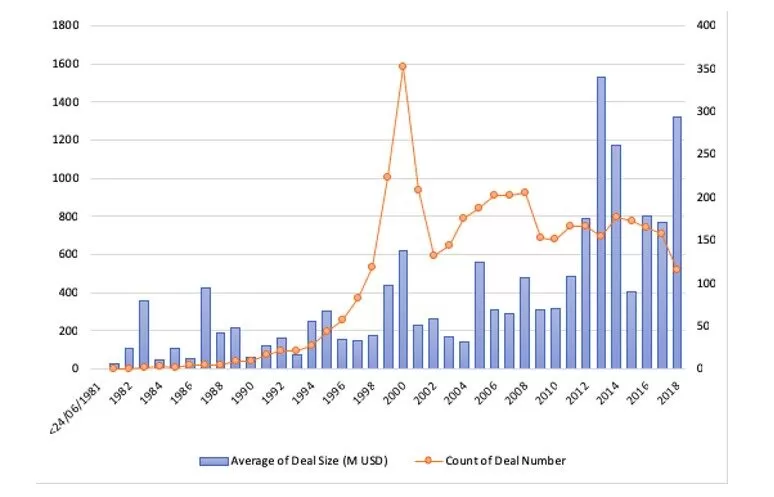
During the 1980s, transactions in the software business were almost not reported. The market experienced, for the first time, over 100 mergers and acquisitions in the year 1992. Thus, 1992 could be a signal of entering maturity and stabilization. After 1992, the number of M&A grew significantly and reached a peak in the year 2000 (1646), falling sharply directly after that. This was correlated with the dot.com bubble and equity market collapse in 2000. The second peak can be observed in 2007 with 949 merges, following a decrease to around 700 mergers and acquisitions in the following years, due to the big financial crisis that started in 2007 (Acharya, 2009). All these movements were strictly connected to the global market condition and correlated to the merger waves noticed in the market (Martynova & Renneboog, 2008).
Fig. 1: The summary of the number of deals between 1981 and 2018 and the average deal size in M USD
Another interesting observation is the inconsistency in the number of deals and the average deal size. Figure 1 indicates that during the fifth merger wave (between 1994 and 2000), the number of deals rapidly increased. The current decade is different. While the number of deals is quite stable or even decreasing, the average price that acquirers pay is the first time seen phenomenon. It is mainly due to the extraordinary transactions that have been seen in the software sector like when Facebook acquired WhatsApp (USD 19, 5 bn), Symantec acquired Veritas Software (USD 11,9bn) or when Microsoft bought Skype Global (USD 9,1bn).
As the last decade has delivered many innovative business models that are heavily based on monetizing user data, the valuation of software companies that managed to gather user data has skyrocketed. The question remains open about how much the software technology, software engineering methods or organizational capabilities contribute to the overall valuation of these companies. The authors of this paper suspect that these aspects play a secondary role and the ability to monetize user data remains the dominant factor.
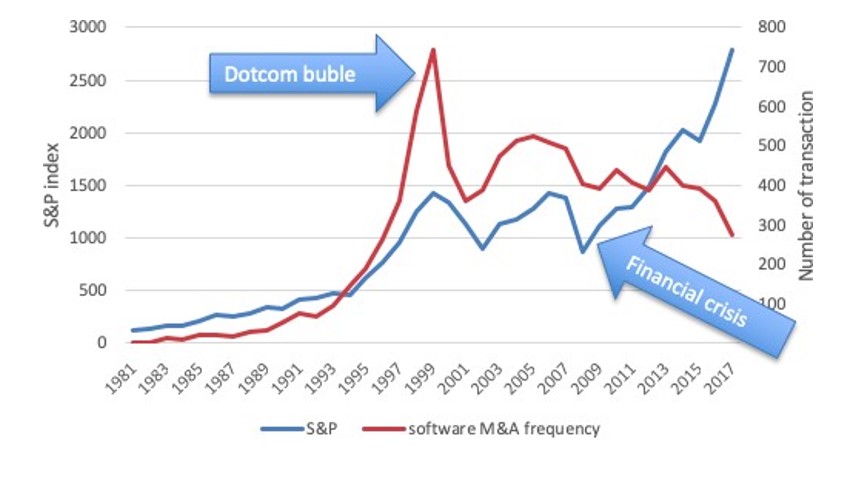
Fig. 2: Frequency of M&A transactions in software industry compared to S&P index
What might be even more interesting is the downward trend in the number of transactions compared to the S&P 500 index that was used as a proxy for the global economy. When the frequency of M&A constantly decreases, the S&P index grows. Such disengagement of the trend started right after the financial crisis between 2007 and 2009 and has never been seen earlier. One possible hypothesis that explains this trend is that software companies attempt to copy the functionality of other companies rather than buying them. Using a strong brand and customer loyalty, these companies may offer competing services (or sometimes very similar) to trigger user migration. This makes the current global software companies even stronger and expands their monopoly position in the market. Since the transaction prices (and valuation) significantly increase, only the rich (large and global) companies can pay the prices and execute the M&A transaction. Another possible implication is that the number of small or medium companies that will grow into global players without being acquired will continue to decrease, also strengthening the monopoly position of the wealthiest companies.
From the other perspective, the results of this paper could imply that many start-ups would have to survive even longer periods and grow their business even more substantially to get an interesting acquisition offer.
Industry Dimension
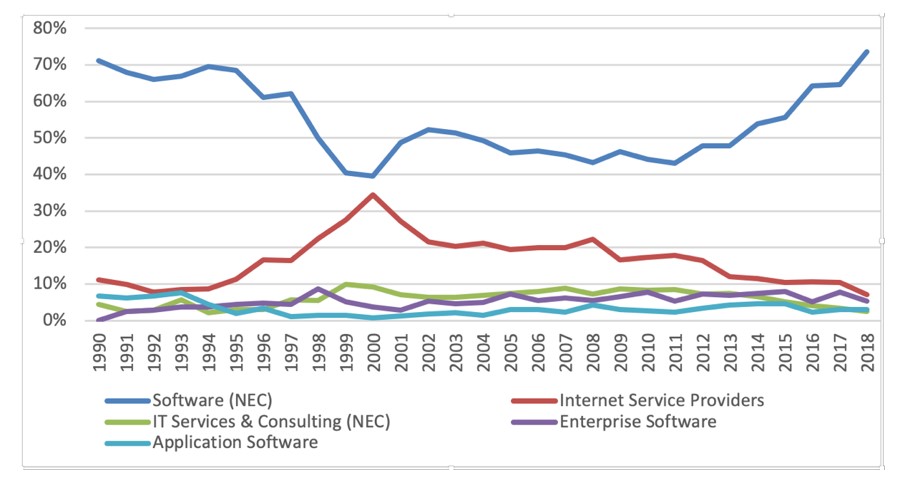
The authors also investigated what sectors of the software industry were the most active since 1990 and if there are any patterns across the last three decades, using the TRBC (Thomson Reuters Business Classification). As can be seen in Figure 3, the most active and dominant sector is Software (NEC) where companies engaged in system developing and marketing, and software application are found. It includes developers of operating systems, word processors, spreadsheet applications, CAD and database engines. The sector maintains its prime position since the beginning of the analysis (or even before it). The dominance was endangered in the year 2000 when its share has decreased at the expense of Internet Service Providers. This trend was expected, since the turn of the century was the peak of the dot.com bubble, driven mainly by internet companies. Despite the described tendencies, other sectors remain with their shares below 10% with no noticeable trend during the analyzed period. It is amazing that such dynamic and novel industry as software remains stable and for almost 30 years, nothing has changed in terms of the areas where it is present.
Fig. 3: Share of top 5 sectors across the 1990-2018
Geographical Dimension
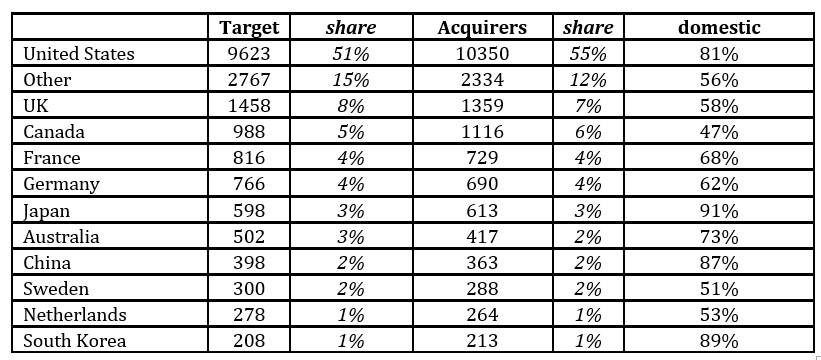
In Table 2, some countries are noticed to be more active as acquirers, but some tend to be treated more like a good opportunity to acquirers. Undoubtedly, the most active acquirers were from The United States. Companies from this country were responsible for 55% of all the acquisitions in the past 40 years. Second in the run was The UK with only 7% share, and the fourth was Canada (6%). 81% of all these US deals were domestic ones, which is one of the highest rates among the examined countries. Probably, thanks to this rate, US companies were also the most frequently acquired (51%). Worth mentioning is that countries that reported less than 200 deals from 1980 (called “Others”) were, as a whole, more interesting as a target company. These are smaller countries, very often considered as developing. No wonder they were considered as an interesting target entity. On the other angle are countries that more often acquire than being acquired. These were USA, Canada and Japan.
Table 2: Deal frequencies among targets and acquirers broken down by country
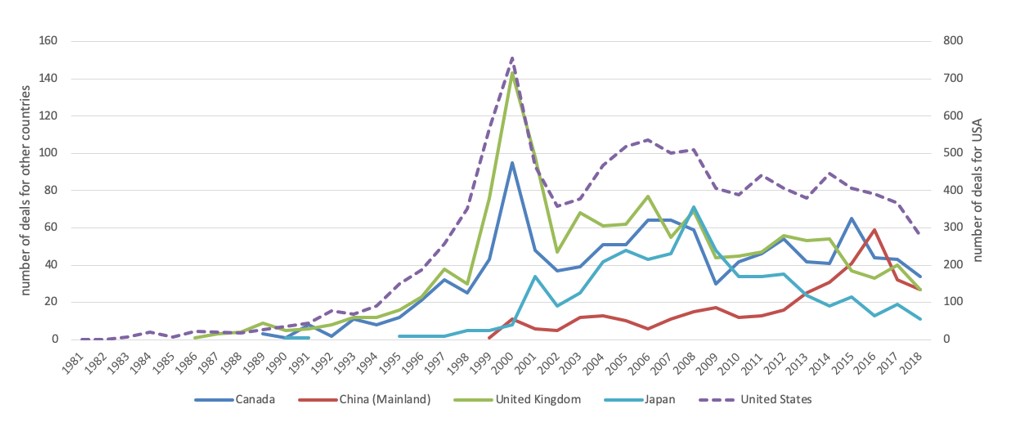
Figure 4 presents the activity of the selected countries on the M&A market from the beginning of the database availability. The US dominated the market and to compare its activity to the rest of the world, the number of transactions for that country was placed on the secondary axis. The trend previously described in Fig 1 and Fig 2 is visible. The market during the dotcom bubble was characterized by an above-average scale of the phenomenon. After this period, transactions, especially in the USA, UK and Canada, weakened, taking a quite clear downward trend. The other two countries presented in the chart – Japan and China – are interesting. Japan was virtually absent from the M&A software market during the dotcom bubble. The number of transactions was very small compared to the tiers of this market. After this period, however, a significant use took place and during the pre-financial crisis, Japan became a major player (48 transactions) surpassing even the UK (44 transactions). After the crisis, the number of transactions fell back and in 2018, holding the 11th place, this country was placed at the end of the stake. On the other hand is China that is getting the momentum. Despite the years 2017 and 2018, the trend is visibly rising.
Fig. 4: Activity of chosen countries on the M&A market in years 1981-2018
Implications and Conclusions
Deciding whether to develop the software in-house or acquire a company is one of the core strategic moves for many software companies and often determines their success or failure. The authors of this paper analyzed M&As in software business since 1981 and attempted to answer a question if the M&A strategy is still beneficial. For the acquired companies, it seems to be profitable since valuations significantly increased in the last years. Some countries are gaining momentum (like China) and increasing their market share, however, the overall frequency of M&As has decreased and so has the probability of being acquired. At the same time, the increasing valuation of
the top software companies allow them to acquire many smaller players and strengthen their monopoly positions. Thus, it remains an open question if the dominant companies should continue to invest in organizational capabilities and internal innovation, or rather utilize the vast amount of available financial resources in innovation by M&As. This question remains relevant especially for software products that can be copied quite easily, e.g. the Angry Birds game has been quickly copied to capture some of the market value created by the original Angry Birds app. Similarly, many open source projects appear as a “mirror” version of the proprietary software (e.g. Open Office) that provides a very similar functionality without license fees.
Another possible explanation of the low M&A activity of large firms is their desire to avoid the sunk costs related to failed intangible investments (Haskel & Wastlake, 2018). By purchasing companies that overcome the early uncertainties of start-up periods (e.g. defining the “friction points”, reaching the “critical mass” of users) (Evans & Schmalensee, 2016), large firms increase the probability of successfully extracting the value from the purchased company.
Finally, the authors project that the probability of emerging a global software company that can successfully compete with the largest software companies, or stand out from them will continue to diminish thanks to the current state of the M&As in the software industry. The question is: Should regulators (or governments) make actions towards extended anti-monopoly policies in the software business?
Acharya, V.,Philippon T., Richardson, M. and Roubini, N. (2009) ‘The financial crisis of 2007-2009: Causes and remedies’,Financial Markets,Institutions & Instruments, 18(2):89–137.
Almeida, L. (2016), How to measure corporate control? evidence from panel threshold effectsofthedegreeofcontrolonceopaymonitoring.Workingpaper,Conservatoire National des Arts etMtiers.,
Evans, D. S., &Schmalensee, R. (2016). Matchmakers: The new economics of multisided platforms. Harvard Business Review Press.
Ghosh, A.(2001) ‘Does operating performance really improve following corporate acquisitions?,’Journal of Corporate Finance, 7(2):151 – 178.
Goergen, M.andRenneboog L. (2004),‘ShareholderwealtheffectsofEuropeandomestic and cross-border takeover bids,’European FinancialManagement,10(1):9–45.6.TimothyA.Kruse,HunY.
Harford, J. (2005)‘What drives merger waves?, Journal of Financial Economics,’77(3) 529-560,
Haskel, J., & Westlake, S. (2018). Capitalism without capital: The rise of the intangible economy. Princeton University Press.
Kruse, TA., Park, HY.,Park, K.andSuzuki, K.,(2007) ‘LongtermperformancefollowingmergersofJapanesecompanies:Theeffectofdiversification and affiliation,’Pacific-Basin Finance Journal, 15(2):154 – 172.
Martynova,M., and Renneboog L., A century of corporate takeovers: What have we learned and where do we stand? Journal of BankingFinance, 32(10):2148– 2177, 2008.
Ocieszak, M, (2014), ProcesykonsolidacyjnewPolsce, ichdeterminantyizwiazkiztendencjamiswiatowymi (M&A Transactions in Poland, Their Determinants and Associations with Global Trends) (April 24, 2014). Zeszyty Naukowe Uniwersytetu Szczecinskiego, No. 803.
Ocieszak, M. (2015). Skutki finansowe fuzji i przejęć w Polsce w latach 2003–2009 oceniane na podstawie danych księgowych. Zeszyty Naukowe Uniwersytetu Szczecińskiego. Finanse, Rynki Finansowe, Ubezpieczenia, 73, 559-569.
Popp, K.M.,(2013) Mergers and acquisitions in the software industry : foundations of due diligence. Books on Demand,
Powell R.G.and Stark, A.W., (2005), Does perating performance increase post- takeoverforuktakeovers?A comparisonofperformancemeasuresandbenchmarks. Journal of Corporate Finance, 11(1):293 – 317.
Schief, (2013), Business Models in the Software Industry: The Impact on Firm and M&APerformance.SpringerLink:Bu¨cher.SpringerFachmedienWiesbaden.
Schief, P.,Buxman, M and Schiereck D.,(2013), Mergers and acquisitions in the software industry research – results in the area of success determinants. Business Information Systems Engineering, 5(6):421–431,2013.
Schlingemann, F., and Moeller, S., (2002) Are cross-border acquisitions different from domestic acquisitions? Evidence on stock and operating performance for u.s. acquirers. SSRN Electronic Journal, 01.
J.A.,(1996) Evidence on real gains in corporate acquisitions. Journal of Economics and Business, 48(5):443 – 460.