The Bucharest University of Economic Studies, Bucharest, Romania
Volume 2022,
Article ID 121344,
Journal of Financial Studies and Research,
13 pages,
DOI: 10.5171/2022.121344
Received date: 23 September 2020; Accepted date: 25 November 2022; Published date: 21 February 2022
Academic Editor: Ilea Marioara
Cite this Article as:
Andreea MURARU and Cristina BEJENARU (2022)," How Global is the Domestic Financial Cycle? Evidence from Romania and 3 other EEMS", Journal of Financial Studies & Research, Vol. 2022 (2022), Article ID 121344, DOI: 10.5171/2022.121344
This paper provides an analysis of the potential common influences behind the synchronicity of financial cycles in four EEMS: Romania, Hungary, Poland and the Czech Republic. We checked if the common movements in these EEMS appear under the influence of the global financial cycle measured in terms of quantities – through capital flows – risk premiums and global risk aversion for investors. According to results, there is a strong correlation between yields, equity prices, house prices, credit and global capital flows, and a weaker one in terms of risk premiums (represented by the CDS) and the risk aversion (measured by the VIX index) which is a measure traditionally correlated with the global financial cycle.
Keywords: financial cycle; global financial cycle; capital flows, factor analysis, co-movement.
Introduction
Over the past few decades, the domestic financial cycles have become more and more synchronized, making way for a stream of literature that investigates the common movement of financial cycles and their connection with the global financial cycle (Rey, 2015). Aldasaro (2020) analyze the main features of the global and domestic financial cycles, the interaction between them and their relationship with output fluctuations and finds that while there are some important similarities, the two cycles are also quite distinct in terms of interactions with business cycle: the global financial cycle has a stronger tie with the traditional short-term output fluctuations, whereas the domestic one has a greater impact on the medium-term swings and thus on economic activity. Moreover, while the two financial cycles are not highly synchronized most of the time, they do come together around financial crises, given the power of the global cycle to charge the domestic one. The conclusions arising from the literature proved that the effects of the global financial cycle are more intense and visible lately and have a major impact over domestic financial cycles.
In this paper, we are taking into consideration the most used variables for the study of financial cycles such as: bond yields, equity prices, house prices and credit data, for 4 emerging markets, Romania, Poland, Czech Republic and Hungary, and we analyzed their common movement. The main objective is to identify how the global financial cycle (measured in quantity terms as in Borio, 2019, Habib and Venditti, 2019), investors’ global risk aversion (measured by the VIX index), and risk premium (measured by the CDS – credit default swap) affect in the evolution of the analyzed domestic financial cycles.
Our key results show that there is a high cross-country synchronization among all above mentioned variables, especially between equity prices and bond yields; therefore, we have built common cycles for the 4 countries for all our variables. We also wanted to see how each of the financial indicators responds to the global financial cycle in all 4 economies, so we did not use a single measure of the financial cycle. Our results indicate that the major impact on the dynamics of the common movement in the domestic financial cycles is arising from the capital flow measure of the global financial cycle, followed by the risk premium (especially for equity prices) and lastly from the VIX. Concerning VIX, we observed a smaller influence compared with the rest of the variables, in line with conclusions of Borio (2019) who demonstrated that high correlation between the VIX index and the asset measure of the financial cycle has declined lately.
We find the literature on financial cycles for the emerging economies limited, so our study aims to enrich it by evaluating the importance of global factors in the common movement of the domestic financial cycles. Most studies on synchronicity and co-movement generally address advanced economies for which the data samples are generous. The short data series available for emerging economies represent a limitation and a challenge, as we try to extract as much information as possible from the available data.
The paper has the following structure: the first part reviews the literature on the subject, the second part presents the data and methodology, and the last part discusses the results of our analyses. The paper ends with concluding remarks and appendix.
Literature Review
As countries’ economies have become increasingly integrated, financial cycles have become the subject of various research studies. Rey (2015) observed that the global financial cycle generates fluctuations in financial activity on a global scale being characterized by the co-movements of risky asset prices, leverage of financial intermediaries, credit growth and gross capital flows around the world. Additionally, Rey identified the Feds’ monetary policy as a driver of the global financial cycle. According to Rey, there are interrelations with the monetary conditions of the center country (the US), capital flows and the leverage of the financial sector in many economies. Another important idea, that is arising from Rey study, is that an independent monetary policy can be performed “if and only if the capital account is managed directly or indirectly via macroprudential policies ”.
The studies have approached global financial cycle from several points of view. One of them is the global asset-based cycle and the propagation of US financial conditions to the worlds’ economies by showing that US monetary policy shocks induce co-movements in the international financial variables belonging to the global financial cycle (Miranda-Agrippino and Rey, 2020a, Miranda-Agrippino and Rey, 2020b; Dées and Gales, 2019). Other aspects of these research studies treat capital flows as variable of global financial cycle pointing out the importance of global factors in driving international capital flows in general and cross-border bank flow in particular (Avdjiev and Hale, 2018). A strong correlation was observed between world gross flows and gross flows of different countries (Davis et. al, 2019), as well as a relation between the global and the domestic cycle (Aldasoro et al., 2020, Borio, 2019).
Concerning the synchronicity among cycles, there are in-depth studies in the literature that analyze the correlation between financial and business cycles (Rünstler and Vlekke, 2016), synchronization and co-movement of real and financial cycleswithin countries- especially in the EU countries (Comunale, 2017), (WGEM Team, 2018), cross-country co-movements of different measures of financial cycles – synchronization in cycles in credit, house prices, equity prices and interest rates between six euro area countries (Kunovac et al., 2018).
A problem of major importance in investigating financial cycles is how to measure them. If we study the dedicated literature, we notice that the most frequently used methods are the turning points analysis (e.g., Claessens, Kose and Terrones, 2011; Drehmann et al. 2012; Hubrich et al., 2013; Stremmel, 2015) or band pass filter (e.g., Aikman, Haldane and Nelson, 2015; Drehmann et al., 2012; Meller and Metiu,2017). Other methods have also been used, as the multi-level factor model (Breitung and Eickmeier, 2016), synchronicity index (Comunale, 2017), multivariate structural model (Rünstler and Vlekke, 2016), principal component analysis, similarity and wavelet coherence (WGEM Team, 2018; Kunovac et al., 2018).
After the global financial crisis, the concept of the financial cycle has generated a major interest for policy makers as well as for researchers, since it is started to be seen as a potential source of macroeconomic and financial instability. Thereby, understanding the financial cycle, its causes and implications, became vital for macroprudential policy: for example, Basel III regulations connect counter-cyclical capital buffers to the credit gap (the deviation of Credit/GDP from its long-run trend) (Drehmann and Tsatsaronis, 2014), although the effectiveness of macroprudential policy tools depends on the state of the financial cycle (Cerutti, Claessens and Laeven, 2017).
Data and Methodology
Data and sources
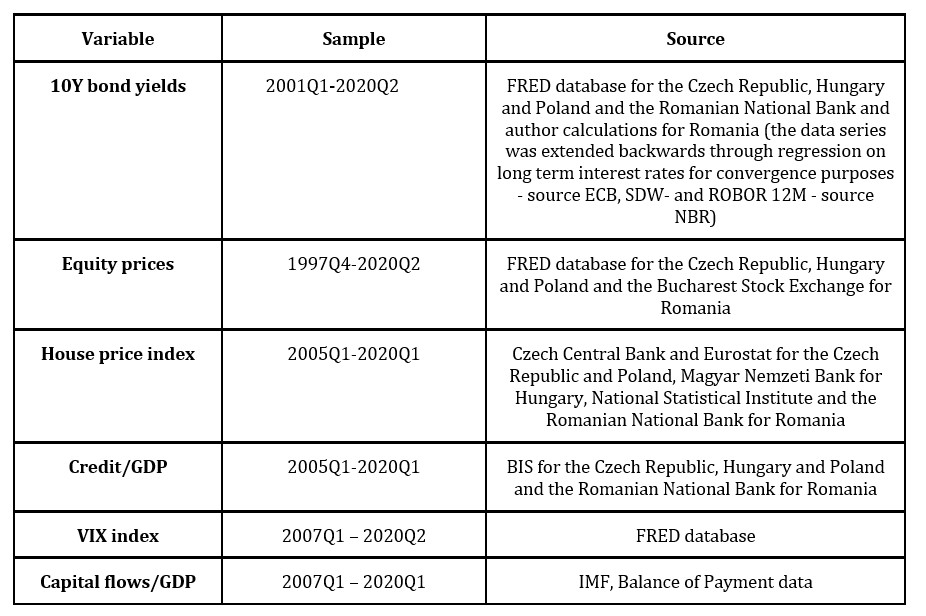
For our study, we considered the following variables characteristic for the financial cycle: 10 year government bond yields, equity prices (we considered the total share price for all shares in the respective countries), house price index (which captures price changes of all residential properties purchased by households and is different from the real estate index, which is a stock market index), total credit to GDP ratio and two measures of the global financial cycle – the global capital flows as share in GDP and the VIX index as measure of global risk aversion. The data had different time spans and were collected for the Czech Republic, Hungary, Poland and Romania (as well as world countries for the capital flows), from multiple sources, as can be seen from table 1 below.
Table 1: Data sources and samples
Methodology
As this study is a continuation of previous research with some common variables, the information presented here can have some minor similarities to that in Muraru (2019), Muraru (2020).
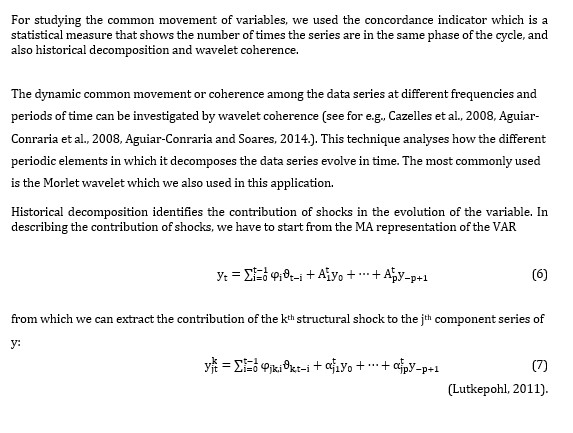
In order to isolate the cyclical components in the series, we used the band-pass filter with the filtering bounds of 8 and 60, accounting therefore for a cycle of median length. Even though traditionally financial cycles are considered to be longer (30 years – time span too long for our dataset), the literature on financial cycles considers the median length of a cycle to be 15 years (Drehmann et al., 2010). We further investigated the synchronicity among cycles on each of the selected variables in a cross-country framework by computing the concordance index (developed by Harding and Pagan, 2002) between all 4 countries after identifying the peaks and troughs with the Bry-Boschan algorithm for quarterly series. The concordance index is a statistical measure that indicates the proportion of time in which the analysed series move in the same direction, without giving any information about the amplitude of their movements.
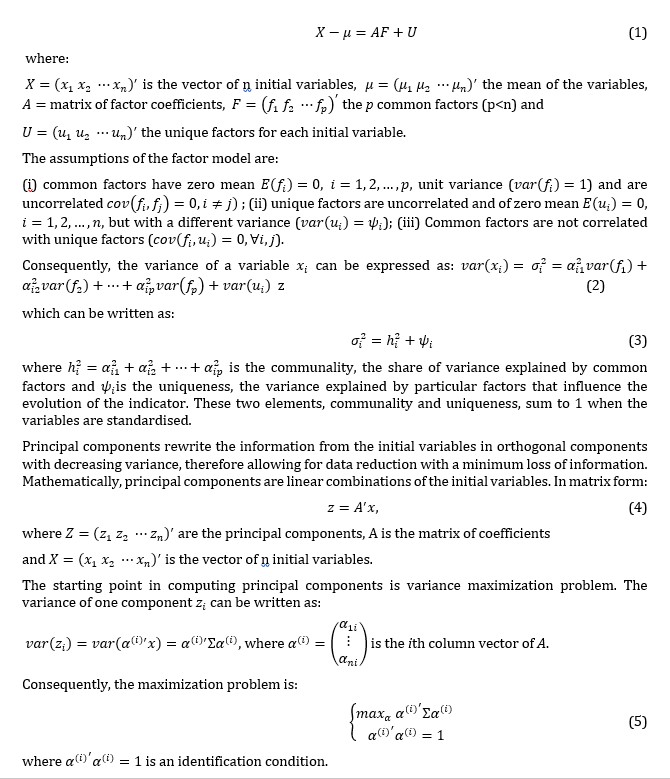
We also investigated the common movement of the cycles by applying factor analysis and crosschecking it with the results obtained from principal component analysis. Both methods are multivariate data analysis techniques for data reduction. Factor analysis, identifies the factors which induce the common movement of the dataset and at the same time explain the correlations between the series. Those factors are latent variables and they participate in explaining the initial variables in terms of common influence and unique characteristics.
In the factor model, each variable is written as a linear combination of common and specific factors. The common factors are usually in lower number than the initial variables. In matrix form, the model can be written as:
Results
Cycle synchronicity
The first step in investigating the synchronicity between the domestic financial cycles of the considered countries was to detrend the series by applying a band-pass filter with bounds corresponding to a cycle of median length (we performed this analysis on different time horizons, because data series had different available samples – see Appendix). The following step was to identify the peaks and troughs by applying the Bry-Boschan algorithm (we used the Matlab code provided by Engel, 2019) and to calculate the concordance between the series – the number of times the series shared the same phase of the cycle in all 4 countries.
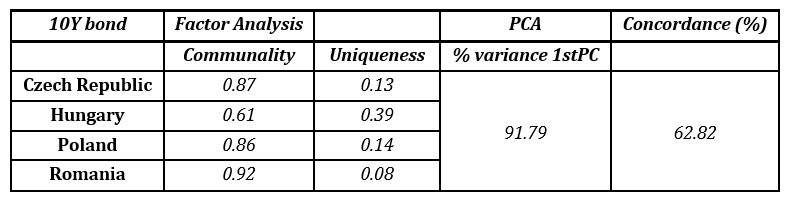
The results show high concordance for 10Y bond yields and equity prices (Table 2 and Table 3 below), components which had a more rapid increase in synchronicity worldwide on account of the rise in global covariation of equity return premiums and risk premiums (Jordà et al., 2018).
Table 2: Bond yield synchronization
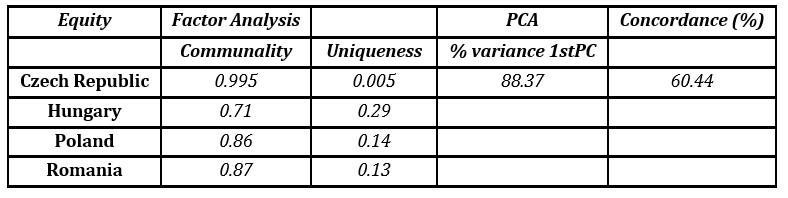
Table 3: Equity price synchronization
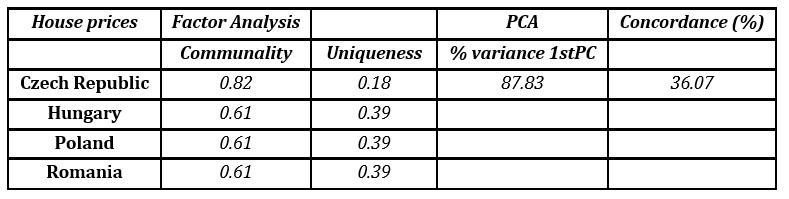
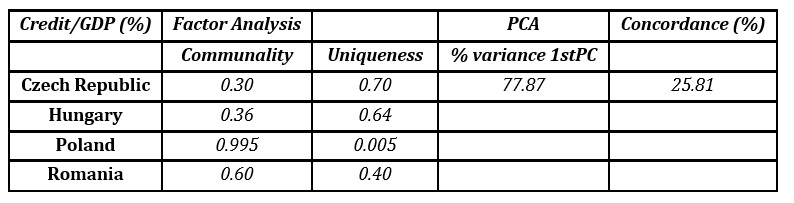
House prices and total credit/GDP seem to share to a lesser extent the same phase of the cycle; they are concordant about one third of the times (see Table 4 and Table 5). In what concerns credit/GDP, the lower synchronicity comes from credit – we investigated the concordance across countries separately for total credit and GDP and while for GDP the concordance was around 45 percent, for total credit it was lower than 30 percent. This result suggests that there are national specificities (even policies, changes in legislation) on housing and credit markets which occasionally induce a different pattern (conclusion similar to Breitung and Eickmeier, 2016). Still, factor analysis and principal component analysis give strong support for the existence of a common latent factor that explains the correlation between the evolution of house prices and total credit in the 4 EEMS. In both cases, one common factor is enough to summarize the data with an acceptable loss of information (12 percent in the case of house prices and 22 percent for total credit). Also, the common factor has high communality both for house prices and credit for all countries, with the exception of Poland, in which case the common factor for total credit had a much higher uniqueness.
Table 4: House prices synchronization
Table 5: Credit/GDP synchronization
The communality accounted by the common factor and the share of variance described by the first principal component is very high in the case of equity prices and 10Y bond yields, therefore one factor proves to be sufficient for explaining their common movement (see Table 2 and Table 3).
Identifying global influences
The goal of our paper was to identify to what extent the common evolution of domestic cycles is explained by global evolutions. We considered three measures for global influences: risk premiums (measured by the CDS), global risk aversion (measured by the VIX index) and a measure for global capital flows.
We considered the CDS variables for our sample of countries and then applied principal component analysis to build an aggregate measure for the risk premium. We have used the same methodology for building the global measure of capital flows. In building this measure we used gross inflows/GDP and not the net position because the net position has lower volatility, especially in the latest period, and a lower synchronicity with global risk aversion (Davis et al., 2019). The global measure of capital flows can be considered a proxy for the global financial cycle as it is strongly connected with other measures of the global cycle. Habib and Venditti (2019) and Avdjiev et al. (2017) show that it is tightly correlated with the Miranda-Agrippino and Rey measure of the global financial cycle, with the VIX index and also with other price measures of the global financial cycle.
After applying principal component analysis on the capital flows data (we used a number of 31 countries which had a balanced data set for the period 2005Q1-2020q1), we obtained a global cycle measure that explains 62 percent of total variance and which is strongly correlated to the inverted form of the VIX index – a correlation coefficient of 0.52.
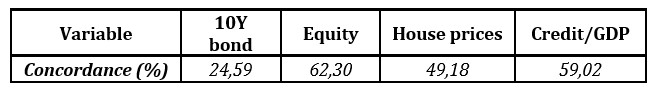
For the capital flows variable, we studied the concordance with the common movement extracted for each of our variables in the cross-country framework and they proved to be highly synchronous with the equity price and credit/GDP variables (Table 6).
Table 6: Concordance between capital flows and domestic financial cycle variables
Sample period: 2008q1-2020q1
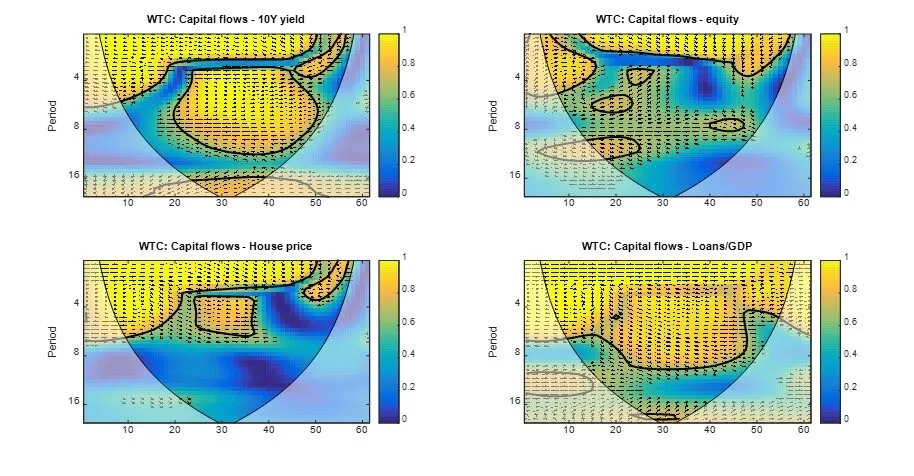
Also, wavelet coherence (we used the Matlab Cross Wavelet and Wavelet Coherence Toolbox provided free of charge by Grinsted, 2004), represented in Fig. 1 below, shows high synchronicity between capital flows and the financial cycle measures, especially at lower frequencies, higher frequency coherence being identified in a persistent manner only with credit to GDP ratio. The graph below shows the coherence between the series at different frequencies, identified by the periods on the y-axis – the lower part of the graph represents higher frequencies while the upper part presents the lower frequency. The intensity of the correlation is shown by the colour – yellow means a high level of coherence between the series (higher that 0.8), while the dark blue is an indicator of very low correlation between the series. The black continuous lines in the graph are the confidence interval for the measure.
Fig. 1. Wavelet coherence between capital flows and financial cycle measures
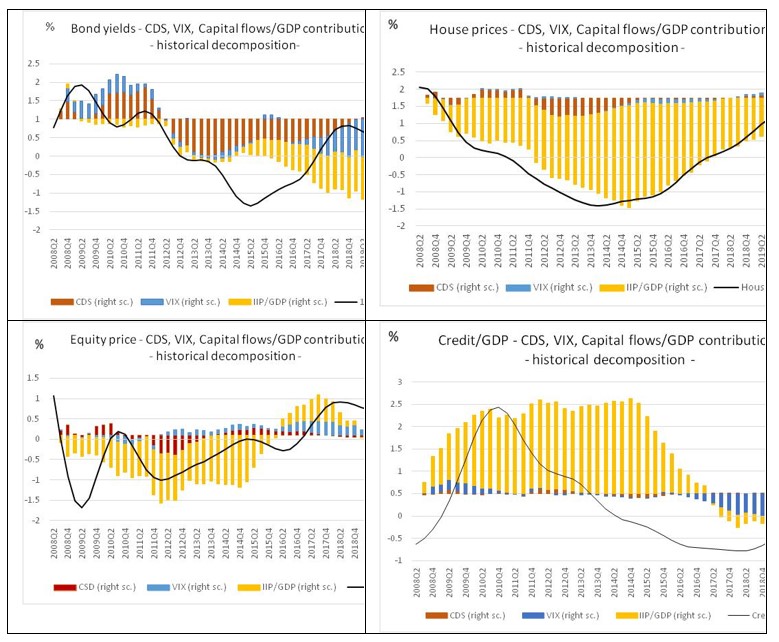
We also investigated the historical decomposition (Fig. 2) of each of the financial cycle series in a Bayesian VAR with CDS, VIX and the global capital flow/GDP measure. As can be seen from Fig. 2 below, the highest impact comes from the global capital flows. Regarding the magnitude of the impact, the global capital flows mostly influence the common cycle in house prices (explaining at certain moments even 80 percent of its evolution), but are also significant for equity prices and credit/GDP (explaining about 20-30 percent of their evolution at certain moments). None of the measures is capable of explaining the evolution of the common cyclical measure of 10Y bond yields, their contributions are very low. Risk premium and risk aversion also contribute to explaining the common cycles but to a much lower level.
Fig. 2. Historical decomposition
Conclusions
In this paper, we investigated the role of some global factors in explaining the common movement in financial cycle variables (bond yields, equity prices, house prices, credit/GDP) for 4 emerging European countries: Romania, Hungary, Poland and the Czech Republic. We have chosen measures of risk premium, global risk aversion and capital flows (the last two being good approximations of the global financial cycle) and reached the conclusion that the common domestic cycles are largely attributable to the global cycle in capital flows. The reason for this is that the global cycle in capital flows is highly correlated to different measures of the global financial cycle as global risks are transferred to capital flows especially through cross-border flows, loans by banks and other financial institutions (Habib and Venditti, 2019). The risk premium is of lower importance when compared to the capital flows, but still has a relatively important contribution in explaining the common cycles of some variables. The importance of risk premiums in explaining financial cycles’ co-movement has been debated in the related literature and explained especially for equity price synchronisation (Jordà et al. 2018), for which in our dataset is the main contributor in historical decomposition. The historical decomposition shows an even weaker impact from the global risk measure, but this could become higher as financial integration deepens and there is a change in investors’ sources of financing. From a practical point of view, the results confirm our hypothesis that domestic financial cycles cannot be interpreted individually, that there is important synchronicity in their evolution, especially in terms of bond yields and equity prices, indicators mostly prone to react to external evolutions. As our results point out, the co-movement of cycles can be associated with the global financial cycle, through the influence of capital flows, risk premium and risk aversion. Still, besides the undoubtedly global influence, there are also national specificities that shape domestic financial cycles. An interesting research subject and a perspective for our future research is to see how the domestic economic cycles are connected to a global measure of capital flows as there is a known and much studied connection between economic growth and capital flows.
Avdjiev, S. and Hale, G. (2018), ‘US monetary policy and fluctuations of international bank lending’, BISWorking Papers, no 730.
Aguiar-Conraria, L., and Soares, M. (2014), ‘The continuous wavelet transform: Moving beyond uni- and bivariate analysis’, Journal of Economic Surveys, 28, 344-375
Aguiar-Conraria, L., Azevedo, N., and Soares, M. (2008), ‘Using wavelets to decompose the time–frequency effects of monetary policy’, Physica A, 387, 2863–2878.
Aikamn, D., Haldane, A., and Nelson B.D. (2015), ‘Curbing the credit cycle’, The Economic Journal, 125, 1072-1109.
Aldasoro, I., Avdjiev, S., Borio, C., and Disyatat, P. (2020), ‘Global and domestic financial cycles: variations on a theme’, BIS Working Papers, 864.
Benes, J., Laxton, D., and Mongardini, J. (2016), ‘Mitigating the deadly embrace in financial cycles; countercyclical buffers and loan-to-value limits’, IMF Working Papers, 16/87.
Borio, C. (2014), ‘Monetary policy and financial stability: what role in prevention and recovery? ‘, BIS Working Papers, 440.
Borio, C. (2019), ‘A tale of two financial cycles: domestic and global’, Lecture at University of Zürich. BIS Speeches.
Breitung, J., and Eickmeier S. (2016), ‘Analysing international business and financial cycles using multi-level factor models’ in J. Hillebrand & S.J. Koopman (Eds.) Advances in Econometrics ( 177-214), 35. Emerald Insight.
Bruno, V., and Shin, H. S. (2015), ‘Capital flows and the risk-taking channel of monetary policy’, Journal of Monetary Economics, 71, 119-132.
Cazelles, B., Chavez, M., Berteaux, D., Menard, F., Vik, J., Jenouvrier, S., and Stenseth, N. (2008), ‘Wavelet analysis of ecological time series’, Oecologia, 32, Issue 7, 287-304. DOI: 10.2307/40213251.
Claessens, S., A., Kose, A., and Terrones, M. (2011), ‘Financial cycles: What? How? When? ‘, Centre for Economic Policy Research Working Papers, 8379.
Claessens, S., A., Kose, A., and Terrones, M. (2012), ‘How Do Business and Financial Cycles Interact?’, Journal of International Economics,87, Issue, 1, 178-190.
Comunale, M. (2017), ‘Synchronicity of real and financial cycles and structural characteristics in EU countries’, Occasional Paper Series, 15. Bank of Lithuania.
Davis, J., Valente, G. and van Wincoop, E., (2019), ‘Global capital flows cycle: impact on gross and net flows’, NBER Working Papers, no25721.
Dées, S., and Gales, A. (2019), ‘The Global Financial Cycle and US Monetary Policy in an Interconnected World’, Banque de France Working Papers, 744.
Drehmann, M., Borio, C., Gambacorta, L., Jiménez, G., and Trucharte, C. (2010), ‘Countercyclical capital buffers: exploring options’, BIS Working Papers, 317.
Drehmann, M., Borio, C., and Tsatsaronis, K. (2011), ‘Anchoring countercyclical capital buffers: the role of credit aggregates’, BIS Working Papers, 355.
Drehmann, M., Borio, C., and Tsatsaronis, K. (2012), ‘Characterising the financial cycle: don’t lose sight of the medium term! ‘, BIS Working Papers, 380.
Gadanecz, B., and Jayaram, K. (2016), ‘Macroprudential policy frameworks, instruments and indicators: a review’ in Irving Fisher Committee Bulletin No 41: Combining micro and macro statistical data for financial stability analysis. BIS.
Haavio, M. (2012), ‘Financial Cycles and Business Cycles: Some Stylised Facts’, Bank of Finland, BoF Online, [Retrieved August 23, 2020], http://urn.fi/URN:NBN:fi:bof-20140807701
Habib, M. and Venditti, F. (2019), ‘The global capital flows cycle: structural drivers and transmission’, ECB Working Papers, no 2280.
Harding, D., Pagan, A., (2002), ‘Dissecting the cycle: a methodological investigation’, Journal of Monetary Economics. Vol. 49, Issue 2, 365-381.
Jordà, O., Schularick, M., Taylor, A. and Ward, F., (2018), ‘Global financial cycles and risk premiums’, NBER, Working Papers, no 24677.
Kunovac, D., Mandler, M., and Scharnagl, M. (2018), ‘Financial Cycles in Euro Area Economies: A Cross-Country Perspective’, Working Papers, Croatian National Bank.
Lutkepohl, H. (2011), ‘Vector autoregressive models’, EUI Working Papers.
Miranda-Agrippino, S., and Rey, H. (2020a), ‘The Global Financial Cycle after Lehman’, AEA Papers and Proceedings, 110, 523-528.
Miranda-Agrippino, S., and Rey, H. (2020b), ‘S. Monetary Policy and the Global Financial Cycle’, The Review of Economic Studies, rdaa019.
Muraru, A. (2019), ‘Co-movement and synchronicity of business and financial cycles in Romania and other EEMS’, Proceedings of the IE 2019 International Conference, 453-458.
Muraru, A. (2020), ‘The impact of global tensions on the economic and financial cycle in Romania’ Postmodern Openings, 11(3), 115-128.
Rey, H. (2015), ‘Dilemma not Trilemma: The Global Financial Cycle and Monetary Policy Independence’, Working Paper 21162, National Bureau of Economic.
Rünstler, G., and Vlekke, M. (2016), ‘Business, housing and credit cycles’, ECB Working Paper,1915.
WGEM Team on Real and Financial Cycles (2018), ‘Real and financial cycles in EU Countries: stylised facts and modelling implications’, ECB Occasional Paper,
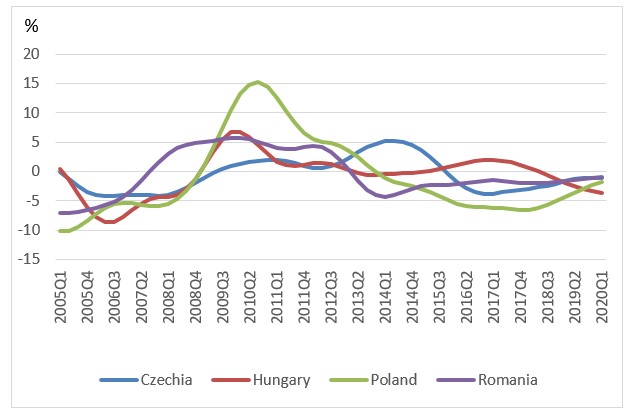
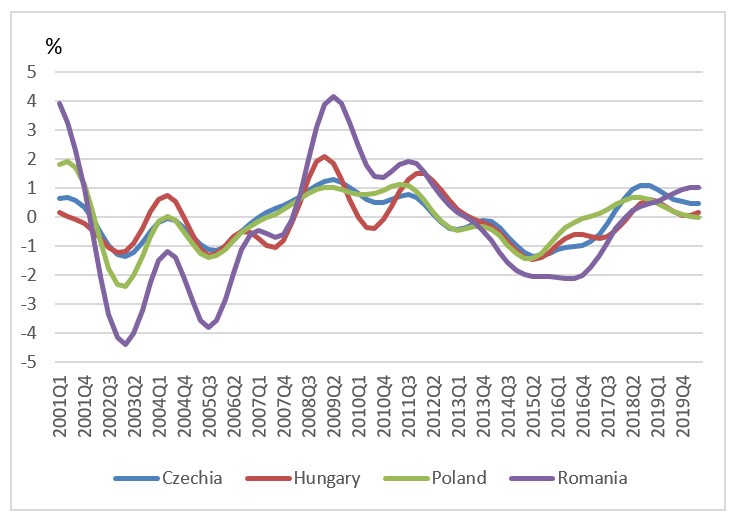
Appendix
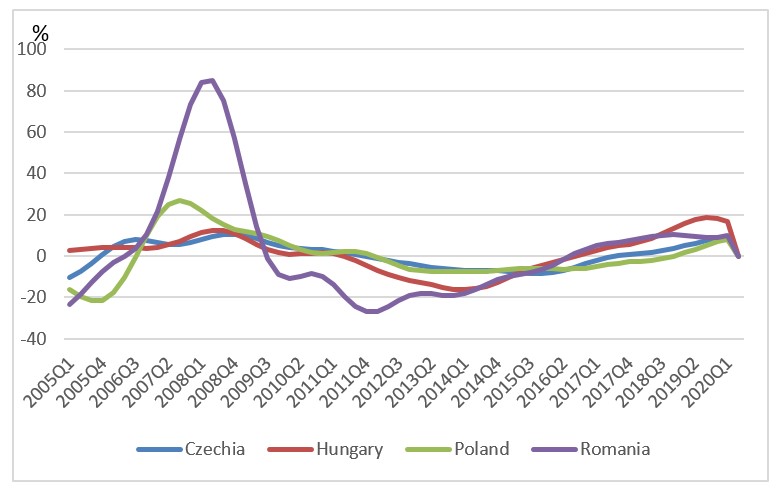
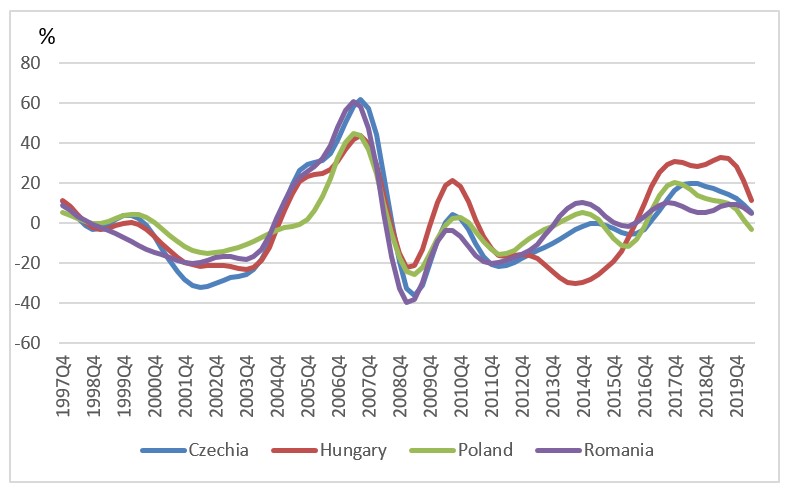
Fig. 1: Credit to GDP cycles (BP filter – cycles represent percentage deviations from trend)