School of Economics, Wuhan University of Technology, Wuhan, China
Volume 2022,
Article ID 377744,
Journal of Financial Studies and Research,
18 pages,
DOI: 10.5171/2022.377744
Received date: 18 October 2021; Accepted date: 20 January 2022; Published date: 28 March 2022
Cite this Article as:
Nan CHEN (2022)," Bitcoin Price and Miner Behavior an Application of ARDL Model", Journal of Financial Studies & Research, Vol. 2022 (2022), Article ID 377744, DOI: 10.5171/2022.377744
Bitcoin price volatility has always been a hot topic in the economic world as well as the academia, and many researchers have explored the price dynamic formation from different aspects. This study employs the AutoRegressive Distributed Lag (ARDL) Model to explain the bitcoin price formation from the perspective of miners hoarding behavior. For one thing, miners hoarding bitcoin will cause the supply side to change rather than fix hinging on the bitcoin mechanism. For another, miners hoarding behavior will steer sensitive people transaction activities. Thus, miners hoarding behavior would change both supply and demand sides of bitcoin. The data we used are obtained from the CoinDesk, Glassnode, Google Trends, CoinMarketcap, BlockChain, and BTC. In particular, we have creatively developed a way to digitize miners hoarding behavior. The estimated results show that the hoarding behavior has a negative impact on the price, and the first-level lag of the hoarding behavior is positively correlated with the price, indicating that the bitcoin price has a certain predictive power. In addition, through doing two-period study, we also found that people become more sensitive to the bitcoin price and miners hoarding behavior, and take transaction actions faster after 2019.
JEL classification: G41 E39 E51
Keywords: Bitcoin price; hoarding behavior; ARDL model
Introduction
Bitcoin is one of the cryptocurrencies that was first introduced by Satoshi Nakamoto at the depth of the financial crisis in 2008 (Horra, Fuente and Perote, 2019). It was formally used in 2009 when the genesis block was mined. Decentralization and anonymity are the most important features of bitcoin that completely differ from traditional currencies. Cryptocurrencies are materialized on the peer-to-peer network depending on the blockchain which contains a string of chronology ordered blocks. Each user can send or receive bitcoins in this alphanumerical chain without any intermediary and each transaction along with its performers’ actual addresses will be recorded by blockchain (Kristoufek, 2020).
Without a central bank, the issuing of bitcoin is achieved through solving convoluted mathematical problems using computer power by ‘miner’, and this process is known as mining. When a miner successfully adds a block in the chain, he will get some bitcoins as a reward. However, this reward will be halved every four years(Andreas M, 2014). It is the only origin to release bitcoins. Because of lacking regulation and supervision circumvent, bitcoin price fluctuates severely: it increased from zero at the time of its inception in 2009 to around $1100 at the end of 2013 and then continuously oscillated, especially swings wildly after 2016. At the end of 2017, its price reached around $19,075 but dropped to about $3,665 in early 2019 and anew increased sharply to $35,637 at the beginning of 2021. Since bitcoin price is highly volatile, the number of researches study relating to it boomed. The debates on its real value exist all the time. On the one hand, many researchers point out that speculation seems to be a huge factor of price dynamic of bitcoin, which indicates that bitcoin is worthless. On the other hand, Hayes (2017) proposes that the quantifiable inherent value of bitcoin is equal to the expense of production. In his later paper, Hayes (2019) confirms the robustness of a price model which regards the cost of mining electric power as an independent variable of price. He concludes that the market price of bitcoin moves around the marginal cost of production.
For the bitcoin price formation, there is a rising growth of interest due to the great volatility of the price. Numerous factors that affected the price are investigated by previous literature. Traditionally, the economic theory suggests that when supply and demand interact, the price of the currency in the market is determined. A part of scholars claim that it is the same when it comes to the currency, and so to the bitcoin. Buchholz et al.(2012) argue that the bitcoins supply determines the total size of flow in circulation so the scarcity on the market, and its demand, to some extent, is largely determined by the need of bitcoin as a medium to exchange in transactions. Thus, the interaction of supply and demand influences, to a large extent, the bitcoin price. What is more, due to the high popularity of bitcoin, a lot of researchers pay attention to the bitcoins attractiveness for investors. They prove that attractiveness contributes more to the bitcoin price than the macroeconomic fundamentals such as supply and demand (Kristoufek, 2013, 2015; Bouoiyour, 2015; Goczek and Skliarov, 2019). Similarly, Garcia et al.(2014) show that the information on Google Trend and the word-of-mouth information on social media flow of bitcoin users also have remarkable impact on the dynamic of bitcoin price. Ciaian et al. (2016) simultaneously analyze different drivers: the force of bitcoin supply and demand, attractiveness for investors and global macroeconomic development. They find that global macro-financial development is insignificant, which challenges some foregone research. Cheah et al. (2018) show that uncertainty has a negative effect on price and the equilibrium prices are correlative with memory. Gandal et al. (2018) examine the connection betwixt manipulation and price, then point out that the suspicious purchasing activity could cause the huge price increases.
With the range of studies on bitcoin price expanded, there are more and more researchers employing comprehensive multi-factor to explain the volatility of bitcoin price. Polasik et al.(2015) find that popularity, information sentiment, and liquidity (transactions) have a positive impact on bitcoin price. Chen et al.(2020) present that the dependence relationship between bitcoin price and cost, number of transactions, and transaction fee, is symmetric. Kapar & Olmo (2021) report that the dynamics of price has negative correlations with the gold spot price and the fear index (FED Financial Stress Index), while it has positive correlation with online interest and S&P 500 index.
The models that researchers used vary according to different data characteristics. By applying the Factor Augmented Vector Error Correction Model, Goczek & Skliarov (2019) find that popularity is the main force that drives bitcoin price. Chen et al. (2020) employ the VECM Model to study the relationship among fear sentiment, bitcoin returns and bitcoin trading volume. Gandal et al. (2018) use ordinary least squares approach to explore the manipulation of price in the bitcoin system.
Following the literature, we continue to focus on price formation. Differing from a majority of research study emphasizing users behavior, our study is specially from miners perspective. As we all know, it is miner who maintain the bitcoin ecosystem’s infrastructure and their behavior has close ties with bitcoin price. But the study of miners, to the best of our knowledge, is almost rare. Some previous works focus on the processing of mining, such as the energy consumption, hash rate, mining difficulty and cryptocurrency algorithms. Kristoufek (2015) points that the hash rate and the difficulty of mining connecting the cost of miners can influence the price, especially in the short-term. What is more, the wealth of miners will influence their own decisions about whether continually spend much more money buying new hardware when the hash rate is increasing (Cocco and Marchesi, 2016). Even though the degree of attention to the miners is low compared with users, obviously, it is deficient and unreasonable. Miners behavior plays an important role in bitcoin ecosystem and bitcoin price formation. It might influence the supply side of bitcoin and have some guiding role for all participants. Thus miners behavior is vital for price study and may explain price volatility effectively. From this point of view, we aim to investigate and analyze the relationship between bitcoin price and miners behavior.
In the economic theory, the intersection of supply and demand, that is the Ms=Md, determines the equilibrium prices. The demand for bitcoin is generally stemming from the need to exchange bitcoin in transactions, which represent its value as a medium. The supply of bitcoin is originally seen as a constant depending on the system mechanism, however, with the existence of economic bubble and opportunities for speculation, it is possible for miners to save some of the bitcoins in their account to earn profits rather than put all of them into circulation after mining process. Thus, the supply of bitcoin is not constant all the time. Hou et al. (2020) provide a profound understanding of miners behavior and status of them using at least ten years bitcoin traces. They also emphasize in recent years hoarding behavior may relate to price and conclude the hoarding phenomenon should be studied in-depth. In the same vein, we are wondering whether the hoarding behavior of miners relate to the bitcoin price and whether there is some sluggish response between them. Our empirical strategy is on the basis of ARDL Model due to the characteristics of the variables.
The contributions of this paper are twofold. In recent years, hoarding bitcoin becomes a very frequently happening phenomenon that may influence the supply in the bitcoin system. It means the bitcoin supply is not absolutely fixed and price fluctuation may be relevant to hoarding behavior. Against this background, first, we investigate and measure the hoarding behavior of miners. We creatively developed a method to digitize miners hoarding behavior, thus provide a basis for further research on the relationship between hoarding behavior and bitcoin price. Second, our study enriches the recent literature and fills the gap of relationship between the behavior of miners and bitcoin price.
Our results suggest that hoarding behavior and bitcoin price exactly have causal relationships in the short-term. When price changes one unit, the number of hoarding bitcoin always changes 0.186 unit inversely. And bitcoin price is positively related with fist-order lag of hoarding, thus miners hoarding behavior could predict the volatility of bitcoin price in the next period.
The remainder of the paper is managed as follows: Section 2 describes the data sets used in our research; Section 3 and 4 introduce the model and economic approaches to explain the bitcoin price formation; Section 5 shows the empirical results; Section 6 concludes the paper.
Data Description
In this paper, we are mainly interested in five variables – bitcoin price (USD), the number of bitcoin that miners hoard, google trend, the number of active addresses and transaction volume. Our samples are all weekly data covering from 7 February 2016 when the big jolt of bitcoin price initiates to 7 February 2021. The observations are at the rate of one week, which is due to the access of data on Google Trend. At the same time, this reported rate can assist our study more forcefully. Compared with daily data, the weekly data have a reducing frequency of market noise, thus more informative about the market dramatics (Kapar and Olmo, 2021). The data we used are obtained from the CoinDesk, Glassnode, Google Trends, CoinMarketcap, BlockChain and BTC.
First, we collect bitcoin price (BTC Price) on average quoted in USD from the CoinDesk website. Then we obtain the number of active addresses (Active Address) from the Glassnode website including both user and miner addresses which indicate the number of people participating in the transactions. For simplicity, assuming one person only has one account and so this variable represents the interest and passion at the big extent. We get bitcoin estimated transaction volume (BTC) from the BlockChain site through the application programming interface (API). According to Li & Wang (2017) , this variable can reflect the scale of bitcoin economy.
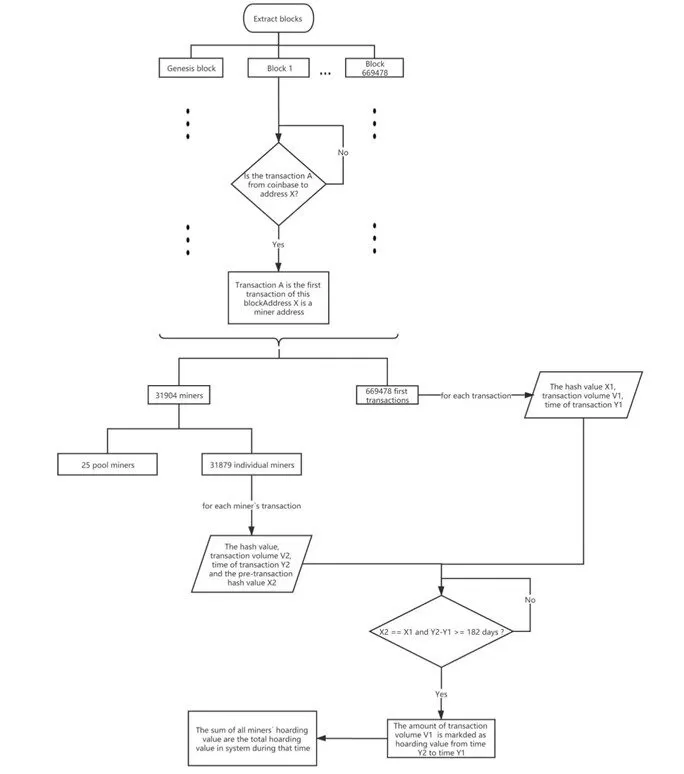
Next, as the miners behavior of hoarding is core in our study, there is more work we need to do compared with other four variables. According to the technical principle of blockchain, all the transactions are recorded in the chain and are accessible freely for everyone. Following Xu et al. (2020), we download all the blocks in the blockchain created from 4 January 2009 to 7 February 2021 containing the height of blocks from 0 to 669478. For each block, we extract the first transaction whose sender is coinbase and we regard the receiver of this transaction as a miner, after that, we triumphant gain 31904 different miner addresses. In the next step, we store them in the database bitcoin-table1 with addresses as the key which is unique. Specially, there are 25 addresses among them are pool miners. We also extract the hash value of the first trade of every block. We use the addresses except for pool miner addresses in the bitcoin-table1 to get every address transaction records and store transaction information including the transaction value, the hash of transaction, the time of transaction and the addresses of pre-transaction in the database bitcoin-table2. Then following Matonis (2012), we define 182 days as hoarding limitation, that is the value of bitcoin which a miner gains from coinbase as a mining reward will be seen as hoarding value (BTC) if there are more than 182 days from a miner who gets them to the day he spends them. After that, we absorb the hoarding value data during our research period. The specific flow is shown in Figure 1. Hoarding behavior shows some speculation related to price and has some impact on the supply of the whole system. It means the supply of the whole bitcoin system is changing all the time, which contradicts the fixed bitcoin supply hypothesis in literature.
Figure 1: Hoarding data flow chart
Lastly, we want to measure the enthusiasm of people for mining. So, we use the number of search times on the Google engine as a proxy of it inspired by much previous research (Vosen and Schmidt, 2011; Bouoiyour, 2015; Fry and Cheah, 2016). In particular, we use the frequency of searches with the keyword ‘mining’ from Google Trend.
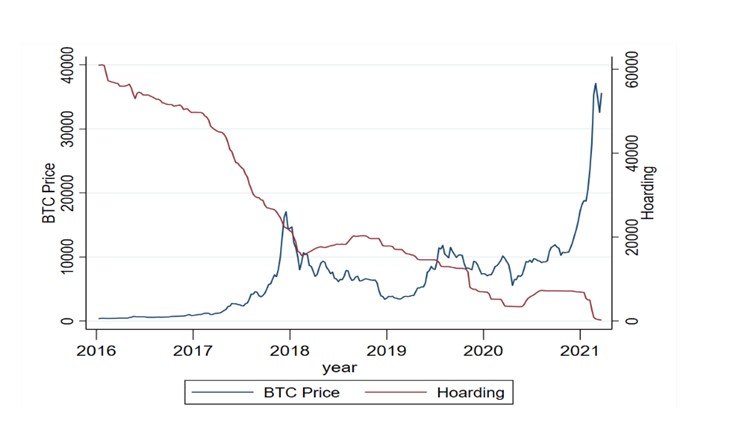
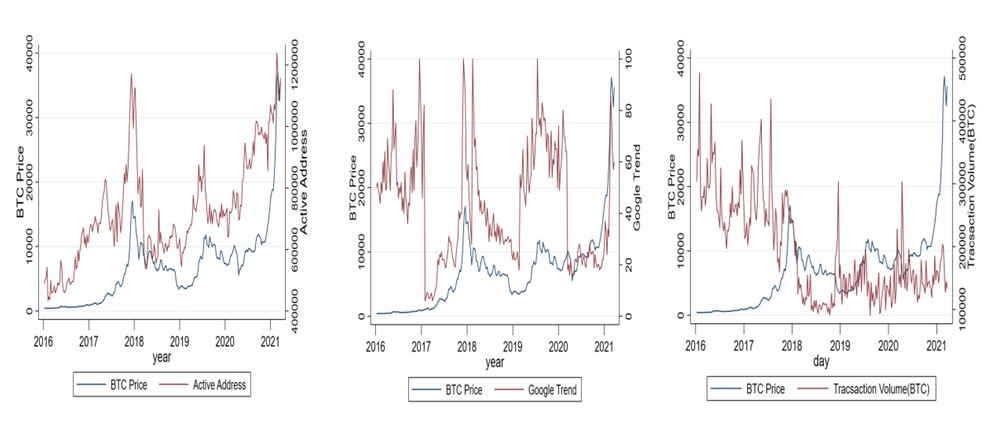
Figure 2 reveals that there has been a negative relationship between bitcoin price and hoarding with some lagging effect; for example, the price rose to a high point in 2018 and the hoarding flowing reached a low point later. The two variables fluctuate correspondingly and have an opposite trend. Figure 3 shows the mutual links between price and google trend, active address and transaction volume, respectively. Active Address is positively correlated with BTC Price and its curves almost have the same shape. Google Trend is more stationary than BTC Price, but both still have the same trend: reach the top spot and bottom spot almost simultaneously. And for the Transaction Volume (BTC), it moves inversely to the BTC Price.
Figure 2: The number of bitcoin price and hoarding
Figure 3: The number of bitcoin price, active address, google trend and transaction volume (BTC)
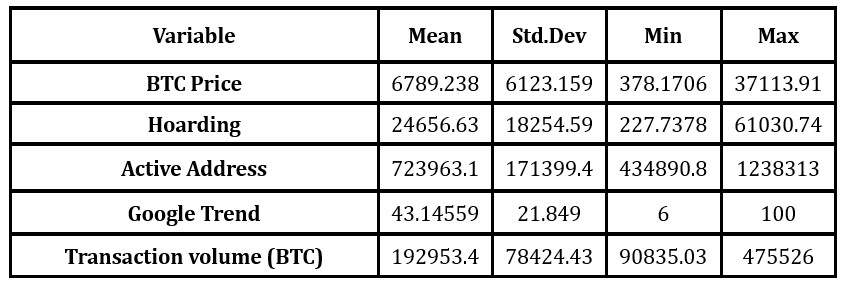
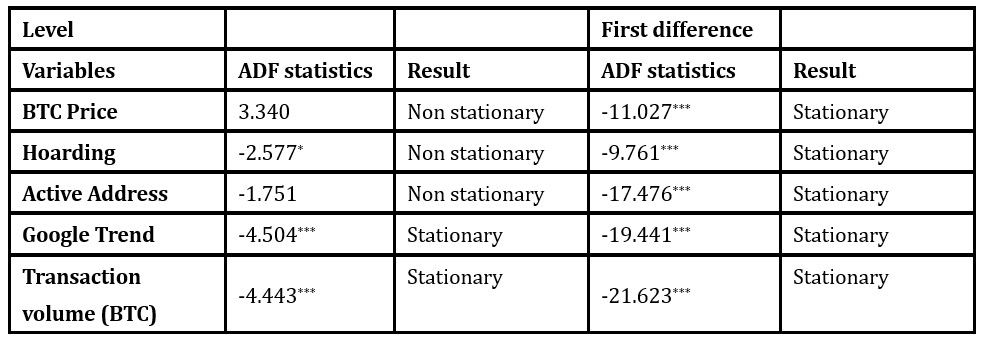
We employ the ADF stationary test to verify the stationarity of the time-series data set. The detailed statistics of all variables are displayed in Table 1; the results of the ADF test are in Table 2, and the results including the first difference of all variables as well. From the results, we find that the bitcoin price, active address, and hoarding, have a unit root but are stationary at 1% level at the first difference. Transaction volume and google trend are stationary. To sum up, the variables in our study show a mixed integration order of I (0) and I (1).
Table1: Statistics of all variables
Table 2: Unit root test
Note: The * in the table indicates the result of Augmented Dickey-Fuller test with the null hypothesis of the variable having a unit root. The marks *, ** and *** represent the rejection levels at 10%, 5% and 1%, respectively.
Model
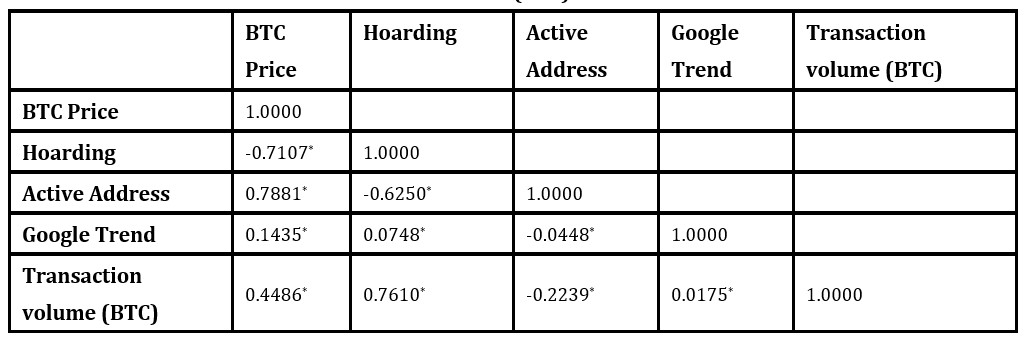
To further investigate the relationship among variables, we examine the degree of correlation amongst the variables. As Table 3 shows, hoarding, transaction volume (BTC), active address, and google trend are all significantly correlated with bitcoin price at least at 5% level. What is more, a great negative correlation between price and hoarding is further strengthened.
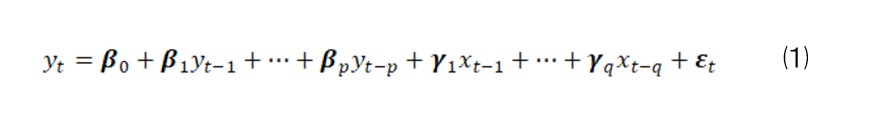
Next, based on the rough correlation trend, we further study the exact relationship of variables. Because the bitcoin price, active address, and hoarding are no-stationary, common time-series regression models such as the OLS approach are unsuitable and may generate spurious regression and inconsistent estimation (Li and Wang, 2017). Moreover, the variables are composed of I (0) and I (1) time series; it is inappropriate to apply either VAR or VECM approach, as they may lead to inaccurate results. All the features indicate that the Autoregressive-Distributed-Lag (ARDL) Model, proposed by Pesaran et al. (2001), is the most fit for our variables. In the ARDL model, demand for absolute stationary variables is inexistent, hence, it can be used to research the cointegration among a series of variables of order I (0) or I (1) or mixed I (0) with I (1). The general ARDL(p,q) model equation is expressed as follows:
The lags order p and q are determined by AIC criterion and may differ relying on the independent variables or periods covered in our models.
In this section, we use qualitative analysis to understand the correlative linkage between bitcoin price and other variables which are regarded as independent variables, especially the hoarding behavior. Three models are set up according to different explanatory variables included. Firstly, as our main purpose is to deliberate the relationship between bitcoin price and hoarding behavior, Model 1 contains two sets of variables: BTC Price and Hoarding. Furthermore, we consider the influence of attractiveness and attention for mining. The attractiveness is measured by the number of active addresses and the participation in the bitcoin system. And the attention for mining is indicated by google trend. Therefore, Model 2 includes a series of variables: BTC Price, Hoarding, Active Address and Google Trend. In addition, Model 3 adds the variable Transaction Volume (BTC) which presents the scale in the bitcoin ecosystem from a macroeconomic view.
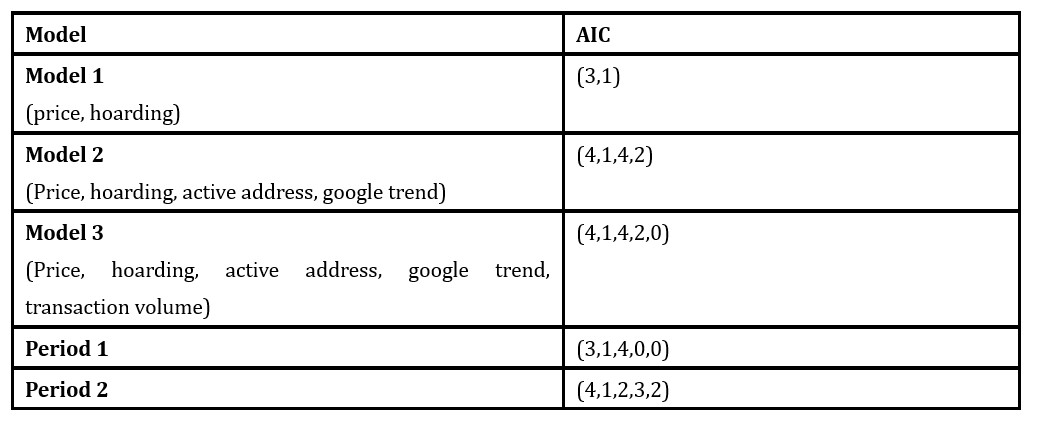
It is crucial to select the accurate number of lags to increase the reliability of the model estimation. For each model, the maximum lags of all variables are chosen by the Akaike Information Criteria (AIC) individually. The appropriate lags are illustrated in Table 4.
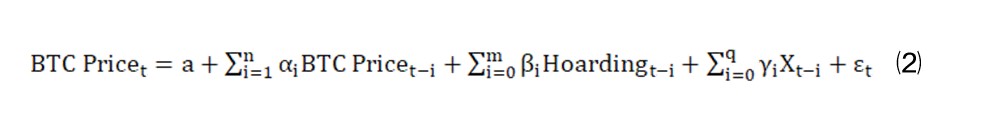
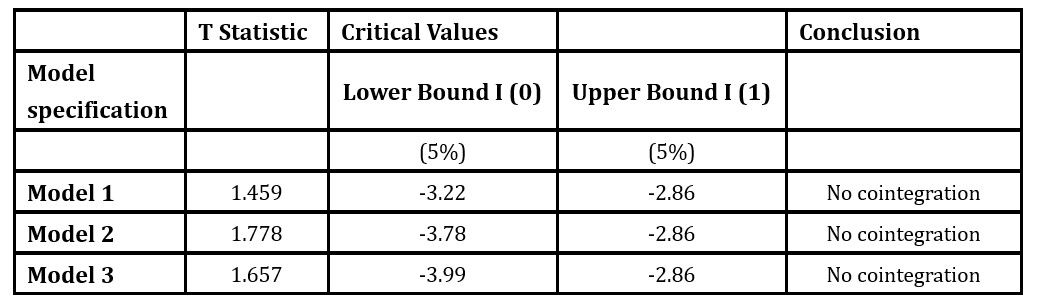
After that, we need to examine whether there is a long-term relationship among variables. We employ the ARDL Bounds test whose standards involve bounds that are established by series I (0) and series I (1) respectively. According to this rule, long-run correlation relationship exists only when the T statistic is less than the critical value of I (1) regressors (5%), on the contrary, if the T statistic is greater than the critical value of I (0) regressors (5%), there is no significant long-term relationship among variables. It can be seen from Table 5 that there is no significant long-term equilibrium relation among variables in each model, that is, no cointegration relationship exists in the three models. Therefore, there it is unnecessary to represent the ARDL model as the Error Correlation Model (ECM) which shows the adjustment from the short-run fluctuation to the long-run balanced relationship. In accordance with the analysis above, we restructure our ARDL model equation as follows:
Where a is the constant, are the corresponding coefficient vectors. Xt-i includes different control variables hinging on different models, that is, null in Model 1 covers Active Address and Google Trend in Model 2, and contains Active Address, Google Trend and Transaction Volume (BTC) in Model 3. is the white noise residual.
Table 3. Correlation of BTC Price, Hoarding, Active Address, Google Trend and Transaction volume (BTC)
Notes: * indicates correlation significance at 5% level.
Table 4. Lag selection
Table 5. ADL Bounds Test results
Results Analysis
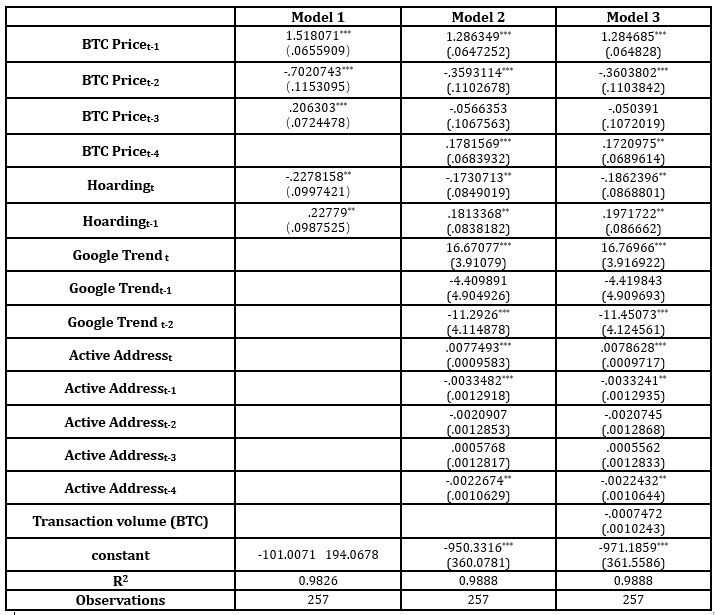
We study the bitcoin market with the data series from February 7th, 2016 to February 7th 2021, and Table 6 illustrates the results of three models. The result of Model 1 shows that the number of hoarding bitcoin negatively affects the bitcoin price at 5% level significance, which indicates that the decline of bitcoin price is partly due to the rise of miners hoarding behavior. However, the first lag of hoarding positively affects bitcoin price at 5% level. Moreover, the price is positively affected by its first order lag and third order lag but negatively affected by the second order lag.
The second model, involving Active Address and Google Trend based on Model 1, exhibits that when considering the amount of active addresses and google search trend which present the degree of participants and attention, bitcoin price is still negatively affected by hoarding behavior at 5% level without any lag. We also found the quantity of active addresses and the google trend index have a positive impact on the price at the p = 0.01 level. The auto-regressive part of bitcoin price with first order has the same relationship with bitcoin price as in Model 1, whereas the significance of the fourth order lag is significant at 1% level rather than second order lag. The third model includes all the variables in our research. As shown in Table 6, hoarding behavior has a negative impact on the bitcoin price and its first lag has a positive impact on the bitcoin price just as Model 1 and 2. But for the transaction volume, it cannot explain the bitcoin price powerfully.
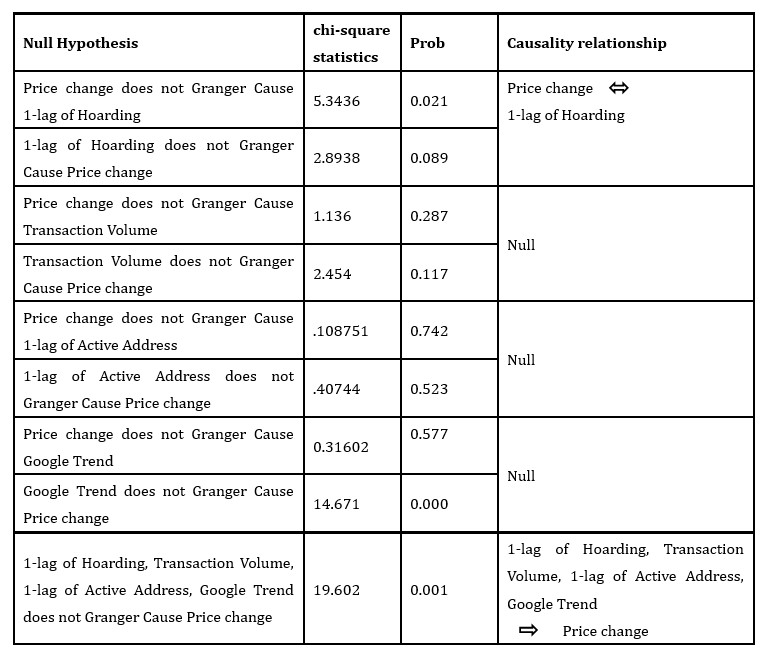
The Granger causality test is utilized. Deferring to the rules of the Granger causality test, all of the variables must be stationary, thus we use the first difference of Hoarding and Active Address, especially, we use bitcoin price change to replace the price. The causalities for the whole variables are shown in Table 7. A bidirectional relationship is found between the first lag of hoarding and the bitcoin price change. What is more, the google trend can significantly predict the future price at 1% level. Besides, the causality between the bitcoin price change and other variables in the test is significant at 1% level. This analysis verifies that the bitcoin price truly relates to the remaining variables, in particular, the hoarding variables and price can influence each other.
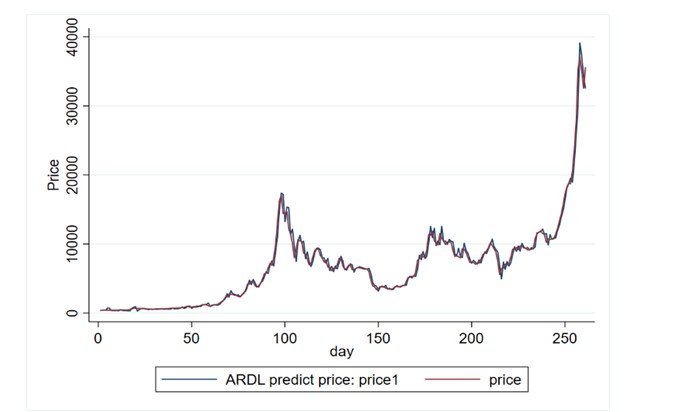
According to the results of the Granger causality test and three models above, it is obvious that there is a special relationship between hoarding behavior and bitcoin price. All of the three models illustrate that the hoarding behavior of miners is negatively correlated with bitcoin price. This may because when miners are investors, to maximize profits, they will hoard bitcoin when price decreases and trade bitcoin when price increases, thus earn the price difference. Just as the Gresham-Copernicus law declares that when facing trade-off between two currencies, the one with a better expected value will be hoarded (Krueger & Ha, n.d.,1995), this behavior can be seen as a kind of speculation action to some degree. And the response rate of bitcoin hoarding behavior to price change is almost 20%. Furthermore, the first order lag of hoarding positively correlates with price. This may because bitcoin is mainly demanded for the purpose of speculation, especially in the short-term (Baek and Elbeck, 2015; Baur, Hong and Lee, 2017; Horra, Fuente and Perote, 2019). Consisting with Gandal et al. (2018), miners as an important role in this cryptocurrency system has oriented function and their activity could strongly influence the bitcoin price. When the number of hoarding bitcoins extends, which means miners prefer bitcoin and have a good expectation, others especially those who are focused on speculation will be attracted by miners behavior to enter or purchase bitcoin in the system, thus give rise to increase in demand. Horra et al. (2019) also suggest that more than 70% of bitcoin daily transactions are out of speculation. At the same time, the supply of bitcoin will reduce rather than contain a fixed number in accordance with the bitcoin system mechanism. Then as a result of the fact that bitcoin demand is greater than supply, according to the economic theory, the price will be driven up. Later, as the price rising meets some expectation of individuals, they will sell them and lead to a decreasing trend of price. Whether this mechanism has some lags is hinging on the users risk appetite which may differ from person to person. Based on Model 1, price can be predicted and we compare price 1 with the true price. As shown in Figure 4, the estimated value price 1 largely fits with the true value price, thus miners hoarding behavior can be used to predict the price of bitcoin.
Figure 4: prediction of bitcoin price
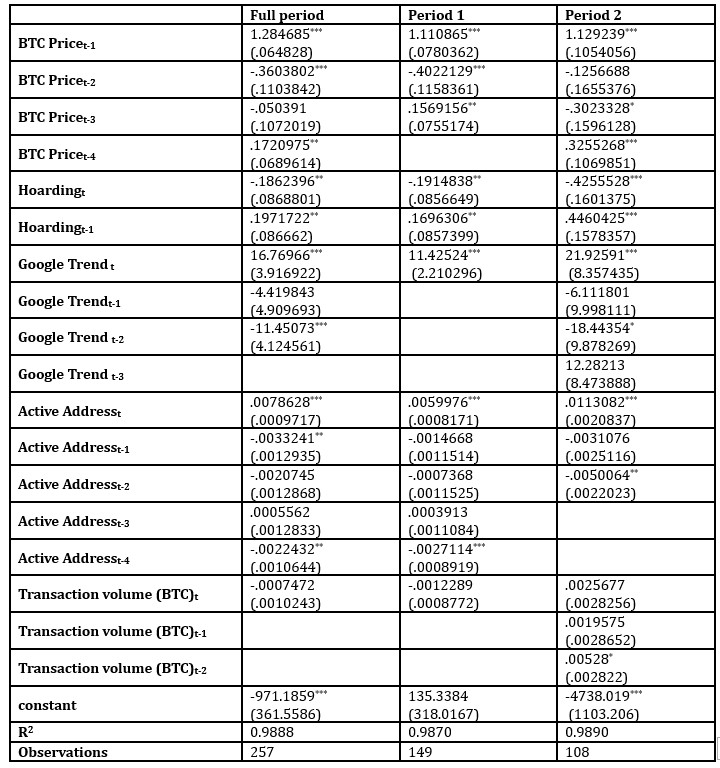
To examine whether the relationship between bitcoin price and hoarding is established under the different circumstances, we divide our research into two periods: before 2019 and after 2019, which are marked as Period 1 and Period 2. We choose 2019 as a bound is due to the great big events that happened in 2018, for example, Twitter, Google, and Facebook banned cryptocurrency consecutively, hacking attacks occurred frequently and the supervision tightened in China whose market share is the biggest in the cryptocurrency market. These events may change people attitude to bitcoin, routines in the bitcoin ecosystem, and the market environment for cryptocurrency and so on. As shown in Table 8, the total trend is the same but differs in quantitative value and significance compared with the result of the full period. The coefficient of Hoarding in period 2 is almost 2.5 times bigger than it is in period 1. And the significance level rises from 5% to 1%. These results mean that the bitcoin price responds more dramatically to the variation of hoarding behavior and the correlation between them is closer from 2019. This suggests that after 2019 people have become more sensitive to the bitcoin price and hoarding behavior of miners, and take trade action more quickly. To sum up, the two periods study confirms the robustness of our models’ results.
Table 6. The result of three models
Notes: The marks *, ** and *** represent the coefficient significance levels at 10%, 5% and 1%, respectively.
Table 7: The results of the Granger causality test for variables.
Table 8. The result of models in different periods
Notes: The marks *, ** and *** represent the coefficient significance levels at 10%, 5% and 1%, respectively.
Conclusion
In this paper, we analyze the causes of bitcoin price dynamics, especially, focus on the contribution of miners behavior. Miners have two main affairs in our work: mining and investment in the form of hoarding bitcoin. And from our results, hoarding behavior has special relationships with bitcoin price. Furthermore, because of the characteristics of the variables, we employ the Autoregressive-Distributed-Lag Model among bitcoin, hoarding behavior and other meaningful variables.
The previous studies have already extensively discussed the bitcoin price formation, our work enrich the study in this field by shedding insights into bitcoin miners hoarding behavior. The results in this paper show that bitcoin price and miners hoarding behavior have a bidirectional influence on each other and hoarding behavior could explain 98.26% of the price alone during our test period. We find the hoarding behavior has a negative relationship with bitcoin price in the short-term and the first order lag of it has a positive relationship with bitcoin price; the results indicate that hoarding behavior of miners can influence the bitcoin system from both supply-side and emotional aspects of participants. For one thing, miners hoarding behavior could influence the supply of bitcoin obviously. And just as Buchholz et al. (2012) maintain that the bitcoin supply determines the total size of flow in circulation so relates to bitcoin price. For another, miners hoarding behavior could be seen as a kind of speculation and have effects on the judgements and moods of participants, then could influence the decisions of trade and thus cause price variability. Consequently, it is logical that miners hoarding behavior affects bitcoin price through these two ways, and hoarding exactly has some predictive power for bitcoin price. These findings lead to a new way to consider bitcoin price fluctuation and provide valuable suggestions for policy makers, investors and speculators.
In addition, although it is specific that bitcoin price has a dependence structure with miners hoarding behavior, the reasons for the change of hoarding behavior need to be discussed further, thus we can have a deeper understanding of bitcoin price manufacture. We intend to examine the links between price and miners behavior more closely in the future.
References
Andreas M (2014) ‘Mastering Bitcoin: Unlocking Digital Cryptocurrencies’[Online], [Retrieved June 4, 2021] https://sci-hub.do/https://books.google.com/books?hl=zh-CN&lr=&id=IXmrBQAAQBAJ&oi=fnd&pg=PR4&dq=Antonopoulos,+Andreas+M.+2014&ots=9C9UrwGrNX&sig=3l49cnJsCUpJcR51eJK10_OaH-E.
Baek, C. and Elbeck, M. (2015) ‘Bitcoins as an investment or speculative vehicle ? A first look Bitcoins as an investment or speculative vehicle ? A first look’, pp. 37–41.
Baur, D. G., Hong, K. and Lee, A. D. (2017) ‘Bitcoin : Medium of Exchange or Speculative Assets ?’, Journal of International Financial Markets, Institutions & Money.
Bouoiyour, J. (2015) ‘What Does Bitcoin Look Like ?’, 492, pp. 449–492.
Buchholz, M., Delaney, J. and Warren, J. (2012) ‘Bits and bets, information, price volatility, and demand for Bitcoin’, Economics.
Cheah, E. T. et al. (2018) ‘Long Memory Interdependency and Inefficiency in Bitcoin Markets’, Economics Letters, 167, pp. 18–25.
Chen, C., Liu, L. and Zhao, N. (2020) ‘Fear Sentiment , Uncertainty , and Bitcoin Price Dynamics : The Case of COVID-19’, Emerging Markets Finance and Trade, 56(10), pp. 2298–2309.
Chen, W. et al. (2020) ‘Dependence structure between bitcoin price and its influence factors’, International Journal of Computational Science and Engineering, 21(3), pp. 334–345.
Ciaian, P., Rajcaniova, M. and Kancs, A. (2016) ‘The economics of BitCoin price formation’, 6846(February).
Cocco, L. and Marchesi, M. (2016) ‘Modeling and Simulation of the Economics of Mining in the Bitcoin Market’, pp. 1–31.
Fry, J. and Cheah, E. (2016) ‘International Review of Financial Analysis Negative bubbles and shocks in cryptocurrency markets’, International Review of Financial Analysis, 47, pp. 343–352.
Gandal, N. et al. (2018) ‘Price manipulation in the Bitcoin ecosystem’, Journal of Monetary Economics, 95, pp. 86–96.
Garcia, D. et al. (2014) ‘The digital traces of bubbles : feedback cycles between socio-economic signals in the Bitcoin economy’.
Goczek, Ł. and Skliarov, I. (2019) ‘What drives the Bitcoin price ? A factor augmented error correction mechanism investigation’, Applied Economics, 00(00), pp. 1–18.
Hayes, A. S. (2017) ‘Cryptocurrency value formation: An empirical study leading to a cost of production model for valuing bitcoin’, Telematics and Informatics, 34(7), pp. 1308–1321.
Hayes, A. S. (2019) ‘Bitcoin price and its marginal cost of production: support for a fundamental value’, Applied Economics Letters, 26(7), pp. 554–560.
Horra, L. P. De, Fuente, G. De and Perote, J. (2019) ‘The drivers of Bitcoin demand : A short and long-run analysis’, International Review of Financial Analysis, 62(October 2018), pp. 21–34.
Hou, B. et al. (2020) ‘A Study on Nine Years of Bitcoin Transactions : Understanding Real-world Behaviors of Bitcoin Miners and Users’, Proceedings of the 40th IEEE International Conference on Distributed Computing Systems (ICDCS’20), 134(1), pp. 91–109.
Kapar, B. and Olmo, J. (2021) ‘Analysis of Bitcoin prices using market and sentiment variables’, World Economy, 44(1), pp. 45–63.
Kristoufek, L. (2013) ‘BitCoin meets Google Trends and Wikipedia: Quantifying the relationship between phenomena of the Internet era’, Scientific Reports, 3, pp. 1–7.
Kristoufek, L. (2015) ‘What Are the Main Drivers of the Bitcoin Price ? Evidence from Wavelet Coherence Analysis’, pp. 1–15.
Kristoufek, L. (2020) ‘Bitcoin and its mining on the equilibrium path’, Energy Economics, 85, p. 104588.
Krueger, R. and Ha, J. (no date) ‘Measurement of Co-Circulation of Currencies’, Volume 199(Issue 034), p. 42.
Li, X. and Wang, C. A. (2017) ‘The technology and economic determinants of cryptocurrency exchange rates: The case of Bitcoin’, Decision Support Systems, 95, pp. 49–60.
Pesaran, M. H., Shin, Y. and Smith, R. J. (2001) ‘Bounds testing approaches to the analysis of level relationships’, Journal of Applied Econometrics, 16(3), pp. 289–326.
Polasik, M. et al. (2015) ‘Price fluctuations and the use of bitcoin: An empirical inquiry’, International Journal of Electronic Commerce, 20(1), pp. 9–49.
Vosen, S. and Schmidt, T. (2011) ‘Forecasting Private Consumption : Survey-Based Indicators vs . Google Trends’, 578(January), pp. 565–578.
Xu, J. et al. (2020) ‘Bitcoin miners: Exploring a covert community in the Bitcoin ecosystem’, Peer-to-Peer Networking and Applications.