In Indonesia, enterprise risk management (ERM) disclosure is mandatory and is expected to be substantial risk mitigation for investors. However, it becomes a question of whether the investors respond positively to ERM disclosure. ERM implementation requires the company’s resources that should impact its profitability. Thus, this study aims to provide empirical evidence of the effect of the ERM disclosure on company profitability and market value. Company profitability here is measured using Return on Assets (ROA), and the company’s market value is measured using Tobin’s Q Ratio. While ROA is profitability measured solely as report-based accounting, Tobin’s Q consists of investor responses to company performance. This research also evaluates whether ROA mediates the relationship between ERM and Tobin’s Q Ratio. We analyze 69 non-financial companies listed on the Indonesia Stock Exchange, the IDX80 Index 2019, using three years of data spanning 2018-2019. ERM value generated from the company’s annual report using content analysis. Using linear regression analysis, we found no significant effect on ERM implementation disclosure on ROA, but there is a significant negative effect on ERM’s implementation disclosure on Tobin’s Q Ratio. Meanwhile, the ROA itself positively affects Tobin’s Q, but ROA has no mediating role in the relationship between ERM and Tobin’s Q.
Firms operate under various risks, which gradually increase because of environmental change. These risks should be mitigated through a risk management process (Dwisaputra et al. 2020). Traditionally, risk management has been fragmented because companies organize their activities into functional areas. However, the global financial crisis of 2007-2009 increased regulatory efforts to enhance corporate risk management practices worldwide (Malik, Zaman, and Bucky, 2020). This risk management should be fully integrated into the strategic planning and the management’s decision-making processes of an organization (Ahmad, Ng, and McManus, 2014; Shad et al., 2019). Enterprise Risk Management (ERM) provides a novel approach to managing all risks a firm faces as a portfolio (Al-Amri and Davydov, 2016). The holistic approach of ERM allows the board to achieve a comprehensive view of the company’s risk exposures, thus, helping decision-makers to make more effective risk-adjusted strategic corporate decisions (Farrell and Gallagher, 2019; Shad et al. 2019; Setiawan, Dalimunthe and Rizkianto, 2019).
Research and discussions related to the application of ERM are more in the empirical study than theoretical. Theoretically, the application of ERM will increase management’s understanding of the overall risks faced by the company so that management can make better decisions to mitigate risk (Johnston & Soileau, 2020) and create value for stakeholders (Faisala & Hasan, 2020). Empirically, Hoyt & Liebenberg (2011) found a positive relationship between ERM implementation and a firm’s value. A similar conclusion comes from Florio & Leoni (2017), who stated that companies implementing more advanced ERM policies demonstrate improved business performance, financial performance, and market valuation.
However, how an ERM implementation would result in a better managerial decision is still a black box. Empirical studies were conducted to offer rational explanations. Among them are that an ERM implementation leads to better operational performance (Callahan & Soileau, 2017). Another explanation is that an ERM implementation would increase a firm’s reputation (Wang et.al., 2018; Perez-Cornejo et al., 2019; Malik et.al., 2020). A more progressive reason is that an ERM implementation would increase a firm’s ability to employ effective earning management (Johnston & Soileau, 2020).
Apart from being inconclusive regarding how the implementation of ERM affects the company’s performance, the performance measures used also vary. Some researchers use accounting reports and book value as performance measurements (Callahan & Soileau, 2017; Johnston & Soileau, 2020; Gonzales et al., 2020), while others use measures involving investor judgment and valuation as reflected in stock prices (Shad et al., 2019; Perez-Caronejo, 2019; Malik et al., 2020; Gonzales et al., 2020). Differences in performance measurements used to lead to different -even conflicting- conclusions. Lechner and Gatzert (2018) found that ERM’s implementation negatively correlates with performance measured with Return on Assets (ROA) but positively and significantly affects shareholder value. Ojeka et al. (2019) found that the implementation of ERM impacted company performance based on market evaluation, but no effect was found on performance as measured by accounting performance. Gonzales et al. (2020) did not find a significant relationship between a company’s ERM implementation to financial performance despite its roles to broader distance from the risk of bankruptcy.
The inconclusive evidence on ERM research raises questions on how ERM implementation and disclosure impact non-financial Indonesian firms. This study is motivated by the agency theory and signaling theory. From the perspectives of these theories, there is asymmetrical information between managers and their shareholders. Managers have proprietary information about their firm that is not accessible to shareholders. The board’s disclosure of the ERM implementation aims to reduce the information asymmetry problem. Devi et al. (2017) stated that ERM disclosure reduces asymmetric information to better reflect a company’s fair value.
ERM requires sufficient methods to identify and quantify the risks at hand. Also, there are stricter regulations for companies to implement adequate risk management. The Risk Management Society (RIMS) states that there are four critical outcomes that management expects from implementing ERM; namely: (1) identifying risks, (2) minimizing unexpected events and reducing losses, (3) integrating risk appetite and company strategy, and (4) as evaluation materials for investors and stakeholders (regulators). However, in their survey on 397 respondents and 15 different industries, Righi and Fox (2017) found that only 24% of the respondents stated they had fully integrated an ERM program.
In Indonesia, risk management application refers to risk management system standards, namely COSO ERM: 2004 and ISO 31000: 2009. Indonesian Central Bank (Bank Indonesia, BI) also stipulates BI Regulation No. 8/14 / PBI / 2006, which has subsequently been amended to become BI Regulation No. 8/14/2006 regarding implementing Good Corporate Governance (GCG), including risk management disclosures. Apart from BI regulations, the Ministry of State-Owned Enterprises Regulation No.1 / 2011 also requires all Indonesian government-owned enterprises (Badan Usaha Milik Negara, BUMN) to implement a risk management system. The existing regulations are further strengthened in the Financial Services Authority Regulation No. 17 / POJK.03 / 2014 dated 18 November 2014 and the Financial Services Authority Circular Letter No. 14 / SEOJK.03 / 2015 regarding the Implementation of Integrated Risk Management for Financial Conglomerates. With existing regulations, all companies in Indonesia must have a Risk Management Committee, not-only banks, and financial firms. However, not all companies have implemented ERM fully.
This study aims to obtain empirical evidence of ERM implementation and disclosure on a company’s profitability and value. Although regulations related to ERM in Indonesia have been implemented since 2014, empirical studies regarding this topic are not easily found in international publications. Moreover, studies related to risk management in Indonesia are primarily carried out in the banking and insurance industries. There are rarely studies on non-financial companies. This research was conducted on companies listed on the Indonesia Stock Exchange, IDX80 index, using data from the 2018-2019 period. Specifically, this study answers whether a firm’s profitability mediates the relationship between ERM implementation and firm value. This research differs from Shad et al. (2019) regarding the firm’s performance measurement. While Shad et al. (2019) analyze the impact of ERM implementation on firms’ Economic Value Added (EVA), we specifically evaluate the ERM implementation on investors’ behavior. Previously, Malik et al. (2020) evaluated how ERM implementation relates to firms’ performance measured with Tobin’s Q. Malik et al. (2020) argue that positive relationships indicate investors’ positive expectations upon long term performance of firms implementing ERM. However, we questioned how this conclusion occurs in the Indonesian stock market, mainly because ERM implementation requires cost. Ultimately, investors bear the ERM implementation cost. In this study, an evaluation of the role of ROA was employed to explain the effect of ERM implementation on performance involving investor response (Tobins’ Q). Previously, many studies evaluated the role of mediating variables to provide a more robust explanation regarding the relationship between ERM implementation and company performance (Callahan, & Soileau, 2017; Nguyen, & Vo, 2020; Wang et al., 2020).
This article is organized into five parts. After describing the research background in the first section, the literature review is presented in the second section. The third part describes the research design, followed by the results and discussion in the fourth section. In conclusion, the limitations of the research and further research are presented in the last section.
Hypothesis Development
The Objective of the ERM Implementation
There are different versions of the ERM definition. According to Nocco & Stulz (2006), ERM is a process that identifies, assesses, and manages individual risks within a coordinated and strategic framework. According to Ahmad, Ng and McManus (2014), one of the most common ERM frameworks is the Committee of Sponsoring Organizations of the Treadway Commission (COSO). COSO (2004) defined ERM as follows:
Enterprise risk management is a process, effected by an entity’s board of directors, management, and other personnel, applied in strategy setting and across the enterprise, designed to identify potential events that may affect the entity, and manage risk to be within its risk appetite, to provide reasonable assurance regarding the achievement of entity objectives.
According to Lechner and Gatzert (2017), ERM implementation aims to increase business value by supporting senior management to identify and manage the company’s overall risk. ERM strategically treated risks both as exposures to be managed and opportunities to be exploited (Farrell and Gallagher, 2019). ERM implies a change in managing risks from a fragmented approach to an integrated and wide-ranging approach (González, et al., 2020).
Faisala & Hasan (2020) stated that the ERM implementation is important to create value for stakeholders. Florio & Leoni (2017) stated that companies implementing more advanced ERM policies demonstrate improved business performance, both in financial performance and market valuation. However, there is conflicting evidence on the impact of ERM implementation on firm value. Hoyt & Liebenberg (2011) found a positive relationship between ERM and firm value on the U.S. publicly traded insurers. Malik et al. (2020) found a positive relationship between ERM implementation and company performance in the UK. Meanwhile, Tahir and Razali (2011) found positive but insignificant evidence on the relationship, and Gonzales et al. (2020) showed that the adoption of ERM among Spanish companies does not relate to the company’s profitability or reduces the probability of bankruptcy. In contrast, Lechner and Gatzert (2018) found that ERM’s implementation negatively correlates with ROA but positively and significantly affects shareholder value.
Besides the inconclusive findings regarding the impact of ERM implementation on firm value, the ERM implementation mechanism to create value is also unclear. According to Hoyt and Liebenberg (2011), positive relation between ERM and firm values comes from avoiding duplication cost of risk management separately. Meanwhile, a positive relationship between ERM implementation and company performance comes from a strong risk committee’s presence on the board of directors (Malik et al., 2020). Kanu (2020) found that ERM implementation does not relate to performance unless it is part of its strategic planning. Based on the previous studies above, we propose a hypothesis:
H1: ERM implementation has a positive relationship with company profitability.
Asymmetric Information and Signaling Theory
Asymmetric information occurs when the information obtained by all parties is uneven when one party gets more or less information than the other. Managers have proprietary information about their firm that is not accessible to shareholders. The risks faced by a company are not understood symmetrically by management and other stakeholders. This asymmetric information causes shareholders to misjudge the value of a firm.
According to Brigham and Houston (2008), companies provide information to outside parties such as investors and regulators. This information acts as a signal from the company. Signaling theory emphasizes that every piece of information must be relevant, complete, precise, and accurate so that investors can use it to analyze the company for further decision-making as to whether to invest in the capital market. Signaling theory overcomes asymmetric information problems.
The board’s disclosure of the ERM implementation aims to reduce the information asymmetry problem. ERM implementation and disclosure show commitment to risk management, which investors perceive as a positive signal (Hoyt & Liebenberg, 2011). Signals or information regarding risk profiles and commitment to managing risks are beneficial for companies in creating investment opportunities and drawing in investors. ERM disclosure reduces asymmetric information to reflect better a company’s fair value (Devi et al., 2017). Based on the previous studies above, we propose a hypothesis:
H2: The disclosure of ERM implementation is positively related to the company’s market value.
and
H3: Company profitability mediates the relationship between ERM implementation and the company’s market value.
Method
Research Data
This study analyzes companies listed on the Indonesia Stock Exchange, the IDX80 Index in 2019. The data was generated from companies’ annual financial reports and the closing stock prices during the study period, 2018-2019. We obtain financial and non-financial data from the Indonesia Stock Exchange website, company websites, RTI Business website, Yahoo! Finance, and Bloomberg.
ERM disclosure used in this study comes from the companies’ annual reports. We use the content analysis method by calculating the number of ERM items disclosed. A value of 1 is given for an ERM item if it is disclosed and 0 if it is not. ROA is obtained from each company’s annual financial statement, while Tobin’s Q calculation uses the average closing price of stocks in March of the following year.
We use the purposive sampling method in determining the sample to be analyzed. Several companies were excluded from the sample because they did not meet predetermined criteria. We include 69 companies with complete data to analyze in our study.
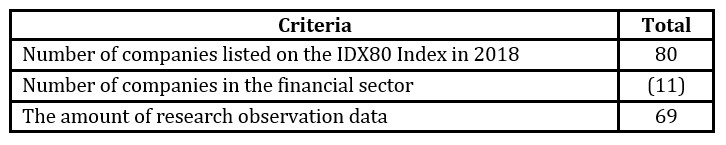
Table 1. Number of Observation
Table 1 summarizes the number of research observations (80) generated from 2018. In the sample, there are 11 banking companies and 69 non-banking companies. Thus, the number of companies in our research sample is 69.
Empirical Model
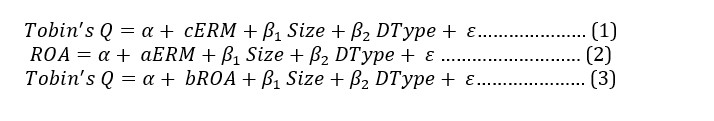
Disclosure of ERM in this study acts as an independent variable. In this study, company market value measured by Tobin’s Q Ratio acts as a dependent variable. Then, profitability, as measured by ROA, acts as a mediating variable. The research model is evaluated by controlling the firm size and business type (manufacturing and non-manufacturing). This research was conducted using the following models:
Where:
Tobin’s Q = Company’s market value measured by Tobin’s Q Ratio
ERM = ERM score, Disclosure of ERM implementation
ROA = Profitability measured by Return on Asset
Size = Company’s size, measured by ln of Total Assets
DType = Dummy variable of business type, 1 for manufacture and 0 otherwise
ε = Error
ERM disclosure is measured using a content analysis approach using its data generated from annual reports and its website. COSO (2004) defines the Enterprise Risk Management framework as having 108 ERM disclosure items covering 8 ERM dimensions. Those dimensions are (1) the internal environment, (2) objective setting, (3) event identification, (4) risk assessment, (5) risk response, (6) control activities, (7) information and communication, and (8) monitoring. A dummy value measures each disclosure item. A value of 1 is given for the ERM item disclosed and 0 if it was not disclosed. The values are then added together and divided by 108 (the total ERM items that should be disclosed) to obtain each company’s ERM disclosure score.
This study’s dependent variable is Tobin’s Q ratio, representing company value that contains elements of how investors respond to company actions. Tobin’s Q is calculated by comparing its stock price with its equity book value. Bhagat & Black (2002) stated that a higher value of Tobin’s Q means that the company’s management has succeeded in creating considerable market value resulting from the utilization of its assets. Tobin’s Q is a measure of market value used by Tahir and Razali (2011), Wang et al. (2017), Anton (2018), Farrel and Gallagher (2019), and Gonzales et al. (2020). Tobin’s Q ratio is calculated by adding its market value and debt, divided by its total assets.
where:
Market Value = The market value of all outstanding shares obtained from multiplying the share price by the number of shares outstanding. In this study, Tobin’s Q calculation uses the average closing price of stocks in March of the following year.
This study also analyzes the mediating role of profitability as measured by ROA. ROA is a measure of financial performance that shows how companies generate profits from their assets. ROA calculated as follows:
We perform regression analysis and testing of mediating variables using the causal step method:
Perform a linear regression on the independent variable (X), here ERM, on the dependent variable (Y), here Tobin’s Q, using the equation:
Perform a linear regression on the independent variable (X), here ERM, on the mediating variable (M), here ROA, using the equation:
Conclude the mediating role of the variable.
Results and Discussions
This section reports summary statistics on the main variables of the tested models.
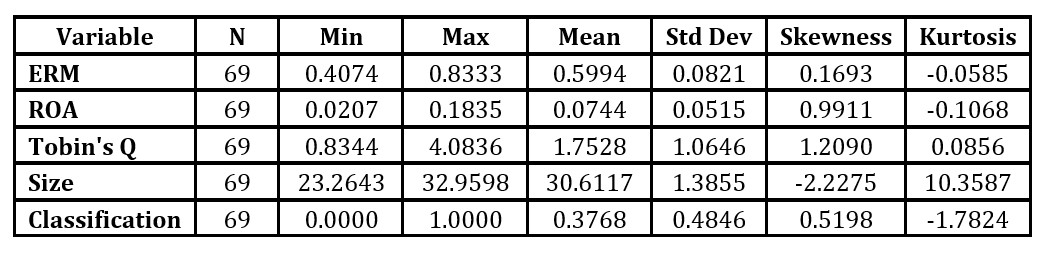
Table 2. Descriptive Statistics for Variables Employed in Analysis
The descriptive statistics in Table 2 show that the value of ERM disclosure at 69 Indonesian companies studied has an average value of 0.5994, with the lowest ERM disclosure value of 0.4074 and the highest of 0.8333. ROA has an average value of 0.0744, with the lowest ROA of 0.0207 and the highest of 0.1835. The company value represented by Tobin’s Q Ratio variable has an average value of 1.7528, with the lowest value of 0.8344 and the highest of 4.0836. The Skewness and Kurtosis values for ERM disclosure, ROA and Tobin’s Q Ratio, were approximately 0. Thus, we conclude that each variable studied is normally distributed.
The highest value of ERM disclosure in the study sample was 83.33 %, indicating that the company has disclosed 83.33% of all existing ERM disclosure items in that year. Meanwhile, the lowest value of ERM disclosure found in this study was 40.74%.
To test the hypothesis, we performed linear regression with three regression steps. The result is presented in the following table.
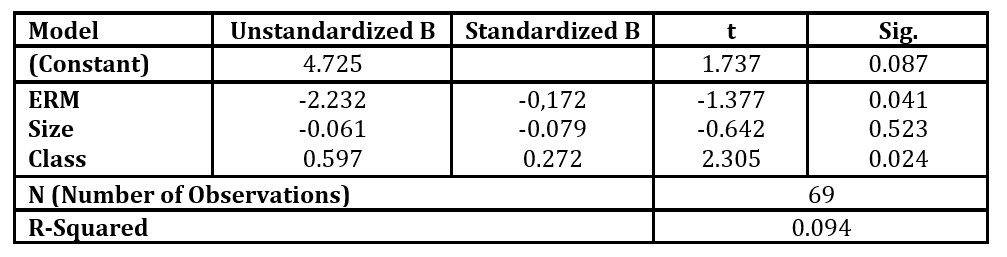
Table 3. Regression Results of ERM on Tobin’s Q Ratio
Table 3 shows that the ERM variable has a negative and significant effect on Tobin’s Q Ratio with a regression coefficient of -2.232. These results indicate that for every unit increase in ERM score, Tobin’s Q ratio decreases by 2.232. Besides, the statistical test result shows that ERM has a significant effect on Tobin’s Q Ratio with a confidence level of α = 5%. This finding means that with the increase in ERM disclosure, the company value as measured by Tobin’s Q ratio decreases. This finding indicates that ERM implementation is perceived as a negative signal by investors, regardless of the company’s size. Table 3 also shows significant results regarding the business classification variable with a positive coefficient. This finding means that Tobin’s Q ratio on manufacturing firms is significantly higher than Tobin’s Q on non-manufacturing firms.
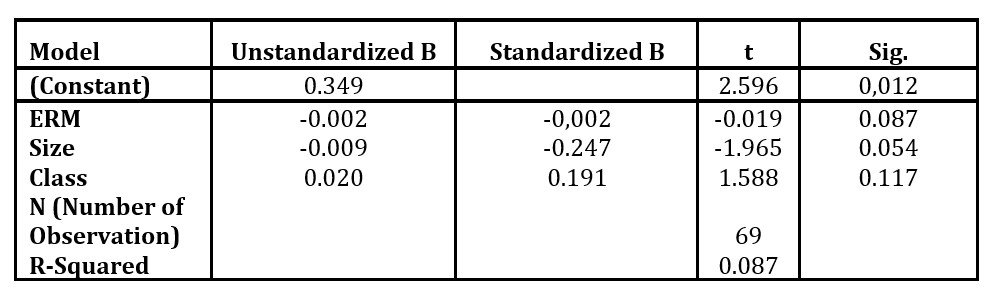
Table 4. Regression Results of ERM on ROA
Table 4 shows that the ERM variable has a negative but insignificant effect on ROA, with a regression coefficient of -0.002. However, the statistical test result shows that ERM does not significantly affect ROA with a confidence level of α = 5%, but significant with a confidence level of α = 10%. As shown in table 4, the model controls the firm’s size and classification, that there is a negative relationship between the company’s size and ROA. These results indicate that the higher the ERM implementation, the lower the company’s profitability. This finding may be due to the costs involved in implementing ERM. This finding supports Gonzales et al. (2020) and Kanu (2020), who found that ERM implementation is not significantly related to firm performance measured with ROA. However, this finding differs from Farrell and Gallagher (2019), who found a positive relationship between ERM implementation and a company’s performance measured with ROA
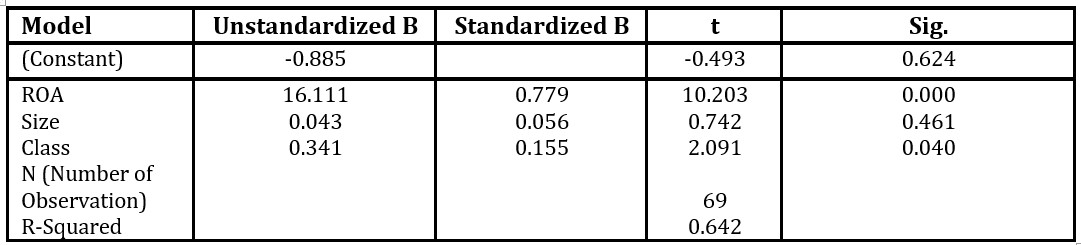
Table 5. Regression Results of ROA on Tobin’s Q Ratio
The regression results of ROA on Tobin’s Q ratio are shown in Table 5. We conclude that the ROA variable has a positive and significant effect on Tobin’s Q Ratio, with a regression coefficient of 16.111. These results indicate that ROA significantly affects Tobin’s Q with a confidence level of α = 5%. When a company is profitable, investors perceive this as a positive signal, which serves as a consideration in making investment decisions. Table 5 shows that the model has controlled firms’ size and classification variables.
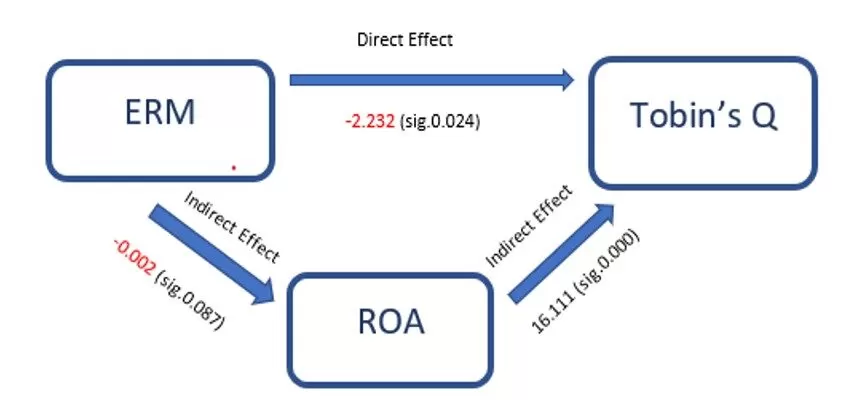
Figure 1 summarizes the relationship between ERM and Tobin’s Q, between ERM and ROA, and between ROA and Tobin’s Q. Evaluating those three relationships provides a better understanding of whether ROA mediates the relationship between ERM and Tobin’s Q ratio. In other words, to evaluate whether the investors respond to ERM implementation due to the company’s profitability or other factors.
Figure 1. The Mediating role of ROA
Figure 1 presents the mediating role of ROA in the relationship between ERM and Tobin’s Q. We examine this role as Idris & Mohezar (2019). Directly, the coefficient of the relationship between ERM and Tobin’s Q is -2.232 with sig 0.024. Then, the correlation coefficient between ERM and ROA is -0.002 (sig 0.087), and the coefficient of the relationship between ROA and Tobin’s Q is 16.111 (with sig 0.000). Thus, the indirect relationship between ERM and Tobin’s Q is calculated as follows:
In other words, the mediating role of ROA is 1.44% compared to the direct relationship between ERM and Tobin’s Q. We conclude that ROA does not mediate the relationship between ERM and Tobin’s Q (no mediating role). This finding means that investors respond negatively to ERM disclosure without considering how ERM implementation impacts profitability.
Conclusions and Recommendations
Conclusions
This research finds that investors of non-finance companies in the Indonesia Stock Exchange negatively assess a company’s ERM implementation disclosure. This finding contradicts the expectation that ERM implementation is a positive signal that the firm manages its risk adequately. This finding may be because investors perceive a high ERM score to indicate that a company faces a higher risk. On another side, ERM implementation involves costs that impact company profits negatively. However, even though ERM implementation relates negatively to company profit, the relationship between ERM implementation and ROA is not statistically significant. In other words, despite the fact that ERM implementation does not relate to a company’s profitability, investors responded negatively to the ERM disclosure. However, this research limits the analysis of ERM disclosures based on COSO’s framework. None of the companies in this study disclosed all aspects of the ERM dimension. Some Indonesian companies do not implement ERM nor disclose it.
Recommendations
Findings in this study raise the question of whether investors in the Indonesia Stock Exchange view ERM implementation as not crucial in non-financial firms, or whether investors perceived that the indicators used are not sufficiently appropriate to manage risks. The perception that companies with high ERM disclosure values inherently have high risks may encourage investors to shift their investments to those with lower risks. Another possible explanation, the company’s risk disclosure might not be backed with complete information regarding the risk mitigation. Further research is needed to answer these questions.
References
Ahmad, S., Ng, C., and McManus, L.A (2014). Enterprise Risk Management (ERM) Implementation: Some Empirical Evidence from Large Australian Companies, Procedia – Social and Behavioral Sciences, 164. 541-547.
Al-Amri, K. and Davydov. Y. (2016) Testing the effectiveness of ERM: Evidence from operational losses. Journal of Economics and Business, 87. 70-82.
Anton, S. G. (2018). The Impact of Enterprise Risk Management on Firm Value: Empirical Evidence from Romanian Non-financial Firms. Engineering Economics, 29(2). 151-157.
Bhagat, S., and Black, B. (2002). The Non-Correlation between Board Independence and Long-Term Firm Performance. Journal of Corporation Law, 27. 231-273.
Brigham, E. F., and F.Houston, J. (2008). Essentials of Financial Management. Singapore: Seng Lee Press.
Callahan,C., and Soileau, J. (2017). Does Enterprise Risk Management Enhance Operating Performance? Advances in Accounting 37, 122–139. DOI: 10.1016/j.adiac.2017.01.001.
Dwisaputra, I., Rizkianto, E. & Dalimunthe, Z. (2020). Does Financial Leverage Mediate the Effect of Corporate Governance on a Firm’s Performance: Indonesia Case. Proceedings of the 35th International Business Information Management Association Conference (IBIMA), ISBN: 978-0-9998551-4-0, 1-2 April 2020, Seville, Spain, 572-583.
Faisala, M., and Hasan, N. N. (2020). Enterprise Risk Management and Firm Value: The Case in Emerging Market. International Journal of Innovation, Creativity, and Change, 11 (6). 272-286.
Farrell, M. and Gallagher, R. (2019). Moderating influences on the ERM maturity-performance relationship. Research in International Business and Finance, 47. 616-628.
Florio, C., and Leoni, G. (2017). Enterprise risk management and firm performance: The Italian case. The British Accounting Review, 49 (1). 56-74.
González, L.O., Santomil, P.D., and Herrera, A.T. (2020). The effect of Enterprise Risk Management on the risk and the performance of Spanish listed companies. European Research on Management and Business Economics 26 (3). 111-120
Idris, S. and Mohezar, S. (2019). Sustaining Businesses in a Global Turbulent Environment: The Role of Information Sharing. Management & Accounting Review 18(1), 25-40.
Johnston, J., and Soileau, J. (2020). Enterprise Risk Management and Accruals Estimation Error. Journal of Contemporary Accounting & Economics 16(3):100209. DOI: 10.1016/j.jcae.2020.100209.
Lechner, P. and Gatzert, N. (2018). Determinants and Value of Enterprise Risk Management: Empirical Evidence from Germany. European Journal of Finance24 (10). 867-887.
Malik, M.F., Zaman, M., and Buckby, S. (2020). Enterprise risk management and firm performance: Role of the risk committee, Journal of Contemporary Accounting & Economics, 16 (1), 100178.
Metta, M., Dalimunthe, Z., and Prabowo, H. (2020). Does Trust in an online Marketplace Means Trust in Online Investing? Proceedings of the 35th International Business Information Management Association Conference (IBIMA), ISBN: 978-0-9998551-4-0, 1-2 April 2020, Seville, Spain, 531-539.
Nguyen, D.K., and Vo, D.T., (2020). Enterprise Risk Management and Solvency: The Case of the Listed EU Insurers. Journal of Business Research 113, 360–69. DOI: 10.1016/j.jbusres.2019.09.034.
Nocco, B.W., and Stulz, R.M. (2006), Enterprise Risk Management: Theory and Practice. Journal of Applied Corporate Finance, 18 (4). 8-20.
Ojeka, S.A., Adegboye, A., Adegboye, K., Alabi, O., Afolabi, M., and F. (2019). Chief Financial Officer Roles and Enterprise Risk Management: An Empirical Based Study. Heliyon 5(6), e01934. DOI: 10.1016/j.heliyon.2019.e01934.
Pérez-Cornejo, C., Esther de Quevedo-Puente, E., and Delgado-García, J.B. (2019). How to Manage Corporate Reputation? The Effect of Enterprise Risk Management Systems and Audit Committees on Corporate Reputation. European Management Journal 37(4):505–15. DOI: 10.1016/j.emj.2019.01.005.
Setiawan, A., Dalimunthe, Z., and Rizkianto, E. (2019). Bankruptcy risk among Indonesian stock exchange-listed companies. Fin. Bank. Rev.4 (4), 122–127
Tahir, I. M., and Razali, A. R. (2011). THE RELATIONSHIP BETWEEN ENTERPRISE RISK MANAGEMENT (ERM) AND FIRM VALUE: EVIDENCE FROM MALAYSIAN PUBLIC LISTED COMPANIES. International Journal of Economics and Management Sciences1 (2). 2-41
Triono, R. A., Dalimunthe, Z., and Arif, H. (2018). Can traditional retailers use strategy to fight against modern attacks? AFEBI Management and Business Review, 3(1), 1-15.
Wang, T. S., Lin, Y.M., Werner, E.W., and Chang, H. (2018). The Relationship between External Financing Activities and Earnings Management: Evidence from Enterprise Risk Management. International Review of Economics & Finance 58, 312–29. DOI: 10.1016/j.iref.2018.04.003.