Faculty of Management and Business, University of Prešov, Prešov, Slovakia
Volume 2025,
Article ID 510338,
Journal of Financial Studies and Research,
11 pages,
DOI: https://doi.org/10.5171/2025.510338
Received date: 11 November 2024; Accepted date: 20 February 2025; Published date: 22 May 2025
Cite this Article as:
Martina Mokrišová and Jarmila Horváthová (2025)," Key Financial Performance Indicators of the Slovak Construction Industry: The Assumption of Prosperity", Journal of Financial Studies & Research, Vol. 2025 (2025), Article ID 510338, https://doi.org/10.5171/2025.510338
A precondition for the existence, stability, and competitiveness of enterprises is their performance. In measuring the performance of enterprises, the priority is mainly to monitor and measure their financial performance. The values of financial indicators reflect all the consequences of ongoing processes in the enterprise. Based on the above, the motivation of the research was to identify key performance indicators within the construction industry of Slovakia. The Slovak construction industry makes up a significant part of Slovakia’s GDP, and therefore it is very important to monitor its performance. The selection of key financial performance indicators was carried out using Elastic net and in the second step of selection using Decision tree (DT), Gradient boosted tree (GBT) and AdaBoosted tree (ABT). The results of these methods show very good classification accuracy. The selection of key financial performance indicators includes the Working Capital to Total Assets, Current Ratio and Total Debt to Total Assets, which have been confirmed in several studies as important indicators of the financial performance of construction companies. The identified indicators may be significant for managing the financial performance of these enterprises in practice
Designing an effective Performance Measurement System is an important element of the success of any business. Several approaches or frameworks have been developed for building and managing BPM systems, with the dominant one – the Balanced Scorecard framework (Kaplan and Norton, 1996), which is still used today (Kellen, 2003). A special part of the business performance measurement system is the measurement of the financial performance of enterprises. The financial performance of the enterprise represents the use of funds generated from its business activities, resulting in a subsequent increase in profit in order to ensure the financial health of the enterprise. The measurement of financial performance should be understood as a way to achieve the financial success of the enterprise. Selected financial indicators are applied to measure financial performance, which allow a static and dynamic quantitative description of a certain economic and financial activity of the enterprise. To measure financial performance, the enterprise selects methods and tools that it uses to measure financial performance and obtains and gradually processes the input of financial values that are necessary for the measurement.
Most appropriate financial ratios for performance evaluation methods are mostly selected using two main streams. First one is domain knowledge approach (Zelenkov et al., 2017). Second approach uses various mathematical and statistical methods or data mining techniques; we can differentiate between filter, wrapper, embedded and combined methods (Liu et al., 2018). Within filter methods, t-test, correlation analysis or stepwise methods are frequently used. Wrapper methods use machine learning algorithms like decision trees, Naïve Bayes or genetic algorithms. Embedded methods integrate features selection and learning procedures. Among them we can mention regularization approaches which have recently come to the fore (Mokrišová and Horváthová, 2023), for example Lasso or Elastic net. Combined methods use different type of features selection techniques.
Our intention, based on previous research, is to select financial indicators using the elastic net method and apply them in performance measurement using decision trees and ensemble classifiers which use decision trees as base learners. The aim is to find out which financial features are the performance determinants for the construction industry. Here it is possible to see a gap in the research, since the financial performance of a large sample of enterprises was examined, which makes it possible to obtain a significant generalization of the results for a given industry using ensemble classifiers applied only in a few studies.
The rest of the paper is organized as follows: Section “Literature review” lists the applications of selected methods in financial performance evaluation. Section “Data and methodology” outlines selected financial performance features as well as applied methods. Section “Results” presents the results of features selection and building performance evaluation models. Section “Discussion” provides a more detailed discussion of the achieved results. Section “Conclusion” offers conclusions and theoretical and practical benefits of the research.
Literature Review
The primary goal of every business owner should be to assess the financial performance of the company as quickly and easily as possible. Accordingly, it is important to determine whether the company is able to increase its value and to guarantee the owners that the investment in the company will return. The question remains how to measure and predict the financial performance of the company. It is necessary to proceed from the definition of this term, which represents the achievement of a positive financial situation of the company for a certain period, including the collection and allocation of finance, measured by capital structure, liquidity, solvency, activity, leverage and profitability. Financial performance represents the ability of a company to manage and control its equity. Cash flow, balance sheet, profit and loss statement or capital structure can be the basis of information for business managers when they decide how to achieve the required financial performance. Financial performance can be assessed using three basic approaches: using selected financial indicators, using indicator systems, and thirdly using mathematical and statistical models (Kislingerová et al., 2011). Türegün (2022) used financial indicators in his research aimed at measuring financial performance. He pointed out that these indicators provide a standardized technique for comparing companies and industries. According to Türegün (2022), the use of ratios is also appropriate because these indicators put all organizations on the same level and assess them based on their financial performance instead of their size, sales volume or market share. Hopwood (1972) believes that financial indicators are also important motivational factors for employees of a company. Kaplan and Atkinson (1998) point out two main reasons for the wide use of financial performance indicators. These are indicators that are clearly linked to the measurement of financial performance, as they are designed to monitor the achievement of long-term financial goals, such as profit, which is related to the long-term financial goals of the organization. In addition, correctly selected financial performance indicators provide a summary view of the overall performance of the organization. The importance of applying financial indicators in measuring the financial performance of companies is also emphasized by Kotāne and Kuzmina-Merlino (2012). More recent research focused on examining financial performance with the application of selected financial indicators can be mentioned (Vibhakar et al., 2020). Currently, authors apply not only financial indicators to assess financial performance, but also indicators that are based on the application of economic profit (Jacková, 2021).
Even in modern research on financial performance measurement, many authors apply selected financial indicators, but they use these indicators as inputs to various mathematical and statistical models as well as AI models, which either measure the financial performance of companies or analyze the relationship between significant determinants and financial performance. It is possible to mention the application of traditional machine-learning methods – multiple regression and logistic regression. These methods were applied in the study by Chiadamrong and Wattanawarangkoon (2023). In their study, they tried to develop a financial performance prediction model that examines the relationship between the determinants of internal performance and financial performance of public companies before and after the companies’ participation in the Stock Exchange of Thailand (SET). In this regard, it is worth mentioning the research of Babalola (2013), who applied a multiple regression model and revealed evidence indicating that larger public manufacturing companies in Nigeria show higher return on assets (ROA). Logistic regression has also been applied in research on financial performance of companies by Omondi-Ochieng (2021). Since traditional machine-learning methods may not achieve satisfactory performance when handling unbalanced, high-dimensional or noisy data (Horváthová and Mokrišová, 2024), research is currently moving towards decision trees and neural networks, which are among the most commonly used data mining techniques (Killi and Isik, 2023). We can mention the study of Manogna and Mishra (2022) who applied four popular decision tree algorithms to assess financial performance of Indian manufacturing companies. Wenjing (2022) constructed a comprehensive performance evaluation method for enterprises using Analytical Hierarchy process and back-propagation neural network theory. In recent years, ensemble classifiers, random forests and deep neural networks are coming to the fore when measuring performance. Warni et al. (2024) measured performance of business partners using XGBoost, Adaboost and Gradient Boosting. XGBoost achieved the best performance compared to other models. Creamer and Freund (2010) compared the performance results of Latin American companies using Adaboost with logistic regression, bagging, and random forests. They showed how the boosting methodology, with either small or large samples, is able to select a combination of accounting and corporate governance features which determine performance. Lee et al. (2017) proposed network-based corporate performance prediction model using deep neural network. They used financial and patent indicators of companies as predictors. Supsermpol et al. (2023) demonstrated that random forest algorithm outperforms logistic regression in predicting financial performance.
Data and Methodology
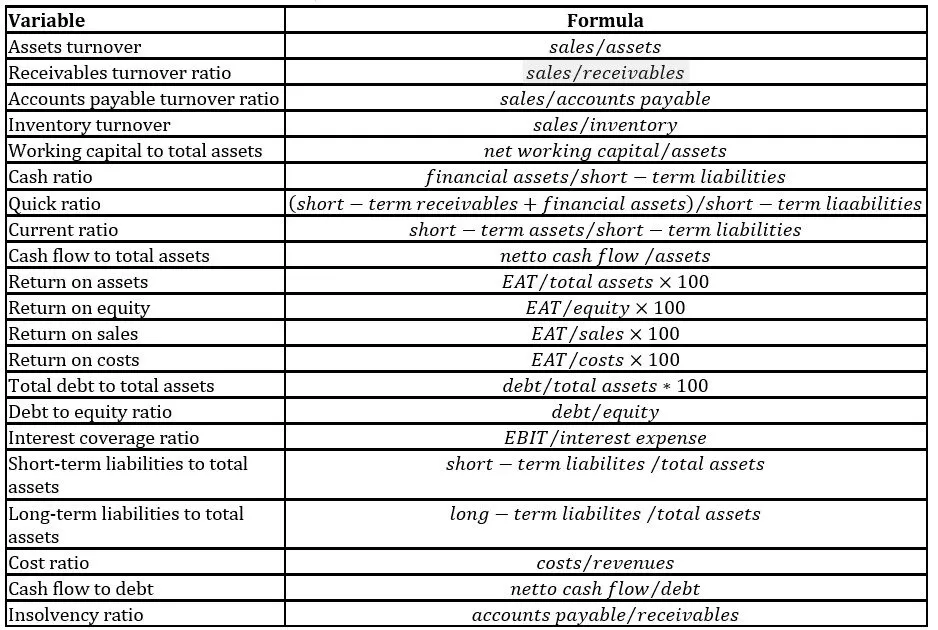
Construction industry is a globally important industrial sector that makes up a significant part of the gross domestic product (GDP) and total employment of most countries. Regarding Slovak construction industry, Elexa et al. (2023) argue that it significantly contributes to the growth of the Slovak economy. In many ways, Slovak construction industry is comparable to other EU countries, especially when it comes to the range of materials used, the technical and architectural level of the buildings, the speed of construction and the quality of construction works (Elexa et al., 2023). Due to similar historical background and economic conditions, Czech construction industry has several features in common with the Slovak construction industry. Construction industry faces several challenges, including lack of a qualified workforce (Elexa et al., 2023), rising costs of material (MFSR, 2023) or regulatory inefficiencies. From the financial point of view, companies doing a business within these industries deal with high indebtedness (Horváthová and Mokrišová, 2024) as well as long maturity of invoices (Rybárová et al., 2016). Evaluation and prediction of financial performance of these companies is therefore a crucial issue. The research sample in this study consisted of 19 248 Slovak and Czech construction companies. The database of the data from the financial statements of these companies for the year 2022 was provided by CRIF (2024). When dealing with outliers, IQR (Interquartile Range) rule was used. After removing outliers, the sample of 18,061 companies was further analyzed. The starting point for the analysis was financial ratios from all areas of financial performance evaluation (see Table 1).
Table 1: Initial set of financial ratios
Source: Manogna and Mishra, 2022; Türegün, 2022, Horváthová and Mokrišová, 2024; Thacker and Saha, 2024
To determine the assumption of prosperity, selected financial criteria were used: ; ; . Companies which met all these criteria were classified as non-prosperous. We identified 2,115 non-prosperous and 15,946 prosperous companies in the research sample.
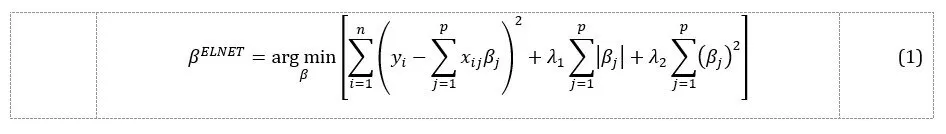
Most appropriate financial features for performance evaluation were selected with the use of Elastic net algorithm proposed by Zou and Hastie (2005). Elastic net regularization is a modification of multiple linear regression approaches designed for feature selection from high-dimensional datasets. It automatically selects variables using two penalty terms () and performs continuous shrinkage to improve prediction accuracy (Amini and Hu, 2021). The elastic net estimate of the regression coefficients can be written as (1) (Al-Jawarneh et al., 2021):
where is the j-th predictor variable of the i-th observation, is the i-th response variable, is the regression coefficient of the j-th variable, n is the number of cases, p is the number of variables, and are the tuning parameters automatically selected using k-fold cross validation.
Selected features were used as inputs for financial performance evaluation using decision trees. A decision tree is a non-linear and non-parametric discrimination method which uses a set of independent variables to divide the sample into smaller subsets, which are increasingly popular because of their intuitive interpretability characteristics (Olson et al., 2012). Various decision tree algorithms can be used, one of the most successful ones is CART algorithm (Ghiasi et al., 2020) applied in this study. The construction of the classification tree using CART is based on binary partitioning of attributes (Anyanwu and Shiva, 2009). In this study, the optimized version of CART algorithm, which is implemented in Python library Scikit-learn, was used.
In the mathematical formulation of decision tree, we consider training vectors and a label vector , a decision tree recursively partitions the feature space in such a way that the samples with the same labels or similar target values are grouped together. Let the data at node be presented by with samples. For each candidate split consisting of a feature and threshols , partition the data into and subsets as follows (4) (Scikit-learn, 2023):
To determine the quality of a candidate split of node , Gini coefficient was used. To improve the classification accuracy of decision tree, two boosting algorithms were applied – the currently most widely used boosting algorithm AdaBoost (Mayr et al., 2014), and powerful boosting algorithm Gradient boosting, introduced by Friedman (Friedman, 2001).
When selecting features and building performance evaluation models, 80% of data were used for training (training set) and 20% for testing (test set). To ensure that prosperous and non-prosperous companies are equally distributed between these sets, K-fold (N=5) cross-validation was used. Performance of decision tree and boosting methodologies was evaluated using Precision, Recall, Accuracy, F1-score and AUC. Precision measures a model’s ability to separate positive and negative examples; Recall measures a model’s ability to identify positive examples; Accuracy is the ratio of accurately classified data items to the total number of observations; F1-score is the harmonic mean of precision and recall; AUC demonstrates how good a model is in discriminating positive and negative target classes (Caelen, 2017; Vakili et al., 2020). Models were built in a Python library Scikit-learn.
Results and Discussion
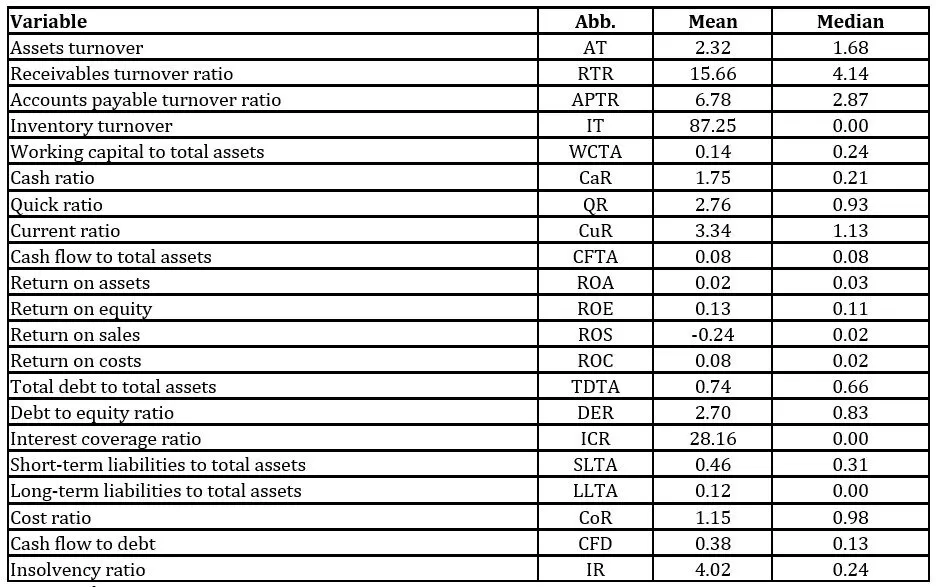
Results of the initial analysis of financial ratios are evaluated in terms of their mean and median (see Table 2). The safety of the analyzed companies does not reach the required value, since the median as well as the average of the indicator Working capital to total assets is low. The liquidity of the analyzed companies is adequate in terms of its average, however, in terms of its median, the companies are slightly lagging behind. The assets of the analyzed companies turn over more than once a year; we consider it positive. Analyzed businesses achieve low Return on assets, both in terms of its mean and median. The Return on sales of the analyzed companies also reaches very low values; the mean of this indicator is even negative. Return on equity reaches more satisfactory results. Assets management indicators in most cases achieve positive results; the exception is the median of the indicator Accounts payable turnover ratio – the analyzed companies should pay their short-term debt faster. From the point of view of the mean, the capital structure of the analyzed companies is 66%:34% in favor of debt. However, the median of the analyzed companies reaches even critical indebtedness. The results of both the average and median of the indicator Cost ratio are positive.
Table 2:Comparison of values of mean and median of financial ratios
Source: authors
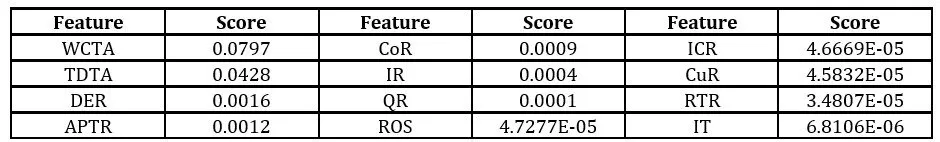
The most important performance features were selected using elastic net algorithm. The optimal values of and were selected based on the average absolute mean error of the model using 10-fold cross-validation. From 21 financial features, 12 features achieved non-zero coefficients based on Elastic net. The remaining features were shrunk to zero. Features identified by Elastic net as the most important performance features include WCTA, TDTA, DER, APTR, CoR, IR, QR, ROS, ICR, CuR, RTR, IT.
Table 3:Features selected by elastic net and their scores
Source: authors
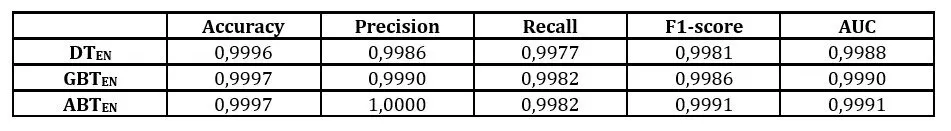
Features selected by elastic net were used to build decision tree (DT), Gradient boosted tree (GBT) and AdaBoosted tree (ABT). Performance results of these classifiers are shown in Figure 1. Accuracy of classifiers is almost the same, DT achieved 0.9996, while accuracy of GBT and ABT was 0.9997. The largest differences were in the results of precision – the best result was achieved by ABT (1.0000), followed by GBT (0.9990) and DT (0.9986). The recall showed more balanced results – ABT and GBT both achieved 0.9982, while DT achieved a slightly worse result (0.9977). The best results of F1-score were achieved by ABT (0,9991) followed by GBT (0.9986) and DT (0.9981). There were very small differences in the AUC results – the best result was again achieved by ABT (0.9991), then GBT (0.9990) and DT (0.9988). Overall, we can summarize that the classifiers’ performance results are excellent, the best results were achieved by ABT.
Fig 1. Performance results of selected classifiers
Source: authors
Models built in this paper (figure 1) achieved better performance compared to models built in our previous research (Horváthová et al., 2024) with Lasso-based feature selection – DT achieved AUC 0.92, AUC of GBT and ABT was 0.97. DTs were applied in studies of other authors: Gepp et al. (2009) achieved 87.6% accuracy; Tsai and Cheng (2012) achieved 92% accuracy; Khademolqorani (2015) reached 94% accuracy.
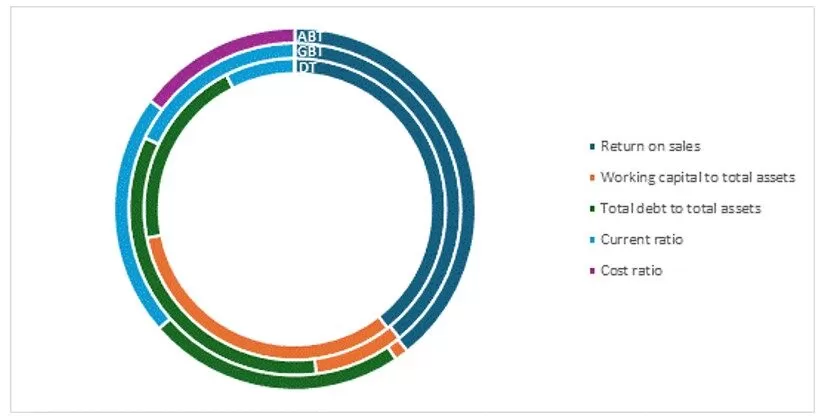
The ranking of features according to their importance for improving the performance of analyzed businesses is shown in table 4. Results of features’ importance of individual machine learning models slightly vary. The most important indicator in all three models is Return on sales. It may also be due to the fact that the analyzed companies achieved low, resp. negative values of this indicator. This indicator was used in the research by Callejon et al. (2013). Another indicator which is one of the most important in all three models is Total debt to total assets, which was identified as significant in several previous studies: Shin et al. (2005). Among the important indicators, we can mention Working capital to total assets which ranked second according to DT or Current ratio, which ranked third according to GBT and ABT. A significant indicator according to ABT is also the Cost ratio, which achieved significant importance, even though it ranked fourth.
Source: authors
Conclusion
The financial performance of enterprises is a significant phenomenon of today, it is a prerequisite for their viability and competitiveness, as well as a prerequisite for their contribution to the economic existence and development of countries. The financial performance of enterprises is primarily a prerequisite for their economic growth. That is why the issue of measuring the financial performance of enterprises is so highly topical. The result of the study, which was carried out on a sample of enterprises in the construction industry, is the finding that in order to achieve significant results in measuring the financial performance of enterprises, it is appropriate to apply artificial intelligence methods that achieve higher accuracy than other ones. The study also results in the identification of significant performance indicators, including Return on Sales, Working Capital to Total Assets, Total Debt to Total Assets, Current Ratio. These are 4 indicators that represent all 4 important areas of assessing the financial health of companies: profitability, assets management, capital structure and liquidity. Significant attention should be paid to these indicators and their monitoring. The research confirmed that artificial intelligence models – DT, GBT and ABT are a significant contribution to the classification of companies in terms of their performance, but also to the detection of significant performance indicators. The research results represent a practical benefit for managers of construction companies, who will be able to prioritize those indicators that are significant for the performance of their companies. The theoretical benefit is the possibility of incorporating these findings and applied methods into the educational process of future business managers. The limitations of this research were the sample of companies with a number of outliers, missing values and loss of data over time. Therefore, the direction of future research will be the effort to create a larger and more stable sample of data and to balance it.
Acknowledgment
This paper was prepared within the grant scheme VEGA No. 1/0449/24 – Design of an integrated system for measuring the sustainable businesses’ performance in the era of digitalization.
Copyright Notice
Authors who publish in any IBIMA Publishing open access journal retain the copyright of their work under a Creative Commons Attribution 3.0 Unported License, which allows the unrestricted use, distribution, and reproduction of an article in any medium, provided that the original work is properly cited. No permission is required from the authors or the publishers. While authors retain copyright of their work with first publication rights granted to IBIMA Publishing, authors are required to transfer copyrights associated with commercial use to this Publisher. Revenues produced from commercial sales and distribution of published articles are used to maintain reduced publication fees and charges.
References
Al-Jawarneh, AS., Ismail, MT. and Awajan, AM. (2021), ‘Elastic Net Regression and Empirical Mode Decomposition for Enhancing the Accuracy of the Model Selection,’ International Journal of Mathematical, Engineering and Management Sciences, 6 (2), 564-5 https://doi.org/10.33889/IJMEMS.2021.6.2.034.
Amini, F. and Hu, G. (2021), ‘A two-layer feature selection method using Genetic Algorithm and Elastic Net,’Expert Systems with Applications, 166, https://doi.org/10.1016/j.eswa.2020.114072.
Anyanwu, MN. and Shiva, SG. (2009), ‘Comparative analysis of serial decision tree classification algorithms,’ International Journal of Computer Science and Security, 3 (3), 230-240.
Babalola, YA. (2013), ‘The effect of company size on companies profitability in Nigeria,’ Journal of Economics and Sustainable Development, 4 (5), 90-94.
Caelen, OA. (2017), ‘Bayesian interpretation of the confusion matrix,’ Annals of Mathematics and Artificial Intelligence, 81, 429-450. https://doi.org/10.1007/s10472-017-9564-8.
Callejón, AM., Casado, AM., Fernández, MA. and Peláez, JI. (2013), ‘A System of Insolvency Prediction for industrial companies using a financial alternative model with neural networks,’ International Journal of Computational Intelligence Systems, 6 (1), 29-37. https://doi.org/1080/18756891.2013.754167.
Creamer, G. and Freund, Y. (2010), ‘Using Boosting for Financial Analysis and Performance Prediction: Application to S&P 500 Companies, Latin American ADRs and Banks,’ Computational Economics, 36 (2), 133- https://doi.org/10.1007/s10614-010-9205-3.
CRIF (2024), Financial Statements of Analyzed Businesses; CRIF-Slovak Credit Bureau, : Bratislava, Slovakia.
Elexa, L., Klement, L. and Hvolkova, L. (2023), ‘Reasons for Potential Bankruptcy: Evidence from the Construction Industry in Slovakia,’ Forum Scientiae Oeconomia, 11 (2), 43-67. https://doi.org/10.23762/FSO_VOL11_NO2_2.
Friedman, JH. (2001), ‘Greedy function approximation: A gradient boosting machine,’ The Annals of Statistics, 29 (5), 1189-1232. https://doi.org/10.1214/aos/1013203451.
Gepp, A., Kumar, K. and Bhattacharya, S. (2009), ‘Business failure prediction using decision trees,’ Journal of forecasting, 29 (6), 536-555. https://doi.org/10.1002/for.1153.
Ghiasi, MM., Zendehboudi, S. and Mohsenipour, AA. (2020), ‘Decision tree-based diagnosis of coronary artery disease: CART model,’ Computer Methods and Programs in Biomedicine, 192, A. N. 105400. https://doi.org/10.1016/j.cmpb.2020.105400.
Hopwood AG. (1972), ‘An empirical study of the role of accounting data in performance evaluation. Empirical research in accounting: selected studies,’Journal of Accounting Research, 10, 156-182. http://dx.doi.org/10.2307/2489870.
Horváthová, J., Mokrišová, M. and Schneider, A. (2024), ‘The Application of Machine Learning in Diagnosing the Financial Health and Performance of Companies in the Construction Industry,’ Information, 15 (6), A. N. 355. https://doi.org/10.3390/info15060355.
Chiadamrong, N. and Wattanawarangkoon, T. (2023), ‘Financial performance prediction model based on firms’ internal capability determinants: evidence from listed firms in Thailand during the transition period of going public,’ Cogent Engineering, 10 (1). https://doi.org/10.1080/23311916.2023.2216860.
Jackova, A. (2021), ‘Utilization of modern methods in measuring the financial performance of the company,’ AD ALTA Journal of Interdisciplinary Research, 11 (1), 114-116. https://doi.org/33543/1101114116.
Kaplan RS. and Atkinson AA. (1998), Advanced Management Accounting (3rd), Prentice-Hall, USA.
Kaplan, RS. and Norton, DP. (1996), The Balanced Scorecard. Translating Strategy into Action, Harvard Business School Press, Boston.
Kellen, V. (2003). Business performance measurement. At the Crossroads of Strategy, Decision-Making, Learning and Information Visualization. [Online], [Retrieved March 25, 2024], https://www.kellen.net/bpm.pdf.
Khademolqorani, S., Zeinal Hamadani, A. and Mokhatab Rafiel, F. (2015), ‘A Hybrid Analysis Approach to Improve Financial Distress Forecasting: Empirical Evidence from Iran,’ Mathematical Problems in Engineering, 2015, A. N. 178197. https://doi.org/10.1155/2015/178197.
Killi, M. and Isik, Y. (2023), ‘Measuring of firm performance using accounting based ratios with artificial neural networks and decision tree methods: A study in Borsa Istanbul,’ Journal of Economics and Administrative Sciences [Online], 7 (1), 89-102, [Retrieved April 18, 2024], https://dergipark.org.tr/tr/download/article-file/3152139.
Kislingerová, E. et al. (2011), Nová ekonomika. Nové príležitosti? [New economy. New opportunities], C. H. Beck, Prague.
Kotāne, I. and Kuzmina-Merlino, I. (2012), ‘Assessment of financial indicators for evaluation of business performance,’ European Integration Studies, 6, 216- https://doi.org/10.5755/j01.eis.0.6.1554.
Lee, J., Jang, D. and Park, S. (2017), ‘Deep Learning-Based Corporate Performance Prediction Model Considering Technical Capability,’ Sustainability, 9, 899. https://doi.org/10.3390/su9060899.
Liu,, XY., Liang, Y., Wang, S., Yang, ZY. and Ye, HS. (2018), ‘A Hybrid Genetic Algorithm With Wrapper-Embedded Approaches for Feature Selection,’ IEEE ACCESS, 6, 22863-22874. https://doi.org/1109/ACCESS.2018.2818682.
Mayr, A., Binder, H., Gefeller, O. and Schmid, M. (2014), ‘The evolution of boosting algorithms. From machine learning to statistical modelling,’ Methods of Information in Medicine, 53 (5), 419-427. https://doi.org/3414/ME13-01-0122.
Manogna, R. L. and Mishra, A. K. (2022), ‘Measuring financial performance of indian manufacturing firms: Application of decision tree algorithms,’ Measuring Business Excellence, 26 (3), 288-307. https://doi.org/10.1108/MBE-05-2020-0073.
MFSR (2023), Summary annual report of the Slovak Republic for the year 2022. Ministry of Finance of the Slovak Republic.
Mokrišová, M. and Horváthová, J. (2023), ‘Domain Knowledge Features versus LASSO Features in Predicting Risk of Corporate Bankruptcy-DEA Approach,’ Risks, 11 (11), A. N. 199. https://doi.org/10.3390/risks11110199.
Olson, DL. Delen, D. and Meng, Y. (2012), ‘Comparative analysis of data mining methods for bankruptcy prediction,’ Decision Support Systems, 52, 464-473. https://doi.org/10.1016/j.dss.2011.10.007.
Rybárová, D., Braunová, M. and Jantošová L. (2016), ‘Analysis of the Construction Industry in the Slovak Republic by Bankruptcy Model,’ Procedia – Social and Behavioral Sciences, 230, 298- https://doi.org/10.1016/j.sbspro.2016.09.038.
Shin, KS., Lee, TS. andKim, HJ. (2005), ‘An application of support vector machines in bankruptcy prediction model,’Expert Systems with Applications, 28 (1), 127-135. https://doi.org/10.1016/j.eswa.2004.08.009.
Supsermpol, P., Huynh, VN., Thajchayapong, S. and Chiadamrong, N. (2023), ‘Predicting financial performance for listed companies in Thailand during the transition period: A class-based approach using logistic regression and random forest algorithm,’ Journal of Open Innovation: Technology, Market, and Complexity, 9 (3), A. N. 100130. https://doi.org/10.1016/j.joitmc.2023.100130.
Thacker, J., and Saha, D. (2024). Financial Performance and Corporate Distress: Searching for Common Factors for Firms in the Indian Registered Manufacturing Sector. Computational Economics. https://doi.org/10.1007/s10614-024-10620-6.
Vakili, M., Ghamsari, M. and Rezaei, M. (2020), ‘Performance Analysis and Comparison of Machine and Deep Learning Algorithms for IoT Data Classification,’ Computer Science. https://doi.org/48550/arXiv.2001.09636.
Vibhakar, NN., Tripathi, KK., Johari, S. and Jha, KN. (2020), ‘Identification of significant financial performance indicators for the Indian construction companies,’ International Journal of Construction Management, 23 (1), 13-23. https://doi.org/10.1080/15623599.2020.1844856.
Warni, E., Saputri, DW., Prayogi Alimuddin, AA., Arif, YM. and Rahman, IT. (2024), ‘Boosting Methods Comparison: XGBoost, Adaboost and Gradient Boosting for Business Partner Performance Prediction. In 2024 8th International Conference on Information Technology, Information Systems and Electrical Engineering (ICITISEE), Yogyakarta, Indonesia, pp. 376-380. https://doi.org/10.1109/ICITISEE63424.2024.10730221.
Zelenkov, Y., Fedorova, E. andChekrizov, D. (2017), ‘Two-step classification method based on genetic algorithm for bankruptcy forecasting,’Expert Systems with Applications, 88, 393-401. https://doi.org/10.1016/j.eswa.2017.07.025.
Zou, H. and Hastie, T. (2005), ‘Regularization and Variable Selection Via the Elastic Net,’ Journal of the Royal Statistical Society Series B: Statistical Methodology, 67 (2), 301-320, https://doi.org/10.1111/j.1467-9868.2005.00503.x.