Ioana Udrea1, Valeru Friedemann Kraus2 and Alina Popescu-Cuta3
1,3University POLITEHNICA of Bucharest, Faculty of Mechanical Engineering and Mechatronics, Department of Precision Mechanics and Mechatronics, Bucharest, Romania
2ASC-Romania, Bucharest, Romania
Volume 2021,
Article ID 473868,
Journal of Human Resources Management Research,
15 pages,
DOI: 10.5171/2021.473868
Received date: 21 September 2020; Accepted date: 3 February 2021; Published date: 13 July 2021
Academic Editor: Elena-Anca Paraschiv
Cite this Article as:
Ioana Udrea, Valeru Friedemann Kraus and Alina Popescu-Cuta (2021)," Improving Workplace Services using a Facility Management Platform Sensors Monitoring", Journal of Human Resources Management Research, Vol. 2021 (2021), Article ID 473868, DOI: 10.5171/2021.473868
The aim of this paper is to develop an advanced sensor monitoring system and to correlate it with a Facility Management (FM) enterprise platform in order to support the facilities managers to make decisions regarding the use of space or the cancellation of reservations. For this purpose, a system of sensors consisting of two infrared sensors working in pairs and a sensor that measures the light intensity was developed, and ARCHIBUS was chosen as the FM platform. The results received from the sensor system were correlated with the data and the reports from the FM application, having the analysis of real number of participants vs planned number of participants as a central element. Various reports made in the ARCHIBUS application that use the data received from the sensors are discussed, and their practical utilities are listed. The sensor system is cheap, and its scalability allows the management of an unlimited number of objectives.
Keywords: Sensor Monitoring, ARCHIBUS, People Presence
Introduction
IoT is a rapidly expanding technology that enables devices to communicate without human intervention. In the last period, the number of applications that make use of the IoT has increased dramatically and it spans areas from business and manufacturing to home, health care, and knowledge management (Nord et al. 2019). Over time, the IoT is expected to have significant home and business applications to contribute to the quality of life and to grow the world’s economy (Al-Fuqaha et al., 2015). Important aspects to consider in IoT systems are how to communicate with the sensors and how they transmit data. Among the most used technologies are RFID and sensor networks. They are considered the fastest growing information and communication technologies (Gubbi et al., 2013).
According to the definition given by the International Facility Management Association (IFMA), FM is a profession that includes several disciplines helping to ensure the functionality of the built environment by integrating people, space, processes, and technology (EuroFM, 2019). In accordance with the European standard (EN 15221-1 2006), FM is the integration of processes in an organization in order to maintain and develop the services it provides and to effectively improve the primary activity of the organization. A wide variety of commercial software applications are available on the market to meet FM requirements.
In the field of Facility Management (FM), the impact of IoT is growing and IoT is playing an important role in improving FM services. Although there is a lot of data, the use of sensor data recording in FM is much lower. Recently, great attention has been paid to the potential of expanding the applicability of major digital technologies, such as BIM, RFID, GIS, and real-time data capture. They can be used to capture, transfer and store big data information throughout the life cycle of the building, including the maintenance and operation of the building. Consequently, a large number of innovative approaches have been implemented in recent years (Chen et al., 2015). Among the countless aspects related to the building and especially to BIM, such as heat transfer and its simulation (Natephra et al., 2018, Pop et al., 2018), building ventilation (Sporr et al., 2019, Guitar, 2018), and air quality interior (Diodiu and Dogeanu, 2016), the counting of the number of people (Ye, 2010, Gerland and McDonald, 2016) has a very big impact on FM and its various areas.
In this context, this project aims to use an FM application and integrate it with data received from sensors by cable or Wi-Fi, thus monitoring the number of people occupying a certain room, such as a meeting room which has a continuous variability of the occupancy level throughout the day.
Following the data provided by the sensors, the variation of the real number of people counted in a meeting room will be compared with the reservations made in the FM application for that room. Using the results obtained, it will be possible to make decisions regarding the use of space or the cancellation of reservations. Similar research on the most efficient use of space in terms of the actual number of people has been done in buildings in the Australian health system (McNabb, 2018).
A classification of different people counting technologies is made according to the generation to which the measurement system belongs (Sruthi, 2019). Thus, we have first generation technologies (infrared beam counters), second generation (thermal counters) and third generation technologies (video & Wi-Fi counters).
Knowing the fact that in meeting rooms, participants from outside the company can come regularly and they may not want to be equipped with RFID cards, this technology will not be considered. The current legislation in Romania (Law192, 2019) (Noting that the meeting rooms that will be monitored are located in the customer’s buildings) does not allow the use of video cameras in institutions. For this reason, the people counting method with the help of video cameras will not be used. Due to the fact that thermal cameras are expensive, and the cheapest ones do not offer sufficient resolution for the precise people counting, this solution will not be used either. Taking that into account a long with the fact that people counting using infrared sensors is the most used method, it will be the method chosen for the study in this paper. A system consisting of 2 infrared sensors will be used, mounted on either side of the wall at the entrance of a meeting room.
This study presents a Proof of Concept (POC) project, which involves the installation of a sensor system to monitor the presence in two meeting rooms in one of the customer’s buildings. In addition, the light intensity will be monitored in the two rooms. The customer facility management application will be modified so that it receives the data resulting from the measurements made by the sensors and uses them in completing and improving the already existing reports.
Due to the fact that the requirements were few and clear, without the risk of being modified during the project, the waterfall methodology was chosen instead of agile. Moreover, because it was a new type of project that required some research and had to be well documented, the waterfall methodology was the most appropriate.
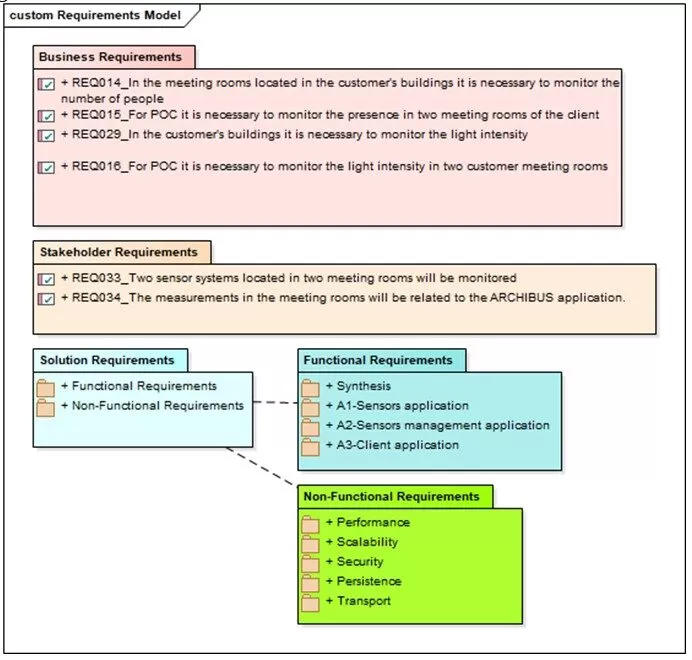
The Requirement Model was conceived in the classical structure as being composed of Business Requirements, Stakeholder Requirements, and Solution Requirements, see fig. 1. For each category, the corresponding requirements or the subcategories that compose it have been defined, after which the requirements for the subcategories have been defined, and so on. Both the Requirement Model and other models being part of this project: Data Model, User Interface Model and Deployment View (or hardware architecture) were made using Enterprise Architect software (EA, 2016).
Fig. 1: Requirement Model, made with Enterprise Architect software
From the POC, only the development part is presented, respectively the realization of the sensor system, the data transmission to the application and its customization, less the installation of the sensors at the customer’s location and the deployment of the customized application on the production server.
Method and Procedure
Sensor System Description
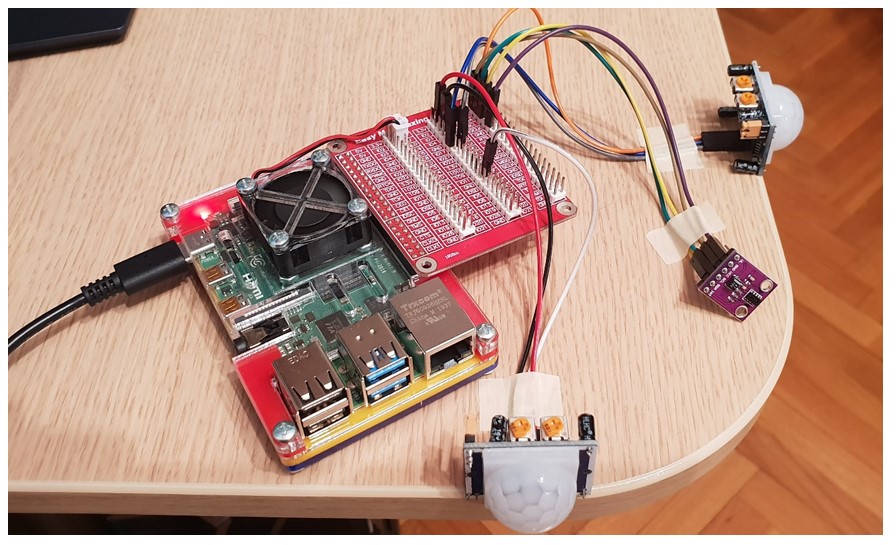
The sensor system used in this study is composed of a Raspberry Pi board, a multiplexing connection board and three sensors: a pair of two identical PIR Motion Sensors (PIR, 2020) and Digital Proximity and Ambient Light Sensor (APDS-9930, 2020). PIR sensors allow one to sense motion. They are almost always used to detect whether a human has moved in or out of the sensors range. They are small, inexpensive, low-power, and easy to use and do not wear out. For those reasons, they are commonly found in appliances and gadgets used in homes or businesses. Digital Proximity and Ambient Light Sensor, APDS-9930 provides digital ambient light sensing (ALS), IR LED, and a complete proximity detection system in a single 8 pin package. The ALS provides a photopic response to light intensity in a very low light condition or behind a dark faceplate.
The Raspberry Pi used is a Model 4, B (Raspberry Pi4, 2019). It is a credit-card-sized single-board computer. The CPU on the board is an ARM v8 processor with 1.5 GHz speed. It has a variety of interfacing peripherals, including 2 USB 3.0 ports, 2 USB 2.0 ports, 2 micro-HDMI ports, 4 GB RAM, Micro-SD Card storage and a 40 pin GPIO header. For GPIO port expansion, a multiplexing connection board is used.
Two monitors, a keyboard and a mouse can be connected to the Raspberry Pi through micro-HDMI and USB connectors, and it can be used like a desktop computer. It supports a number of operating systems including a Debian-based Linux distro, Raspbian, which is used in this design. The Raspberry Pi can be connected to a local area network through Ethernet cable or USB Wi-Fi adapter, and then it can be accessed through SSH remote login.
Additionally, the Raspberry Pi is equipped with a housing and a 5V fan, see fig. 2
Fig. 2: Sensor system: Raspberry PI board, 2 PIR sensors and an ambient light sensor
Rooms reservation in ARCHIBUS
A wide variety of commercial software applications, including (ARCHIBUS, 2015), (BIM 360, 2020), (EcoDomus, 2020), (ONUMA, 2020), (QFM, 2020) and (TRIRIGA, 2020), are available on the market to meet the requirements of FM (Wong, 2018).
The chosen FM software is ARCHIBUS. It is an enterprise application that provides a holistic approach to facility and infrastructure management throughout the entire life cycle of the building. It is made up of several integrated modules, allowing applications to have the same work environment and a common database. ARCHIBUS is a multilayer 100% web application. Client layer provides intuitive web interfaces in which users can enter and view data as well as numerous reports. At the application layer, ARCHIBUS can work on a Tomcat, WebLogic or other application servers. For integration, many web services are developed at the application level. Back-end application development is done in java programming language. Regarding the database level (DB), the application allows the use of several types of databases. In this study, ARCHIBUS software is deployed on a WebLogic server running on Linux OS (Operating System), and the database used is Oracle.
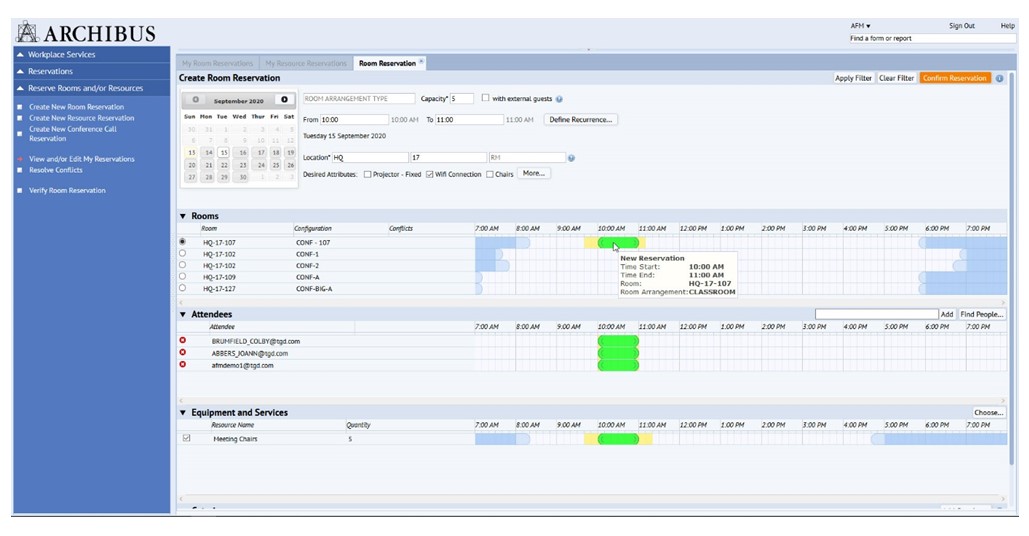
In terms of business, ARCHIBUS is composed of several modules, each module having certain applications. ARCHIBUS module Workplace Services consists of three applications. One of the three applications is named Reservation. It deals with planning reservation (usually for meetings) for different rooms. It is an integrated solution for scheduling a shared space and associated amenities.
A room reservation takes into account all the elements that can interact with these reservations, such as the time interval of the reservation, the participants in a certain meeting, the possible recurrence of the reservation and others. Fig. 3 shows the screen in which the room reservation is created.
Fig. 3: Creating a room reservation in ARCHIBUS
Solution conception and implementation
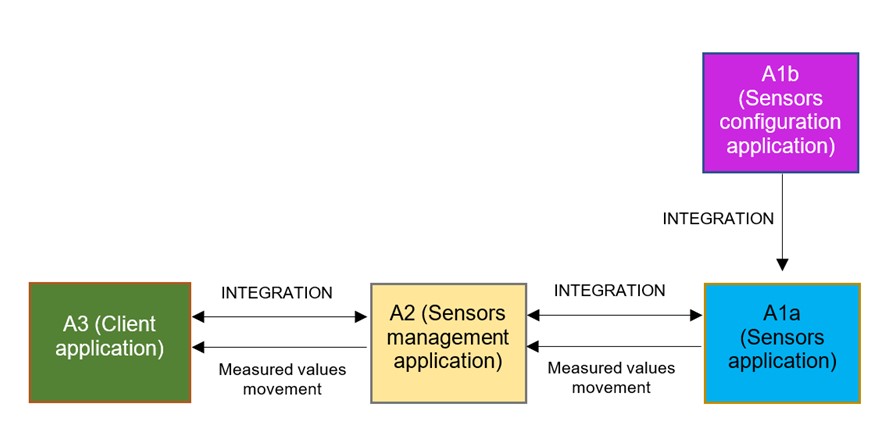
The solution for the ARCHIBUS integration software will be modularly designed and will be composed of three sub-solutions (applications), see fig. 4. In this structure, any module could be replaced, for example, another physical sensor system could be used and another application could even be used instead of ARCHIBUS (A3-Client Application). This solution was conceived on the occasion of the realization in ARCHIBUS of a monitoring and management system of indoor climate parameters (Kraus and Udrea).
Fig. 4: The connections between applications
A1 represents the sensor’s solution. It is composed of A1b (Sensors configuration application) – the applications of the sensors on their Printed Circuit Board (PCB), and A1a (Sensor application). Next is A2 (Sensors management application). It is a specific application for this sensor monitoring project. As can be seen from the image, it is integrated with both the A1 and A3 applications. For this, A2 contains two APIs. This application was developed to ensure the independence of the A3 application from the sensor’s solution. Through the configurations of the A2 application (A2 depending on the sensor’s solution), it is possible that the A3 application remains unchanged regardless of the sensor system used. The A3 application (Client application) is the final application, which contains the front-end part, meaning the interaction with the user. Here, the data are used effectively, and the various reports are made. In this work, A3 is ARCHIBUS.
In this paper, the API of the A1a application (Sensors application) directly provides the value of people count and various network and Raspberry Pi board features. It also provides functions for resetting and modifying some features, including people count.
A SOAP web-service has been created, with the help of which, data is read and transmitted to the Sensors application. Other details about the realization of the applications A1 and A2 will not be presented in this paper. Regarding the customization of the A3 application, only the main reports made will be presented. The chosen hardware solution will also be presented.
ARCHIBUS Modules Improvement
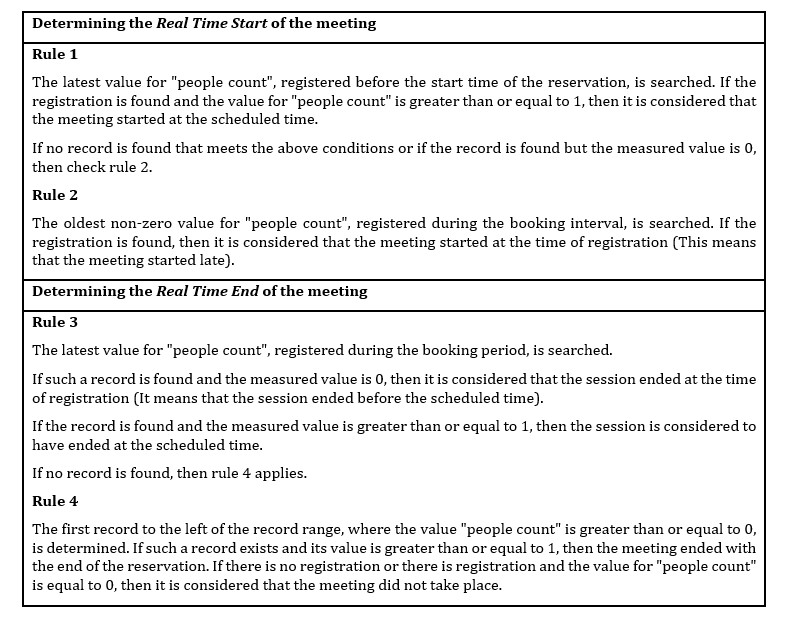
People count, provided by the Sensors application, represents the real number of participants in a meeting. Determining the real start and end time of the meeting, by means of the people count, is done using the rules in table 1.
Table 1: Determining Real Time Start and Real Time End for a meeting.
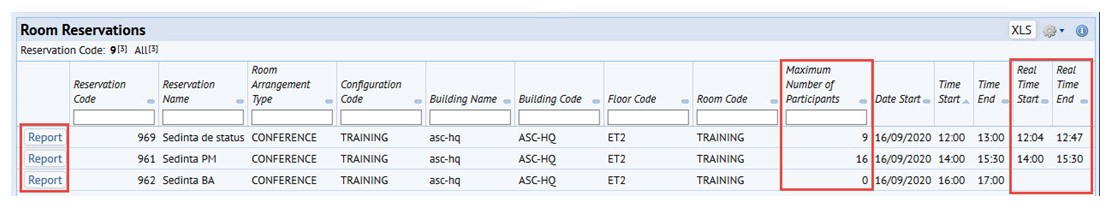
The existing standard report, Room Reservations, which represents the list of reservations, can be filtered by various attributes. The report has been modified by adding the following information (columns in the report): Real Time Start, Real Time End, and Maximum Number of Participants, see fig 5.
Considering that not all the meeting rooms are equipped with people count monitoring sensors, a report was made in which only the sessions during which readings were made with the sensors are displayed. Since it is similar to the Room Reservations report, differing only in the filtering of the displayed results, it is no longer presented in this paper.
Fig. 5: New items added to the Room Reservations report, attributes: Real Time Start, Real Time End, and MaximumNumber of Participants and the Report button.
The screen shown in fig. 5 is just one of the screens improved for this POC. There are also new developed screens for communication with A1a (Sensors application), screens for viewing the data sent by the sensors, as well as for centralizing and systematizing them in accordance with the way ARCHIBUS manages its data.
In order for the application not to display too much information related to the past meetings, the data are archived (they are entered in the corresponding tables in the database and can only be viewed on the special screen created for archived measurements). For the database not to contain too much data, the data are deleted after a certain period as well.
Reports developed in ARCHIBUS
People Presence by Room
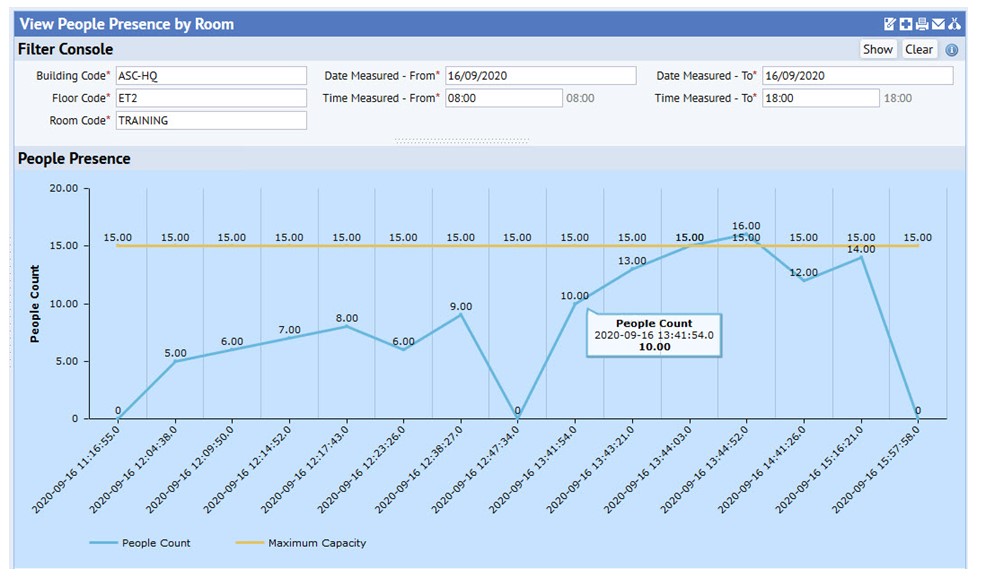
The first graphical report developed in the application displays the recorded values of the people count in a certain room. This report has nothing to do with any meeting in that room. Regarding the choice of the room, the following mandatory filters must be applied: Building Code, Floor Code, Room Code, Date Measured – From/To, and Time Measured – From/To, see fig. 6.
The broken line in the figure represents people count, while the straight line represents the capacity of the room. The corresponding value of people count appears at the inflection points of the broken curve.
Fig. 6: People count and room capacity for a certain room and time interval
Light Intensity by Room
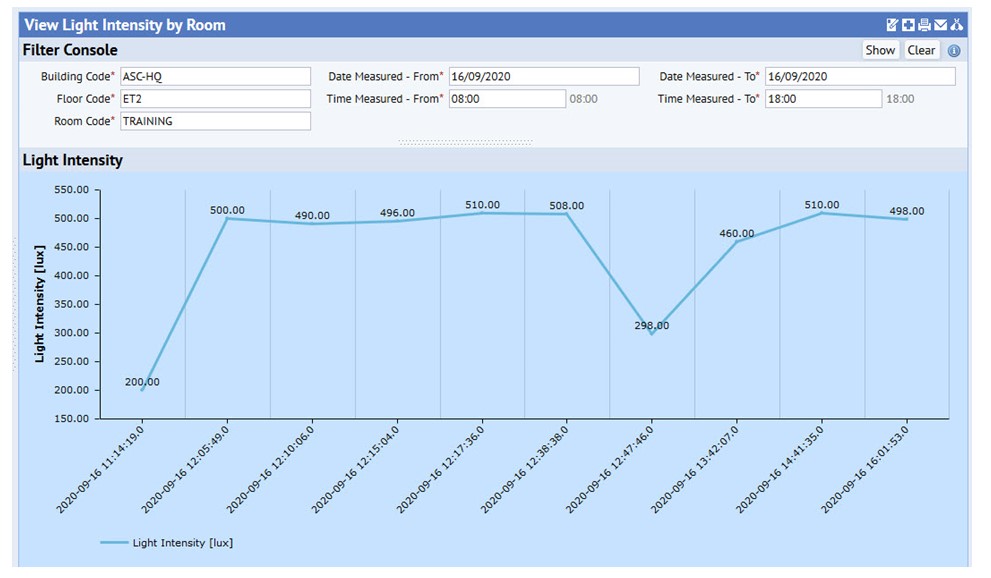
Fig. 7: Light intensity for a certain room and time interval
The next report developed in the application is the light intensity in a certain room, see fig. 7. Regarding the choice of the room, the same filters as in the case of displaying people count by room must be applied.
The sensor measures the light intensity and it is observed that its values are almost in the range (200, 500), which are the recommended values for large size offices and libraries’ reading lounges, according to (IESNA, 2000). Considering that in the displayed interval (8:00, 18:00), there is natural light, it can be assumed that the variations of light intensity appeared due to the closing and opening of the blinds.
Real number of participants vs planned number of participants
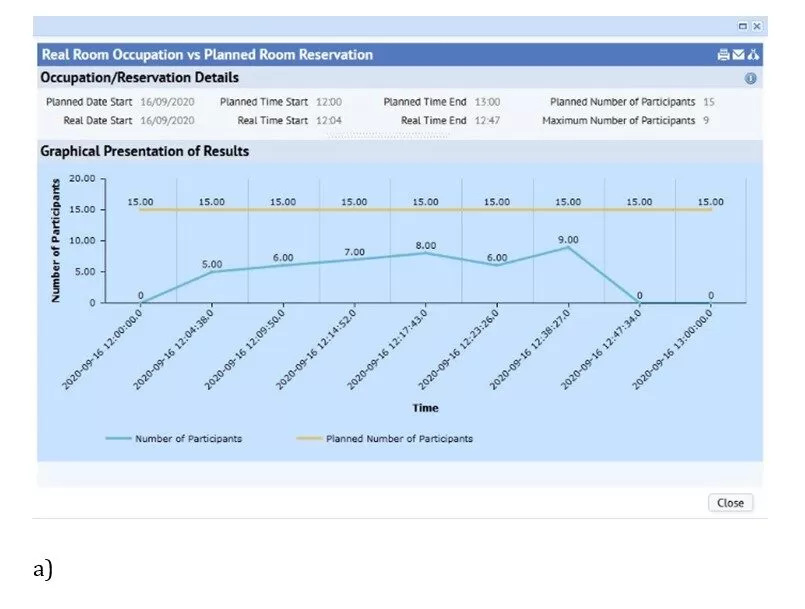
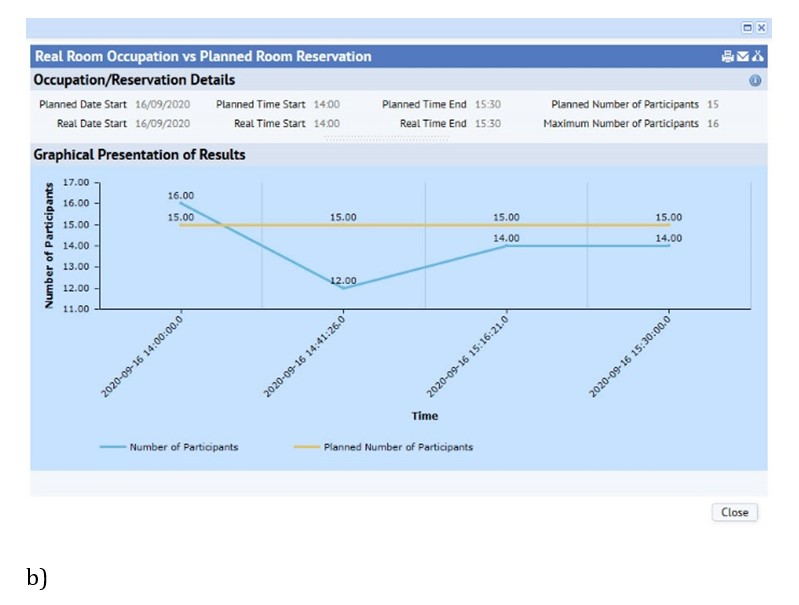
The graphs shown in fig. 8 are examples of applying the rules for determining the real number of participants in a meeting. The algorithm is presented in table 1. Two cases are shown, a) when Planned Time Start and Planned Time End are the same as Real Time Start and Real Time End, and case b) when Start and End times are different (the planned meeting interval differs from the real one).
Fig. 8: Real number of participants vs planned number of participants: a) planned meeting interval is the same as real meeting interval; b) planned meeting interval differs from real meeting interval
In fig. 8, a), a real number of 16 people at the meeting start is observed (Planned Date and Time Start), which means that there is a registration of people count greater than or equal to 1 before the start time of the reservation. According to rule 1 of table 1, it is considered that the session started at the scheduled time, so Real Time Start is equal to Planned Time Start. Regarding the end of the reservation, it is found that the most recent value for “people count”, registered in the reservation interval, is greater than or equal to 1. According to rule 3 of table 1, it is considered that the meeting ended at the scheduled time, so Real Time End is equal to Planned Time End.
In fig. 8, b), a real number of 0 people at the meeting start is observed. According to rule 1 in table 1, one needs to check rule 2. Rule 2 refers to looking for the oldest non-zero value for “people count” recorded during the booking period. The authors search for it and find the value of 5, so they consider that the session started at the time of registration, which means that Real Time Start is 12:04. Regarding the end of the reservation, according to rule 3 of table 1, one must search for the latest value for “people count” registered during the booking period. It is found and it has the value of 0, so the meeting ended at the time of recording, so Real Time End is 12:47.
Deployments and hardware solution
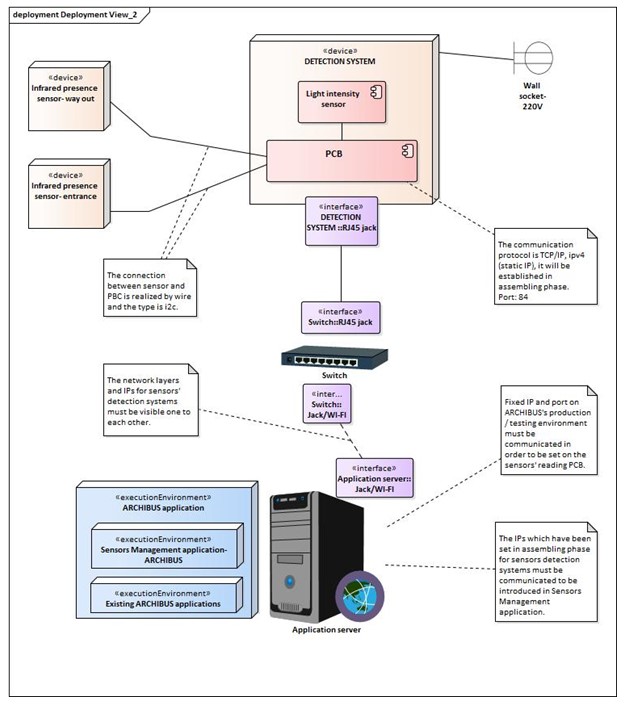
In fig. 9, a complete hardware solution is presented, including Sensor’s solution. Currently, the system is made in the Local Area Network (LAN); however, the solution also allows Wi-Fi connection.
As shown in the figure, the hardware sensor’s system is composed of two PIR sensors, an ambient light sensor, and a Raspberry Pi device, including physical interfaces (it supports both wire and wireless connection). The schematic representation in the image wants to show that the light intensity sensor is mounted on (or very close to) the Raspberry Pi Printed Circuit Board (PCB) and their assembly is considered to be DETECTION SYSTEM. The two PIR pair sensors are located further away from the Raspberry Pi PCB. In the customer’s meeting room, they will be mounted next to the access door, on either side of the wall of which the door is part.
Fig. 9: The hardware architecture of the sensor monitoring solution
The physical system is also scalable, so it can be allowed to connect any number of sensor systems.
The application server can also be connected using wire and wireless in LAN. Although the figure of the hardware solution is represented schematically and the ARCHIBUS application (as “execution environment”) to highlight that in addition to the existing application, the new sensor monitoring application was added, both now representing a whole, called the ARCHIBUS application.
As can be seen from fig. 9, in the network layer, care must be taken when communicating and establishing data transmission protocols and other details to successfully connect all devices in the network.
Conclusions
Following the analysis of the current state, it results the increase of the number of IoT systems as well as the need to implement them in FM applications. It is found useful to develop a system of sensors used to count people and measure light intensity and its correlation with the module that deals with the reservation of rooms in an FM application of an enterprise type. To determine the number of people participating in a meeting, a pair of two PIR infrared sensors is used. The sensors are mounted on either side of the access door in the meeting room.
The applications of the sensor system implemented in ARCHIBUS software can be multitudinous. Both comparisons can be made between the actual occupancy rate of the rooms and the planned one as well as between the actual occupancy rate and the capacity of the respective room. As sufficient data is collected, one can observe the percentage of the capacity of the rooms that is actually used, and it will be possible to make statistical calculations that will estimate the occupancy rate of the rooms in the future and the related costs. Another utility of the developed sensor system could be the cancellation of a reservation if a meeting planned in a room is found not to have started. When that reservation could be canceled, the room would be available in case someone else wants it.
The light intensity can be correlated with meetings and people count, and if desired, one can give alerts such as, in case there is no external natural light, the light intensity values show that the light is on but there are no people in the room, or in case the light stays on outside office hours, etc..
Acknowledgements
This article is funded by the University POLITEHNICA of Bucharest, through the project “Engineer in Europe” online, registered at MEC under no. 457/GP/06.08.2020, by using the fund for financing special situations that cannot be integrated in the form of financing state higher education institutions.
Chitaru G., Berville C. and Dogeanu A., (2018), Numerical simulation and comparison of two ventilation methods for a restaurant – displacement vs mixed flow ventilation, E3S Web of Conferences 32, 01012, https://doi.org/10.1051/e3sconf/20183201012.
Diodiu R. and Dogeanu A. (2016), Development and validation of an analytical method for quantitative determination of carboxylic acids in air samplers, Sustainable Solutions for Energy and Environment, Energy Procedia 85, 201 – 205, doi: 10.1016/j.egypro.2015.12.217.
Gerland H. and McDonald I., (2016), bCounted: Automatic People Counting and People Flow Management at Airports, 15th International Conference on Automated People Movers and Automated Transit Systems, April 17–20, 2016 | Toronto, Ontario, Canada, https://doi.org/10.1061/9780784479797.007
Gubbi J., Buyya R., Marusic S., and Palaniswami M. (2013), Internet of Things (IoT): A vision, architectural elements, and future directions, Future Generation Computer Systems, 29(7), 1645-1660, 2013/09/01, doi: https://doi.org/10.1016/j.future.2013.01.010.
IESNA (2000), Lighting Handbook, Illuminating Engineering Society of North America (Author), editor: Mark Stanley Rea.
Kraus V. F. and Udrea I., Advanced Workplace Management Platform for Monitoring and Management of Indoor Climate Parameters, EENVIRO 2020 Conference-online, accepted paper.
Law192 (2018), Law no. 190 of 18 July 2018 on measures to implement Regulation (EU) 2016/679 of the European Parliament and of the Council of 27 April 2016 on the protection of individuals with regard to the processing of personal data and on the free movement of such data; and repealing Directive 95/46 / EC (General Data Protection Regulation). 2018, Romanian Official Gazette no. 651 of July 26, 2018.
McNabb T., Myers T., and Wicking K., Lei L., and Xiang W. (2018), Optimizing spatial healthcare assets with Internet of Things, Health Information Science and Systems, 6:11, https://doi.org/10.1007/s13755-018-0052-2.