The Bucharest University of Economic Studies, Bucharest, Romania
Volume 2022,
Article ID 123129,
Journal of Human Resources Management Research,
6 pages,
DOI: 10.5171/2022.123129
Received date: 29 March 2022; Accepted date: 18 May 2022; Published date: 14 July 2022
Academic Editor: Andreea Elena Matic
Cite this Article as:
Andrei PUNGAN (2022)," The Relationship Between the Motivation Calculus and The Organizational Performance ‘, Journal of Human Resources Management Research, Vol. 2022 (2022), Article ID 123129, DOI: 10.5171/2022.123129
This study follows the Motivation Calculus of Charles Handy conducted in a large multinational company’s branch located in Romania. The findings have been obtained by analyzing the responses to our questionnaire that tracks the “E” factors from a representative and diverse sample and comparing the results to the individual performance score given by their supervisor.
Keywords: motivation theories, organizational performance, rewards systems
Introduction
In the complex world we are currently living in, in which value is mostly created by the intangible assets an organization has, the motivation of the individual is highly examined, as it has an impact upon the overall organizational performance. To reiterate, motivation theories analyze what drives a person to accept and work towards a goal because the general understanding is that motivated individuals are more productive.
This study will follow on Charles Handy’s Motivation Calculus and it’s three main points: needs, “E” factors and results, then compare the overall score of the questionnaire on “E” factors to the performance score the employees from the sample had during their last performance review in a large multinational IT company branch from Romania.
Literature Review
Charles Handy’s Motivation Calculus was introduced for the first time, in his revolutionary book from 1976, “Understanding organizations”, as an extension of Abraham Maslow’s Hierarchy of Needs, because it states that each individual is a complex system and is usually driven by forces that overpower its sets of needs. In the same book it is argued that the individual also has a set of desired results, that once contemplated upon, will put the individual in a position to decide on how much effort, energy, excitement, and expenditure (“E” factors) to put out in order to accomplish the organizational goals that were set and have to be achieved inside the organization.
“This approach is based on the idea that we are self-activating organisms, and can, to some degree, control our own destiny and our own responses to pressures, that we can select our goals and choose the paths towards them” (Handy., 1999).
The motivation calculus is based on:
The Path-Goal, that is “a clear confirmation of the importance of the role of rational aspects in the determination of productivity behavior and serve to re-emphasize the fact that productivity is a function of both facilitating and inhibiting forces, forces of an individual as well as of a situational character.” (Georgopoulos, et al., 1957)
Vroom’s theory of motivation makes a case that the motivation of each individual is practically a product of three factors:
Valence – what is the importance, given by them, to a supposed reward if they met the goals set;
Instrumentality – how confident they are that they will receive the reward if the goals are met;
Expectancy – how confident they are that the extra effort will help them achieve the goals set.
Porter and Lawler’s Expectancy Model stipulates that the individual’s performance is based on a multitude of factors and characteristics that are directly linked with the person at hand, such as personality type, skills, and experience. The model has its base on expectancy: “the belief that increased effort leads to better performance” (Porter, Lawler, 1968).
The base of the motivation calculus, represented by the three models, relates to building up different hypotheses from them. For this reason, the author considered that this will limit his model, as they are looking only at particular situations, in which the individual has a low number of options to choose from, and the author has “been concerned to extend the implications of their models and to link them with other concepts such as psychological maturity, the psychological contract, dissonance reduction, in order to give them wider, but less exact, predictability” (Handy, 1999).
Without a doubt, almost all theories of motivation track assumptions about the drives and needs of the individuals, each theory on motivation having an increased number of variables that are taken into consideration for each theory that is portrayed. As the diversity of items can be overwhelming, it must not be overlooked the fact that each individual has his own set of different needs and drives that can be different based on the context the individual is at the moment, and that they can change over time as the individual is subjected to internal and external factors.
At the same time, the calculation becomes hard to be carried out if the results are not clear enough for the person. The individual will be in a position in which he will not be sure that his needs will be met, as the results are unclear or hard to attain. Correspondingly, the “performance improves in relation to the quantity of feedback or knowledge of results” (Leavitt & Mueller, 1951), thus making the individual hostile when he is completely unaware or there is a lack of knowledge of the desired results and a high level of feedback elevates confidence of the individuals.
As soon as the person considers his needs are met, he will often do the motivation calculus at a conscious or unconscious level. The result will impact the attitude of the individual and bring results based on the calculation done.
At the same time, we must mention that this is not a recurring decision mechanism that people are doing each time that they take a decision, but only “the ultimate and underlying” mechanism (Handy, 1999).
This relationship is in effect a circle, as the results will impact the needs that will ultimately bring satisfaction to the individual. The said satisfaction is a result and not the cause of productivity or performance.
Case study
This study has been conducted using a quantitative investigation. The main tool used has been a questionnaire that was addressed to Romanian employees of a multinational British based company that has as scope of work global software technology, with more than forty years of experience in creating, delivering, and supporting enterprise software solutions.
In Romania it employs more than six hundred people and has one of the largest and most important operational hubs in the world, that is covering global functions such as: Finance, HR, Sales, Marketing, Software Research & Development. By reason of confidentiality grounds, no further details about the company will be given or mentioned in the part that follows.
The questionnaire and the performance review
The questionnaire analyzes the opinions of a randomly selected sample of 73 respondents (n = 73), with different management positions, ages, and backgrounds.
The questionnaire was completed in the period of September to October 2021 using Google Forms, and the performance score was finished between December 2021 to January 2022 in the company internal software.
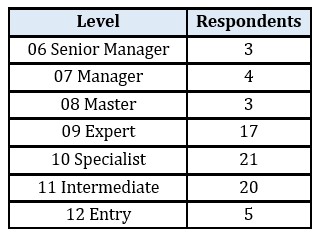
Out of the total, 7 respondents (10%) of them have management roles and are supervisors, and the rest of the 66 respondents (90%) are regular employees.
Table 1 – Respondent’s management level
Source: Authors’ own contribution
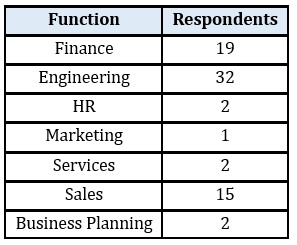
The respondent’s background is diverse as the sample is representative inside the population. For this reason, we can observe that the respondents are part of different functions of the organization such as Finance, Sales, and Engineering.
Table 2 – Respondent’s background function
Source: Authors’ own contribution
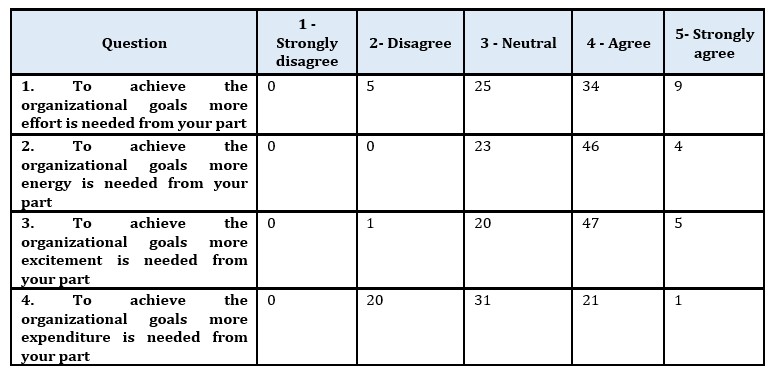
The questionnaire analyses the opinions of the respondents on the four specific questions that are following the four “E” factors considered in our study, in order to understand the respondent’s own importance given to the four factors as a way to achieve the organizational goals.
The wording used in the questionnaire is simple and straightforward. It was intended that the query methods lead to representative and valid results as we have used the Likert scale with five grades (from total disagreement to total agreement), an ordinary attitude scale that is mostly used in opinion polls around the world, that is indicating the intensity each respondent sets upon a question.
Table 3 – The questionnaire
Source: Authors’ own contribution
Calculation method for Question 1, (1*0+2*5+3*25+4*34+5*9)/73=3.6438
Calculation method for Question 2, (1*0+2*0+3*23+4*46+5*4)/73=3.7397
Calculation method for Question 3, (1*0+2*1+3*20+4*47+5*5)/73=3.7671
Calculation method for Question 4, (1*0+2*20+3*31+4*21+5*1)/73=3.0410
After the end of each Financial Year, all employee’s performance is analyzed and reviewed by his direct supervision based on a series of points from the company’s performance matrix and then shared and explained to the employee.
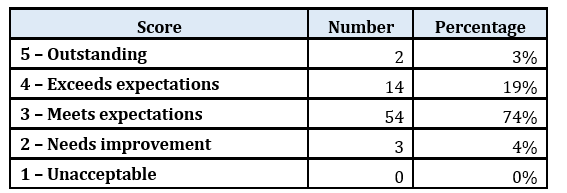
Below you can find the performance score obtained by our sample on a scale from 1 (lowest score) to 5 (highest score). We can see that only 2 employees (3%) obtained an outstanding mark, 3 employees (4%) are in need of improvement as their performance was not satisfactory for the organization, and the gross of them 68 employees (93%) are meeting expectations, thus we consider that their performance was satisfactory, and they have achieved the organizational goals.
Table 4 – The Performance Score
Source: Authors’ own contribution
Quantitative Research
In the statistical analysis of the data, we have calculated the Pearson correlation coefficient (r), which is one of the most widely used statistics test in the socio-economic sciences. It measures the intensity and meaning of the connection between two variables, thus we can demonstrate with its help the dependence of the Performance score on the “E” factors intensity the employees decided to apply.
The Pearson coefficient formula is shown below, where both mx and my are the averages, and x and y are the variables.
The correlation coefficient can take values in the range of (-1, +1), meaning values between -1 (negative, inverse, and perfect correlation), and +1 (positive, direct, and perfect correlation). A coefficient of 0 represents a total absence of any correlation or the total independence of the variable between them.
r coefficient can be interpreted as below:
|rxy| = (0;0.1) – a connection that is either non-existent or very weak;
|rxy| = (0.1;0.3) – a weak connection that requires the application of the Student test to verify the statistical significance;
|rxy| = (0.3;0.5) – a medium intensity connection;
|rxy| = (0.5;0.7) – a strong connection;
|rxy| = (0.7;0.9) – a very strong connection;
|rxy| = (0.9;0.1) – an almost perfect connection;
Note that, when the Pearson coefficient is used, we cannot have an independent variable and we consider both variables to be dependent and influence each other. Essentially, through the statistical correlations performed, we cannot determine their causality, we only know that they vary and the direction in which they do, but we do not know which influences the other.
For that reason, at the end of the correlation testing, it is recommended also the interpretation of the determination coefficient, and not the interpretation of the correlation coefficient, as the latter provides an interpretation of the covariance that is higher than in reality.
Thus, either shows the causal relationship between two variables. Higher values of the Pearson coefficient lead to higher values of the coefficient of determination.
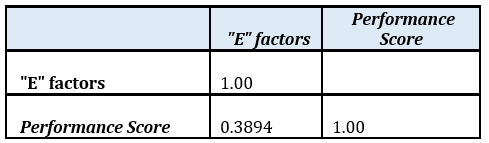
Table 5 – Correlation of “E” Factors and Performance Score
Source: Authors’ own contribution
In our case, we have obtained an r coefficient of 0.3894 that can be interpreted as a medium intensity connection between the “E” Factor and the Performance Score.
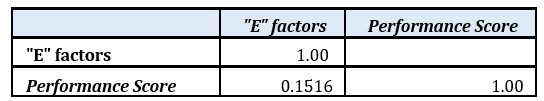
Table 6 – Determination coefficient
Source: Authors’ own contribution
The determination coefficient in our study between the two analyzed variables is 15.16%.
Conclusions
We can see that there is a connection between the importance each employee deliberately gives to the four tracked “E” factors: effort, energy, excitement, and expenditure, and the performance score they have obtained during the period of analysis.
At the same time, this is a medium intensity connection which measures the intensity and meaning of the connection between two variables. In our case, the strength of the relationship is medium, meaning there is a connection but not a strong one between the two.
The determination coefficient is important to be analysed because we must know the difference between the statistical significance of the correlation and the practical relevance of the results as the high determination coefficient does not always signify the fact that it has the same practical significance
For this reason, we have calculated it, obtaining a result of r2 = 15.16% which indicates the variance percentage the two variables have in common.
Overall, we can say that there is a medium relationship between how the individuals admittedly understood the rewards that will be given to them, if they achieve the organizational goals, thus, they have used effort, energy, excitement, and expenditure towards reaching those goals.
References
Georgopoulos, B. S., Mahoney, G. M., & Jones, N. W., Jr. (1957). A path-goal approach to productivity. Journal of Applied Psychology, 41(6), 345–353.