University of Chemistry and Technology Prague, Technická, Prague, Czech Republic
Volume 2018,
Article ID 825250,
Journal of Innovation and Business Best Practice,
10 pages,
DOI: 10.5171/2018.825250
Received date: 2 March 2017; Accepted date: 21 June 2018; Published date: 24 December 2018
Academic Editor: Alfred Paszek
Cite this Article as:
Dana Strachotová and Svatopluk Strachota (2018)," Lean Production during the Processing of Plastic Moldings", Journal of Innovation & Business Best Practice, Vol. 2018 (2018), Article ID 825250, DOI: 10.5171/2018.825250
The paper describes the process of optimizing this line in 2017 which was based, on repeated balancing, on the preparation of a lean workplace concept (through a suitable lay-out and standardization) and on the measurement of time consumption of individual operations. It is a company dealing with the processing of plastics moldings. The production on the line that is subject to the analysis was launched gradually in 2016/2017. The balancing process was mainly based on the Yamazumi Chart. The time consumption for individual operations was measured by direct measurement and, in the design stage, the system Basic MOST (method of indirect measurement of time consumption) was used. The paper also addresses the problem of suitable metrics, which will be used for characterization of the “lean nature” of production. Using the common indicator – the productivity – we have identified an improvement in productivity by almost 40%.
Keywords: production line balancing, lay-out, standardization, time consumption measurement.
Introduction
Increasing productivity is an objective of any company regardless of its business area (Imai, 1999). In the industrial areas dominated by mechanical operations, the methods of Industrial Engineering (hereinafter referred to as the “IE”) have been developing since 1990s (Maynard, Zandin, 2005). Through their implementation, companies can achieve more efficient utilization of their resources without the need of additional investments, which results in cost reduction.
According to Narusawa & Shook (2011), IE methods form the foundation of the so-called “lean company” concept, where these methods are applied via four pillars (lean production, lean logistics, lead administration and lean development). The implicit question is which metrics can characterize the “lean nature” of the company. The extent to which, e.g., improved productivity or another indicator is actually resulting from a certain IE method, needs to be assessed individually by the methods used also by business activities where such a method has been implemented.
As far as the companies in chemical industry are concerned, we find that IE methods are not used in general. Plastics industry can be considered an exception, though (Dlabač, 2016). The application described here, in plastics industry, consists in the application of the lean workplace concept and standardization. To be more specific, it involves the definition of spatial lay-out of the production line with respect to the material flow and customer requirements, which determines so-called tact. Within this application, standardization of work processes shall be used based on measurement of workload and standardization of positions of jigs, tools and material on the line.
Initial Parameters of the Production Line
In its initial condition, the line under analysis allowed production of a total of 17 products, which together formed a set. The input material consisted of plastic shaped parts, leather, softening foam and adhesive. The production process was a combination of mechanical and chemical/technological operations (shape cutting, hot bonding of plastic parts, adhesive injection and bonding, and leather backing). Individual operations were grouped in production cells by the production range items planned for production. The customer’s initial requirement was to make 12 sets a day. However, it is expected that by optimizing the line, 14 sets manufactured a day may be achieved.
Methodology
Optimizing the production line and workplace with the objective of establishing a lean production process requires an analysis of the existing process. In the design stage of the new lay-out, it is necessary to make an effort to meet the parameters of a lean workplace. The basic characteristics of a lean workplace, according to Ohno (1988), include optimized material flow, flexibility of workplace with defined optimized work procedure, zero waste, ergonomics, standardization, machinery efficiency, etc. The methodological procedures can be summarized in the following steps (Tapping et al., 2003, Hines et al., 1998, Narusawa, Shook, 2011, etc.):
Line balancing, determination of line tact and number of operators
Preparation of a concept of spatial lay-out of the workplace
Measurements of time consumption for individual operations using methods of direct measurements; this project included benchmarking using the Basic MOST method for selected operations.
Identification of metrics and subsequent expression of work productivity
Operational Balancing and Line Tact
The production line’s tact (Tact-Time, TT) is, in case of a lean workplace, usually determined by the customer. It is the time interval, in which the customer collects the finished product. This interval directly determines the tact of the flow of finished product within the entire process so as to cover the customer’s requirements without excessive overproduction (Imai, 1999). In the case of the line under analysis, the tact was determined based on the customer’s requirements in autumn 2015 and on long-term working hours of the line operators. Formula for calculation of TT (Formula 1):
Cycle Time (CT) is the time for each line operator to carry out their production operation. These time values are determined using the methods of time and motion studies; for newly designed workplaces, according to Višňanský (2010), these particularly include approximate motion studies and Predefined Time Systems (Maynard, Zandin, 2005). Cycle Time is used to determine the number of operators necessary for the operation of the production process; it is calculated using the following formula (Formula 2):
The total time consumption in Formula 2 is the sum of all individual CT operations. This formula represents an indication for the design of the line; if the result is not an integer value, then the number of operators is usually rounded up. We can assume, though, that the CT values of operators will improve (i.e. decrease) after training; equalling the TT value. In general, the optimum condition is CT=TT.
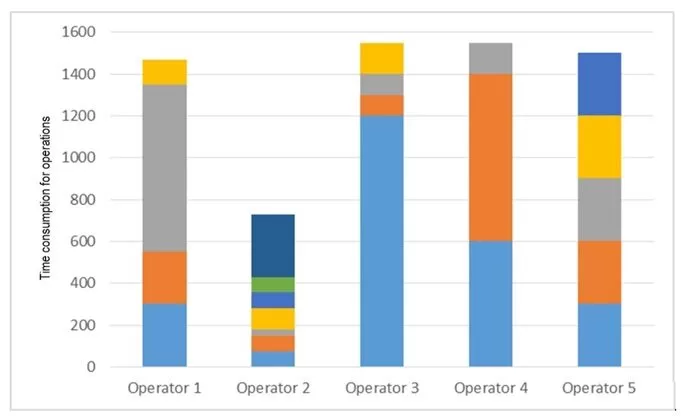
For balancing of operations between individual operators at the workplace, it is necessary to monitor the operator workload; the level of line balance is determined using a cycle chart (Cycle Times Chart, so-called Yamazumi Chart). This is a bar graph which indicates individual CT values distributed between operators within given production cell. For instance, in one of the monitored cells, there were five operators working on the line (see Fig. 1). This visualization tool allows for transparent planning of operator’s activities. In the optimum case, individual activities (i.e. their CTs) can be distributed in such a manner that all the operators are equally loaded. This graph allows showing both cyclic and irregular activities for planning activity assignments for the entire shift (the individual colours in the diagram distinguish individual operator activity). It can also be used by a process analysis, allowing visualization of operations adding and not adding value.
Fig. 1: Yamazumi Chart (singular colors indicate the type of operator activity)
(Source: own study)
Lay-Out – Workplace Concept Design
The designed lay-out of a lean workplace is based on the knowledge of material flows and a list of activities within a given production cell (assembly chart). Complementary information includes the number of operators and customer’s tact and, if needed, the information flow concept. Based on this knowledge, we can start designing the lay-out of individual work stations within the production cell. A production station refers to a workplace or a workplace equipped with a production machine, which is manned with an operator. There are four basic lay-outs of work stations (linear, L-shaped, U-shaped and so-called Spine shape). Each of these lay-outs is specific and the resulting lay-out can be a combination of these four forms. The linear lay-out is simple in terms of planning, management, logistics and manipulation. It allows access from both sides and there is no risk of material cumulating at the input or output. The L-shaped lay-out allows, e.g., deflecting complex or dangerous work activities, while the Spine shape is characterized by the fact that it allows separation of special equipment, which makes it suitable for highly-variable production processes. For a lean workplace, the preferred lay-out is the U-shaped one as it offers the following benefits:
There are no crossings between operator activities and supply of material, which flows from the rear end of the line
The line starts and ends on the main communication path
Short distances between operations (minimized distance between the first and last operations)
No communication obstacles between operators
It allows assignment of multiple operations to a single employee to improve the line balance
The shape and dimensions of the premises available are decisive for the lay-out design. Very useful tools in this area include computer 2D/3D models, which can be designed with all necessary elements in 1:1 scale. There can be multiple resulting lay-out options; for the selection of the best option, we can use multi-criteria comparison. For this comparison, we need to define the criteria (e.g. costs, spatial demands, flexibility etc.) and their weights (Dlabač, 2016).
Determination of Time Consumption
The methods of work time consumption measurement can be considered as the oldest IE methods. Prior to the measurement time consumption, however, we need to eliminate all waste at the workplace; this requires identification of the waste. For this purpose, we can use either time and motion studies or VSM (Value Stream Management or Value Stream Mapping), or process analysis and other tools offering more general application (Hines et al., 1998, Tapping et all., 2003, etc.). For plastics production, which is the subject of our analysis, it was mostly time studies; however, a motion study was also used for one of the operations for the purpose of comparison.
The measurement itself is preceded by thorough preparation, which includes the selection of the measured process or operator, familiarization with the process and selection of measured processes. Here we can, e.g., select the measurement detail level, divide the existing processes into value adding and value non-adding ones etc. Moreover, it is necessary to determine the number of observations to avoid biased results. For the determination of suitable number of observations (n), Maynard and Zandin (2005), Višňanský (2010), etc. provide the following Formula 3:
In Formula 3: (z) represents the required reliability level,
(s) is the standard deviation,
(k) is the acceptable error (in %)
() is the arithmetic average.
This way, we can calculate the number of observations, so that the marginal error at the required reliability level is not exceeded. Then we can continue with the procedure and, after informing the employees at the workplace under analysis with the intended measurement, we start the collection of observations. What is essential is the communication and agreement with the operators of the process under measurement as the presence of the person performing the measurement or a video camera can influence the performance of employees.
The comparative measurement of selected operations was carried out using the indirect method of time consumption measurement (or the Predetermined Time Systems – PTS). Examples of PTS systems used in practice include: The Work-Factor System, MODAPTS, MTM, UMS, SDS, UAS, and MOST. The MTM (Methods Time Measurement) system is among the most popular systems. Other commonly used systems (MTM-SD, MTM2, UAS, and USD) are based on this system and it is widely applied in mass and large volume production. This system requires a comprehensive description of movements carried out (type, demandingness, weight of objects, distances, etc.). The complexity and high time demands of the entire analysis and the effort to speed up the system resulted in the development of other systems that could be applied in small batch production.
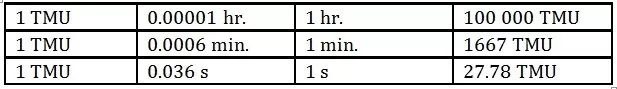
These systems also include the methodology group MOST (Maynard Operation Sequence Technique). It is a system of predefined time values which allows for a wide range of applications in various industrial sectors. MOST is based on the principle that any physical work is, essentially, a process of putting forth energy to fulfil a task, i.e., a process of transposition of the matter. The concept of this system came from Kjell Zandin (Maynard, Zandin, 2005). When designing models for the determination of time consumption according to this author, so-called TMUs (Time Measurement Units) are used instead of the standard time units; the conversion table is as follows:
Table 1: Conversion of TMU (Source: authors)
To collect information on the time consumption for individual operations, the methods of working day chart or chart of individual operations were used in the period after the line has run in. The monitoring took place continuously during selected shifts from December 2015 to September 2016. The objective was to collect raw information on the duration of processes after the staffs were trained.
To obtain more accurate values at specific stations, the method of repeated partial working day chart was selected. This method involves recording activities in the form of video. The video recordings were subsequently evaluated with a stress laid on the total time consumption for given operation as well as on the assessment of any waste and delays in the production process. For the sake of comparison of plausibility of the time charts, a motion study was also carried out for the selected operation. This motion study was based on video recordings. These were analyzed using the Basic MOST system, which was selected with respect to the duration of operation (approx. 10 to 13 s).
Representation of Productivity
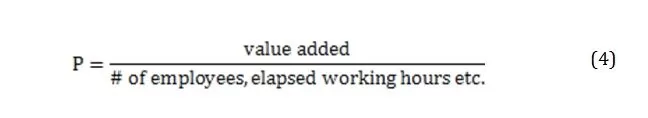
The work productivity was selected as the metrics for the assessment of the results achieved. Productivity assessment is an integral part of production system optimization. At the most general level, it can be expressed as the ratio of the process output to necessary input resources of the process. The outputs are expressed in units such as litres, grams or pieces, or in financial units (e.g. as a value added). This usually applies to the outputs, which cannot be defined individually; the financial data represent the production values. The inputs represent the costs entering the process expressed either in physical units or financially. Productivity can be somewhat generalized by Formula 4:
Productivity is, within the production process, influenced by a wide range of external and internal factors. According to Ohno (1988), Imai (1999) etc., these influences include work procedures and methods, quality of machinery, utilization of capital, workforce skill level, assessment and remuneration system, level of industrial engineering methods, condition of infrastructure (roads, telecommunication networks etc.), current economic situation and so on. Besides these factors, it is influenced by many other factors, either physical or psychological.
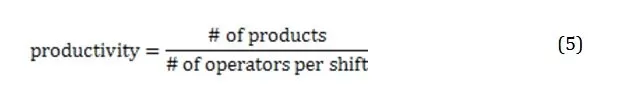
When assessing the success rate of balancing operations between different workplaces in the updated line under analysis, the specific Formula 5 was used for productivity measurement:
Conclusions and Discussion
As mentioned above, the initial customer’s requirement was to produce 12 sets per day. By optimizing the line, though, it is expected to achieve 14 sets per day. The manufacturer’s time resources are determined by double-shift operation and usable time of 420 min. per shift. Formula No. 1 clearly implies that the production line tact (TT) must be 70 minutes or, in case of increased customer demand, 60 minutes.
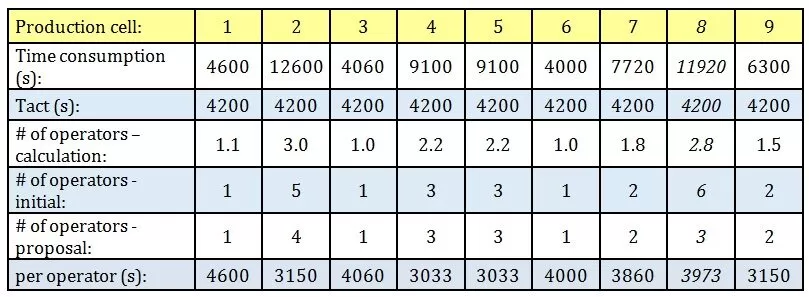
To define the total time consumption, it was necessary to measure the time consumption of all the operations used for all parts of the set with the required accuracy as per Formula 3. These measurements were carried out when the line was being put into operation. Based on these measurements, a proposal for workplace reorganization (a new lay-out) of the line was prepared with respect to the necessary number of operators. That is why individual operations were newly assigned with the aim of synchronizing the operation times within the production cells with the line tact time. Formula No. 2 was used to calculate the optimum number of operators; the distribution of activities within the shift is summarized in Table 2:
There is a clear reduction by 4 operators (in production cells No. 2 and 8). Yamazumi Chart for the entire line (Fig. 2) clearly shows that, after the reorganization, the required tact is still exceeded by the first production cell. With respect to the measurements carried out upon the initiation of production, however, we can assume that this production cell shall be fine-tuned as well after the operator training. For the same reason, time margins were established for the production cells, where we can expect certain problems in the future and which are therefore considered as bottlenecks.
Table 2: Tact time and number of operators (Source: own study)
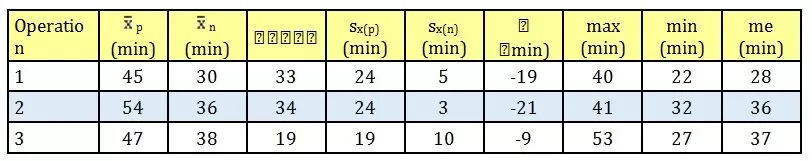
The new lay-out, i.e., new assignment of activities to operators and reduction of their number, are the essential measures for improvement of productivity. Nevertheless, for the sake of standardization of work procedures as well as workplace, materials and jigs, it was necessary to carry out new measurements on the line after sufficient training of all operators. The measurements were carried out for all operations and all parts of the set (products). It was interesting to watch the results measured. Table 3 shows an example of comparison of the measured values by means of the average value () and the standard deviation (sx). The indexes distinguish the values measured in the initial lay-out (p) and in the new lay-out (n). Both situations are compared by the absolute (sx) or relative () deviation. The table also summarizes the minimum and maximum values measured in the new lay-out (min, max) and the median (me).
Table 3: Comparison of time consumption for selected product (Source: own study)
The calculated values of statistical characteristics allowed further analysis. For the operations and products which showed significant improvement, we assumed the operator training to be sufficient. For products and operations where the mean values and variability levels did not show sufficient improvement, further analysis was carried out. Individual activities performed under a given operation were examined in a more detail, usually with classification to value adding/value non-adding activities. This analysis resulted in more accurate standards for work, workplace, materials and tools with respect to the typical specifics of the morning/afternoon shift. The eliminated waste included e.g.:
Correct positions of light switches
Suitable location of radio receiver with the possibility of easy control
Installation of jigs for hanging of softening foam tapes, which allows transporting between workplaces, eliminating the unnecessary movements of employees
Removal of contamination of semi-product racks resulting from unsuitable rack cleaning cycle, which caused frequent immobility of these racks, etc.
For selected operations, further comparative measurement was carried out through a motion study using the Basic MOST method. There was usually a very high conformity between the motion study results and the time charts (e.g. for operation with time 11.75 min., 18,250 TMU were assigned, which corresponds to 666.19 s, i.e. 11.1 min). From the manufacturer’s viewpoint, this means that the time consumption standards can be very accurately derived from the time studies as well as motion studies, while in the case of a newly balanced line, also the existing videos of certain operations (recorded after the line rearrangement and operator training) may be used.
Summary
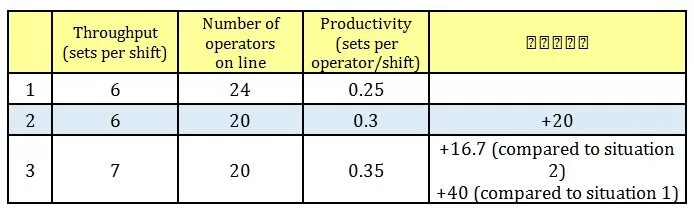
Table 2 shows that the line optimization resulted in reduction by 4 operators per shift (instead of the initial number of 24, only 20 operators should be sufficient for the same throughput of the line after reorganization). Moreover, the line balancing process allowed for certain reserve for possible improvement of the throughput from current 6 sets (products) per shift to 7 sets (with respect to the possibility of higher customer demand). After detailed analysis of all operations and elimination of all types of waste, we can actually rely on this level of throughput.
If we assess the achieved and planned values in terms of the productivity indicator (Formula 5), we can quantify the resulting changes. The calculation is based on the assumption that every shift produces an entire set (i.e. 17 parts); however, this was not the case at the time of calculation. This objective will require further reorganization of the line’s information system. For the productivity calculation, the median was preferred over the average. The reason is that the median conveys more valuable information on the operator’s capability to carry out given repeated activity in a similar amount of time. Changes in the productivity indicator are shown in Table 4:
Table 4: Changes in productivity indicator (Source: own study)
Hines, P., Rich, N., Brunt, D., Taylor, D., Butterworth, C., & Sullivan, J. (1998) “Value stream management.” The International Journal of Logistics Management, 9, 25-42.
Imai, M., & Heymans, B. (1999) Gemba Kaizen. A Commonsense approach to a continuous improvement strategy. Berrett-Koehler Communications, San Francisco, CA.