The Bucharest University of Economic Studies, ASE Bucharest, Romania
Volume 2019,
Article ID 684771,
Journal of Innovation and Business Best Practice,
24 pages,
DOI: 10.5171/2019.684771
Received date: 1 March 2017; Accepted date: 18 December 2018; Published date: 1 February 2019
Academic Editor: Klara Antlova
Cite this Article as:
Gabriel Jipa (2019)," IT Employee Satisfaction in a Bank", Journal of Innovation & Business Best Practice, Vol. 2019 (2019), Article ID 684771, DOI: 10.5171/2019.684771
Employee IT user satisfaction is important for companies, especially in regulated industries as financial services, especially for workers interacting directly with the clients. This paper analyses the impact of various factors against rating given for IT User Satisfaction in a bank. In retail banking, customer-facing employees need to provide service for simple or complex transaction, as well as financial advice. We found that IT user experience is influenced positively by the trust in organization willingness to change based on the user’s feedback as well as the support provided as helpdesk but negatively impacted by multiple application performance, stability issues or infrastructure performance, as part of the expected value of using IT as a job support tool. Qualitative-exploratory and quantitative research was performed using techniques as segmentation, decision tree or multinomial linear regression. Data analysis was performed on 608 survey responses out of a population of 3000 individuals. Transcript data collected during interviews was processed using natural language processing technics in Python in parallel to human driven classification to provide additional potential insight as part of content analysis phase (clustering of keywords based on tfidf vectors scores, extraction of most relevant words for clusters). We found that textual data are very powerful especially when using visualization but in general due limited corpus size and bias from selection process in interviews would be useful to collect more data, maybe from helpdesk system and email communication for IT support. Theoretical and practical implications are discussed through the lens of the Technology Acceptance Model to explain the impact of the main factors influencing the perception of the overall IT landscape.
This paper is an extension of “Employee Satisfaction – IT user experience evaluation in banking – A case study” (Jipa, 2017) and is focused on the practical and managerial perspective of findings. It includes a broader presentation of the qualitative research as well as alternatives to the quantitative research methods applicable to this research using supervised or unsupervised machine learning models. It is general knowledge that regulated industries, as banking or financial services must adhere to strict regulations and compliance. That leads to mandatory use of Information Technology systems as well as strict processes. Some banking client services do not require anymore presence in a branch, giving the proliferation of self service channels due cost or accessibility considerations (Ha and Stoel, 2009; Shumaila, Foxall and Pallister, 2010; Singh, Srivastava and Srivastava, 2010; Hew et al., 2015; Hew, 2017). While the adoption of technology is mandatory, it’s performance and functionalities can negatively impact the intrinsic motivation (Deci, 1972; Eisenberger et al., 1997).
From a data analysis perspective, techniques as linear regression are generally used to easily explain managerial implications and impact of various variables derived from literature on IT user satisfaction. Alternate approaches as neural networks or complex models generate a black box model that is not easily understood or explained but could help in identifying hidden patterns or identifying bias introduced by data collection, sampling or survey instrument design. Thus statistical approach based on rejecting or accepting hypothesis is very powerful for the decision-making process. One challenge in conducing qualitative research is performing content analysis on interview transcripts or other data sources because of the bias introduced by the operator’s interpretation, classification or errors in analysis. Natural language processing of text format data, collected from scripts, observation notes or interviews can be analyzed with computer software to identify common themes, combination or association of words and most frequent mentions (Bird, Klein and Loper, 2009). The qualitative research can benefit of evaluation of potential segments using K-mean clustering algorithms as well as exploration of different modeling techniques, as well as potential impact of high correlation of some variables.
Critical Literature Review
With the continous development of new electronic data processing technologies and mass adoption of Internet, the need to study factors that could explain the succes of introducing a new technology accelerated. While the subject is very broad, it was necessary to identify the factors that influence the way and when technology is used. One popular model is TAM, a further development of TRA. Theory of Reasoned Action (TRA) (Ajzen et al., 1980); Martin Fishbein and Icek Ajzen 1975, 1980) is a model for predicting behavioral intention, with a research focus on attitude, wich led to the study of attitude and behavior. The paper investigates the potential factors that influence positively or negatively the employee satisfaction by use of IT User experience and evaluates how banks could prioritize and perform corrective actions using a conceptual model derived from Technology Acceptance Model (or abbreviated in this paper as TAM) (Davis, Bagozzi and Warshaw, 1989a; Davis, 1993; Davis, Bagozzi and Warshaw, 2012). In this regard, job satisfaction could be viewed as a measurement of how bank employees feel regarding their working environment that includes applications, communication links, systems, and peripheral devices. Organizational factors as trust or expectations of support from organization itself are critically important (Eisenberger et al., 1997).
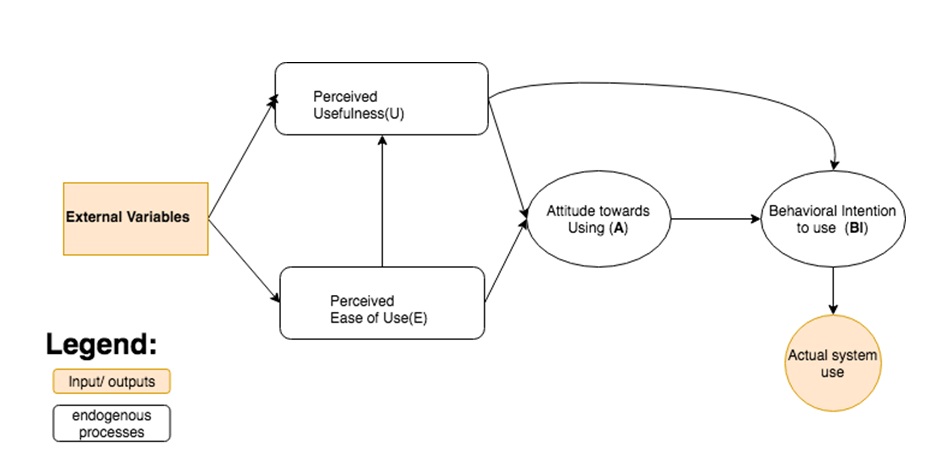
The Technology Acceptance Model (TAM) is based on well-established theories of general consumer behavior: Theory of Reasoned Action (TRA) and Theory of Planned Behavior (TPB). The Technology Acceptance Model is an adaptation of the Theory of Reasoned Action (Ajzen and Fishbein, 1980) regarding employee adoption and usage of IT enabled systems in order to support management decision of change (Davis, Bagozzi and Warshaw, 1989c). One of the most widely employed model of IT adoption and use is the technology acceptance model (TAM) that has been shown to be highly predictive of IT adoption and use (Wixom and Todd, 2005), or how users’ perception (Davis, Bagozzi and Warshaw, 1989b) and attitude (Venkatesh and Davis, 2000) influences behavioral intention and atitude towards using it. One of the most common criticisms of TAM has been the lack of actionable guidance to practitioners (Lee, Kozar and Larsen, 2003). Literature presents the overview of TAM evolution from its appearance in 1986 to model extensions or elaborations (Lee, Kozar and Larsen, 2003). It was used in numerous studies to explain the user acceptance of information technology at various environments (Davis, 1989). TAM is focused on two main constructs, Perceived Usefullnes, that aggregates at a conceptual level factors related to functional aspects and Perceived Ease of Use that we use to evaluate the user experience, as evaluation of the degree of a person’s belief that using a particular system would be free from effort (Davis, 1989). The TAM model (TAM) shows how the event driven model could increase actual system usage. Behavioral intention indicates the level of individuas’ readiness to perform a given behavior, assumed to be an immediate antecedent of behavior (Ajzen and Fishbein, 1980). According to (Davis, 1989), TAM is based on attitude toward the behavior, subjective norm, and perceived behavioral control. Each predictor is weighted for its importance in relation to the behavior and population of interest. User acceptance represents a critical factor (Davis, 1993) that influences the success or failure of an information system, especially in mandatory environments (Hwang, Al-Arabiat and Shin, 2015). Thus, measuring the behavior was not relevant in this case. Using original notation, the term external variables influences the perceived usefulness (U) and perceived easy of use (E). External variables also include all the system design features. Attitude toward using construct has an indirect influence effect to the actual system use (Davis, 1993)
Figure 1: TAM Model Version 1 (Davis, Bagozzi and Warshaw, 1989b).
Source: Author drawing
The original model of TAM had a series of developments over time and is used frequently to describe technology adoption or continuation of use (Venkatesh and Bala, 2008; Venkatesh, 2003; Lee, Kozar and Larsen, 2003; Hwang, Al-Arabiat and Shin, 2015). In the banking case presented, employee task fulfillment is dependent of the tools used for completion that include hardware tools, software applications and interconnected systems of data processing. Employee motivation directly influences company performance (Sekhar, Patwardhan and Singh, 2013), showing influence of intrinsic and extrinsic motivation (Deci, 1972) that states that an individual that is internally driven or motivated will behave differently compared with motivation factors that come externally as rewards or punishments. While motivation plays an important factor, its effect is researched in this paper. Job satisfaction was researched by numerous authors but if we accept definition (Locke, 1976) as “a pleasurable or positive emotional state resulting from the appraisal of one’s job or job experiences”, while other authors describe it as a positive affect towards a target environment, as a result of multiple conditions and attributes, influencing the employee motivation (Aziri, 2011; Al-alawi, Al-azri and Mohammad, 2016). Satisfaction can be defined as “an attitudinal variable that measures how a person feels about his or her job, including different facets of the job” (Spector, 1997).
Research objectives and methodology
The study aims to answer the following research questions: How we can model employee satisfaction in relation with IT provided environment within their job role. Can we propose a predictive model to evaluate the impact of decision on IT Environment?
Philosophy of Research: As a general claim, we accept a constructivist approach and follow the following qualitative and quantitative methods (Patten, 2007):
Clearly State Research Topic and Subject and define target Population:
Target Population is Bank’s employee with Teller & Seller Activities in Branch Network. They are customer facing and use a variety of applications and devices as part of job activities. The role played in customer interaction is critical. Target population counts approximately 3000 individuals, working in Front Office, in Sales and Service roles in branches (network). Lists and records are maintained by bank’s human resources systems. Unit of observation and unit of analysis is individual level.
Formulate Research questions and Objectives
Research Question 1: How we can model employee satisfaction in relation with IT provided environment within their job role
Research Question 2: Can we propose a predictive model to evaluate the impact of decision on IT Environment?
Note: In this paper Employee Satisfaction refers to IT User Experiences or IT User satisfaction.
Formulate Research Design, Data Collection, quantitative Analysis, Findings report:
Qualitative and quantitative research included data collection, quantitative analysis and findings report.
During Qualitative Exploratory research, a series of in depth interviews; semi-structured interviews and observations were conducted. More than 30 Branch employees were interviewed and shadowed, in 7 Branch locations with support from Network Line of Business and IT department. We followed general recommendation on research methodology (Saunders, Lewis and Thornhill, 2008; Teodorescu, 2009) as :
Individual in-depth interviews or intensive, duration between 30m to 1 h;
Group discussions, in selected branches 1-2 hours
Semi-structured interviews and shorter interviews (20-30 minutes) to collect information
All sessions were recorded in transcript and processed in word processor and used in a tabular format. That allowed capturing and interpreting all data in order to support model and hypothesis creation. Selection of interview participants was done per literature requirements but from a practical approach and limitations in time and coverage.
Survey design, data processing and analysis. Survey instrument included 33 questions addressing 6 clusters of factors, built around TAM constructs (E) and TAM (U).
Methodology and Data Analysis
TAM model proposes an easy and intuitive model that allows categorization under a series of constructs (Figure 1). Literature describes a series of predefined categories, one being subjective norm (Venkatesh and Bala, 2008) and presents developments of TAM model mentioned in literature as TAM2 and UTAUT (Venkatesh and Davis, 2000; Lee, Lee and Hwang, 2015) but due practical approach a custom model was proposed based on original release of TAM. During interviews, a series of questions indicated a series of applications, devices or areas of concern with different distributions, giving initial directions for model hypothesis.
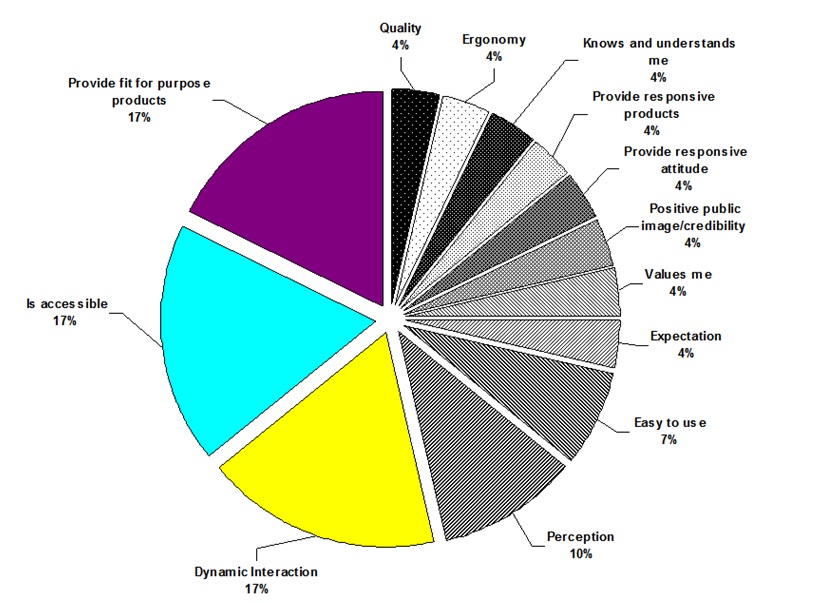
Figure 2: Graph representation of employees’ areas of concern; sample size 32.
Source: Reproduced with permission from Jipa (2017).
It was noticed for example that the user perception is a mix of both positive and negative experience, as employees lack the technical background, expecting simplicity within an integrated IT environment as a tool to fulfill tasks. So, they tend to indicate same application, platform or system both positive and negative from E or U constructs (Figure 1). We derived a model that incorporates all elements and is not focused on application. The main categories of concern during the qualitative research were mapped against E and U TAM constructs. For example, an employee mentioned “Easy to Use” dimension was mapped to “U” Construct, because it refers to the use of handheld devices that automates information extraction and automating filling of data in applications. Another very common finding was: “To navigate between CRM tab is very lengthy, large delays. Screen loads very slow.”, “CRM Is very slow, campaign are very slow but the solution is good for job, helps a lot“. This is important because the same applications are evaluated contradictory also highly as best and worst, but because of different qualities that are relevant to the individual. In the cases above, the root cause of the problems point to the following causes, but indicated CRM as perceived non-performing platform. Thus, the difference in perception indicated the applicability of TAM constructs. Most common negative patterns in interviews related to network speed, application speed and performance of marketing campaign or business intelligence reporting platforms that integrate as external systems. It is also important to note that individuals evaluated the platform qualities in a descriptive way, providing unsolicited explanation to support the categorization.
During qualitative research, higher granularity of roles was identified, more than 20, on top of generic “seller” and “teller” classification. While in large branches (20 + employees), the roles are clearly separated, in small agencies multiple roles are fulfilled by the same employee to identified roles above.
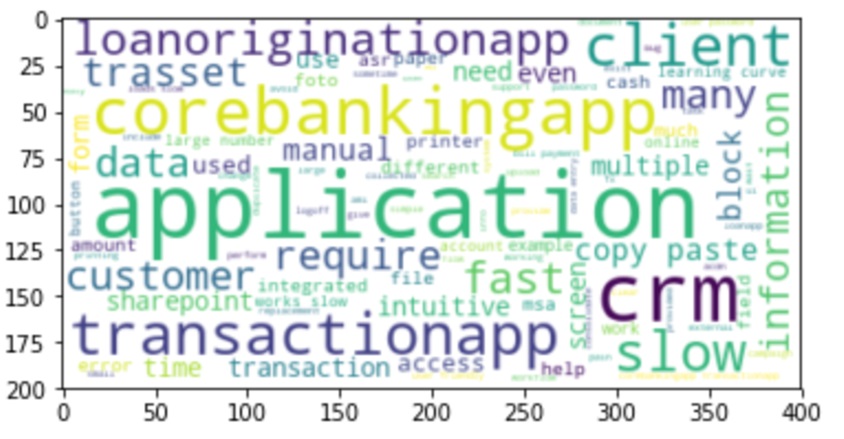
Fig 3: “Wordcloud” plot based on interviews transcript, generated by Author in Python(Bird, Klein and Loper, 2009).
Source: Author generated
Respondents indicated either functional enhancements needed to fulfill their jobs or requests for automation “mortgage file has more than 50 pages, requires manual steps, like renaming, ziping file”, while others discussed the user experience, providing comparisons between technologies: “the most difficult application is corebankingapp – it is not intuitive or simple but comparing, crm is much simple application from the usability pov“. In that case, the corebanking platform is a “green terminal emulator, character and menu based” application while crm platform is web based. Undelaying technology is helping from easy to use point of view, but is not sufficient, many improvements being suggested, especially for contextual help provided by applications: “sharepoint is not predictable as system response, required manual interventions and uploads.”
Data processing was done manually, coding and classifying statements based on theoretical aspects. TAM model provides an easy and intuitive model that allows categorization based on Perceived Ease of Use and Perceived Usefulness constructs, that influences attitude, a mediator for behavioral intention to use (Venkatesh and Bala, 2008). The current paper is focused on the initial release of TAM (Davis, 1993). Exploratory computer assisted analysis was performed also using Python NLTK (Bird and Loper, 2004). Text processing using computer involved the removal of stopwords (based on NLTK dictionary) and the exploration of frequencies and most relevant terms as [.’learning’, ‘curve’, ‘transactional’, ‘activity’, ‘supervisor’, ‘required’, ‘correction’, ‘approval’, ‘local’, ‘supervising’, ‘used’].
During Qualitative research, a series of questions indicated a series of applications, devices or conditions. It was noticed that the user perception is a mix of both positive and negative experience, as part of non-technical background. So, they tend to indicate the same application, platform or system in both categories.
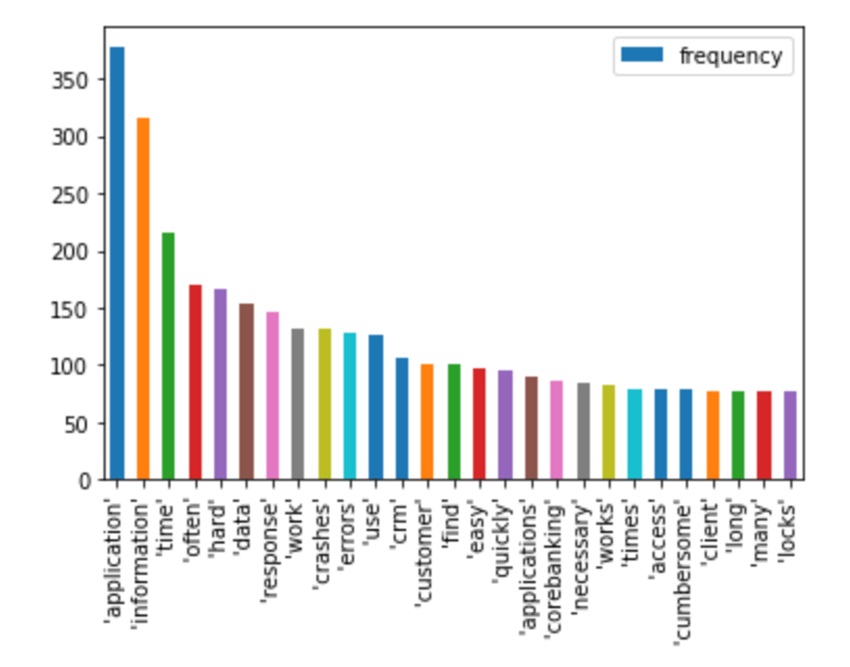
Fig 4: Term frequency in qualitative interview. Plot generated by author, based on frequencies generated from text corpus.
Source: Author generated
Top 3 terms are “application” with 376, “information” with 316 occurrences and “time” with 216. That is linked to some notes from interview related to perceived performance and need for getting quick and accurate information.
A very common finding was: “To navigate between CRM tab is very lengthy, large delays. Screen loads very slow.” “CRM Is very slow, campaign are very slow but the solution is good for job, helps a lot“. This is important because the same applications are scored also highly as best and worst, but because of different qualities that are important to the client.
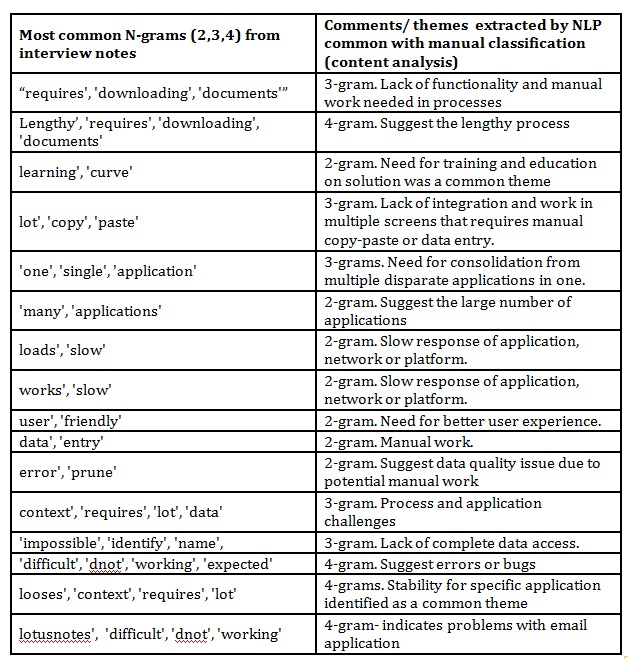
We extracted also the most common n-grams, words in proximity based on text. Due to stopwords’ removal based on standard English nltk library, some words irrelevant to analysis as [“to”, “for”, “when” etc] were excluded.
Table 1: Most frequent n-grams (n words in proximity) in interviews
Source: data extracted using Python NLP, table aggregated by author
In some cases, users indicated CRM as perceived non-performing platform, even if listed also on Top 3 Best support for job, because of other qualities by the very same individuals:
Network speed
Application Speed
Performance of crm and external systems
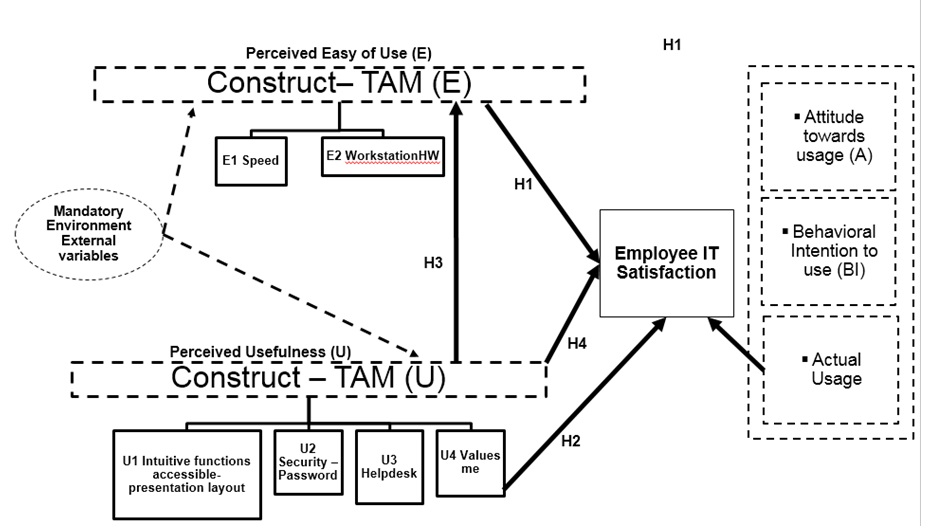
The proposed model builds on top of TAM (Davis, 1989) and includes the dimensions derived from exploratory research.
Figure 4: Proposed Model for the Case Study.
Source: Reproduced with permission from Jipa (2017)
Dotted lines reflect secondary research focus that is not measured in this research. Solid lines indicate primary research focus. During model design, it was noted that TAM (E) or TAM (U) can be evaluated using various techniques, as represents a difficult construct to capture within the questionnaire, giving the generic nature of them. The model closes a loop between Actual system usage and Employee Satisfaction that eventually influences “Attitude towards usage” formation. However, many studies have shown that not always a negative attitude brings less Actual system usage, especially giving the specificity of the job and mandatory environments. The blocks in dotted line as Attitude (A), Behavioral Intention to use (BI) and Actual Usage are not measured by any constructs in this paper. Thus, the following model hypotheses were derived from original TAM model, based on the existing literature (Marangunić and Granić, 2015):
H1: There is a strong influence of variables under Perceived Easy Of Use (E) and Perceive Usefulness (U) on Employee Satisfaction / IT User Experience.
H2: There is a strong positive relationship between Organizational Support (Values me) with Employee Satisfaction / IT User Experience.
H3: A negative perception of variables under Perceived Easy Of Use (E) negatively influences Perceived Usefulness
H4: Perceived Usefulness (U) is a strong influencer of IT Satisfaction.
The quantitative research aimed to determine validity of selection of variables to describe TAM (E) and TAM (U) and determine relationship towards Employee IT Satisfaction. We aimed a probability of 95%, based on a population size of 3000 eligible employees and the online survey instrument recorded 608 valid responses. The data collection was one using survey instrument and processed using IBM SPSS Statistics Software. The survey instrument used Likert scale of 7 points, open-ended and single choice questions. All activities were conducted in Romanian language. Error considered is 0.05. The data collection was done using bank’s internal self-administered platform and analyzed in IBM SPSS Statistics Software, SPSS Modeler17 and Python. All Survey and interviews activities were conducted in Romanian language. For purpose of natural language processing, interview notes were translated using Google translate service.
Measurement in the survey instrument used 10 points scale [1-10] and Likert scale [1-7], (7 is Totally Satisfied or in Agreement/ 4 Neutral point/1 Totally Dissatisfied or in Disagreement). The survey design considered limitations of 5 data point scales (Dawes, 2002) and midpoint relevance (Garland, 1991) towards a non-biased response. Being a mandatory environment, we don’t expect to measure during survey the attitude towards usage or actual system usage, as they are obvious true facts within the Bank environment as well as organizational specific determinants represented as “Mandatory Environment External Variables”. The constructed survey included a series of potential categorical variables, to understand if population characteristics as length of employment or age influence the Employee IT Satisfaction.
Categorical variables collected:
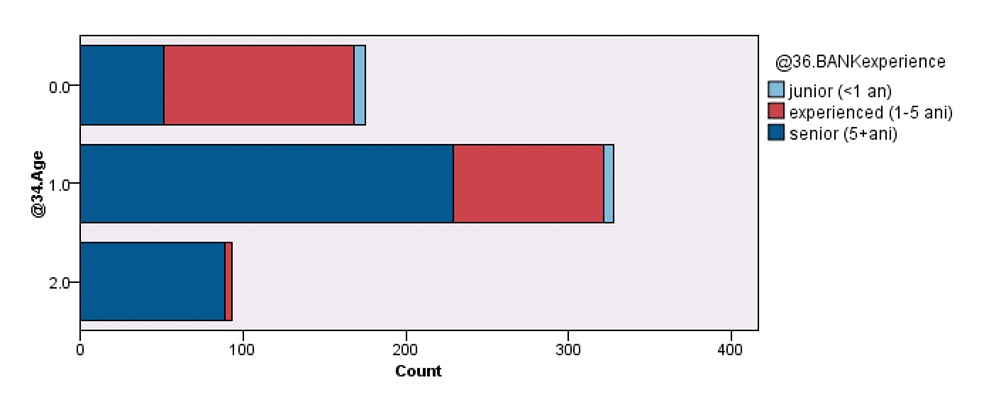
Age (based on 3 categories: Cat 0- younger than 30 years, 29.36% of sample; Cat 1-between 31 and 45, 55.03 of sample size; Cat 2 -older than 46, counting for 15.6 of total sample.).
Job Role: Seller/ Service/Mixt/ Other Client Facing
Experience years of employment in bank (based on 3 levels). It noted that respondents’ distribution of experienced or senior employees is high, junior totaling 2.18% of respondents
No gender information was collected.
Fig 5: Age / Experience in bank distribution.
Source: Author generated
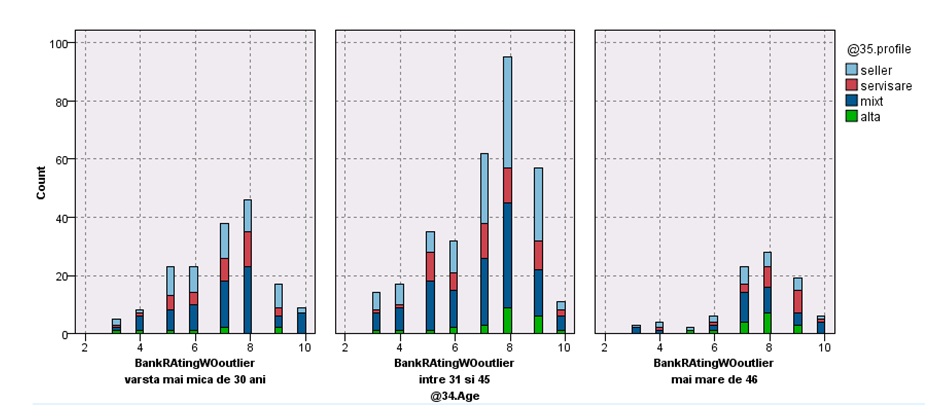
Fig 6: User experience rating distribution filtered by Role and age.
Source: Author generated
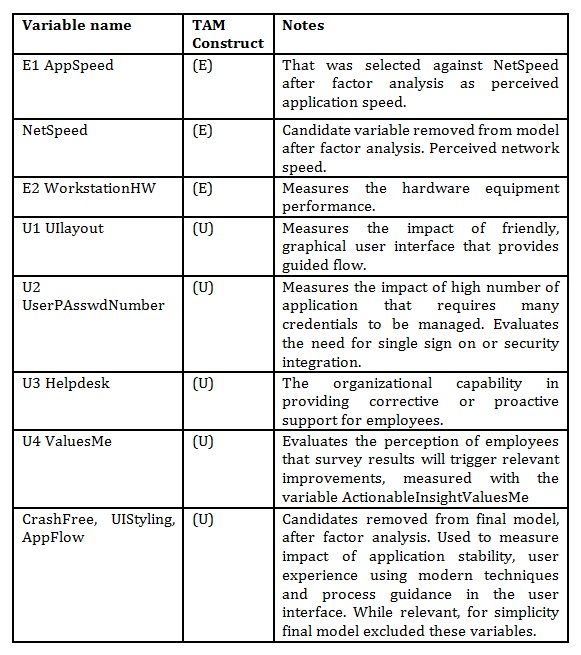
It is noted that positive rating is skewed towards positive evaluation for older employees. Variables measured and found relevant in the model are described in the following table:
Table 2: Final Model variables
Source: Reproduced with permission from Jipa (2017)
Analysis of opended questions from survey was ploted in a wordcloud format for comparison with qualitative research findings.
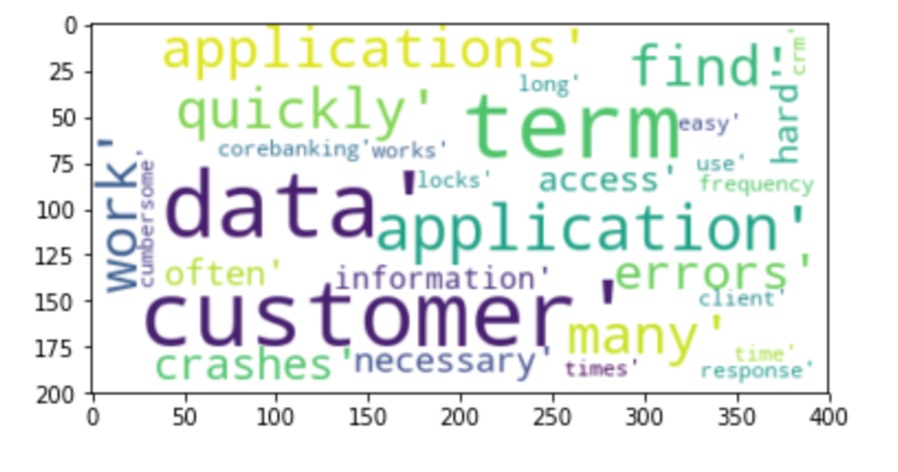
Fig.7: Wordcloud generated based on frequency in open ended survey responses.
Source: Author generated
We note that findigs are similar to the qualitative research conclusions, looking at TOP 12 pairs (term, frequency): (‘application’, 166), (‘crm’, 158), (‘corebankingapp’, 112), (‘slow’, 107 (‘transactionapp’, 96), (‘data’, 72), (‘client’, 70), (‘applications’, 67), (‘loanoriginationapp’, 58), (‘manual’, 57), (‘requires’, 54), (‘fast’, 52).
Initial analysis of interview and observation notes suggests that role or profile could influence the satisfaction scoring. Also it was noticed that many particular aspects identified in both quantitative and qualitative data analysis are relevant to groups of roles (for example cash transaction application apps are not relevant to relationship manager or „seller” roles).
Text data were processed and transformed in vectors using NLTK and Scikit-learn (Pedregosa et al., 2011) TFIDF model, and distribution of vectors across corpus was explored using K-mean algorithms. TFIDF is a well-established text processing method for classification for information retrieval, based on computed scores. TFIDF helps stand for the term frequency (TF, frequency of a word (i.e. number of times it appears) in a document) / inverse document frequency (IDF, measure of how significant the term is in the whole corpus). If the TFIDF score is high the term is rare. It computes the weights as a product of the TF*IDF weights. Each word or term has its respective TF and IDF score.
Based on TFIDF calculated scores, we can try to identify clusters, topics or patterns in the data. One applicable model, K-mean model tries to derive in unsupervised learning mode the cluster centers based on existing data, number of clusters being provided at modeling time. Out of 10452 words after conversion to vector format only 1299 words were retained in a vocabulary format. Frequency computation for each term was performed. For example, displaying vocabulary index [10 to 30] generates [‘risk’, ‘chooses’, ‘non’, ‘measurement’, ‘pj’, ‘heavily’, ‘retrieve’, ‘applications’, ‘many’, ‘openoffice’, ‘unified’, ‘panel’, ‘uploads’, ‘button’, ‘wunion’, ‘financial’, ‘noncash’, ‘status’, ‘automate’, ‘old’].
As a result of clustering with 3 clusters the following most important terms were extracted:
Top terms per cluster or category:
Cluster 0: [application crm corebankingapp slow data fast wealthmanagementapp loanoriginationapp applications client.] Based on interview notes, topics of concern seem to relate to a “seller” profile
Cluster 1: [transactionapp needs application manual corebankingapp crm does applications requires slow.] Based on interview notes, this cluster seems to reflect a “teller” transaction oriented profile as it requires operation in multiple applications including CRM and corebanking.
Cluster 2: [does requires manual client slow applications customer blocks needs multiple.] Topic reflects lack of integration and need of a fast, consolidated application.
Model parameters are as follows: V-measure: 1.000, meaning complete labeling of data. Silhouette Coefficient: 0.124, is different from 0 and suggests that clustering is done without overlapping and positive value towards 1 suggests the correct distribution of words/ cluster (Rousseeuw, 1987). However we note that value is far for 1, the best fit.
Exploring potential number of optimal clusters should be done using both judgment and model metrics. In that case even if silhouette coefficient is smaller for n_clusters=2, based on keywords most representative to clusters we selected n=3.
[For n_clusters=2, The Silhouette Coefficient is 105
For n_clusters=3, The Silhouette Coefficient is 124
For n_clusters=4, The Silhouette Coefficient is 0.138 ……
For n_clusters=10, The Silhouette Coefficient is 0.232….]
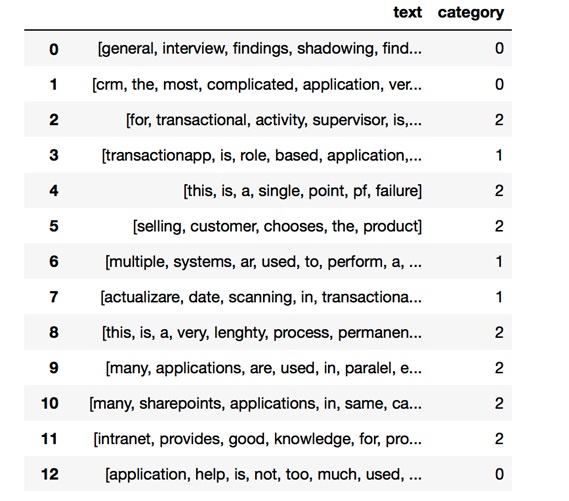
The model generated can be used for new text to predict cluster belongingness or to display corpus distribution.
Fig. 8: Sentence classification using trained TFIDF model.
Source: Author generated using python and skit-learn (Pedregosa et al., 2011)
Based on K-mean silhouette analysis, 3 categories were explored in a range of 3 to 6. Centroids of each cluster can be used for computation. The meaning of clustering should be traced back to literature, not only driven by mathematical metrics.
Each sentence is represented as a row in a matrix with TFIDF calculated words scores.
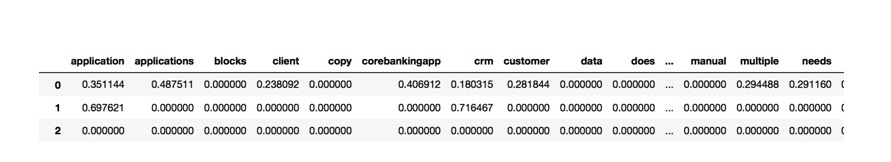
Fig. 9: Sample vector representing statement with words scores.
Source: Author generated
Further exploration of data of terms pairs or groups can be done using plots, based on cluster category, which can be helpful in exploring words distribution in corpus and analyze the term’s distribution across clusters.
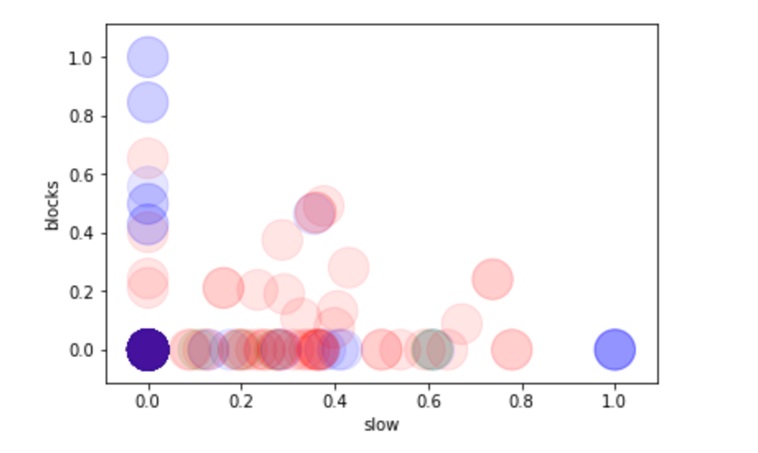
Fig. 10: Cluster distribution for words pair [slow;blocks] using TFIDF scores. Color code RGB is: red= Cluster 0; green=Cluster 1; Blue =Cluster 2.
Source: Author generated
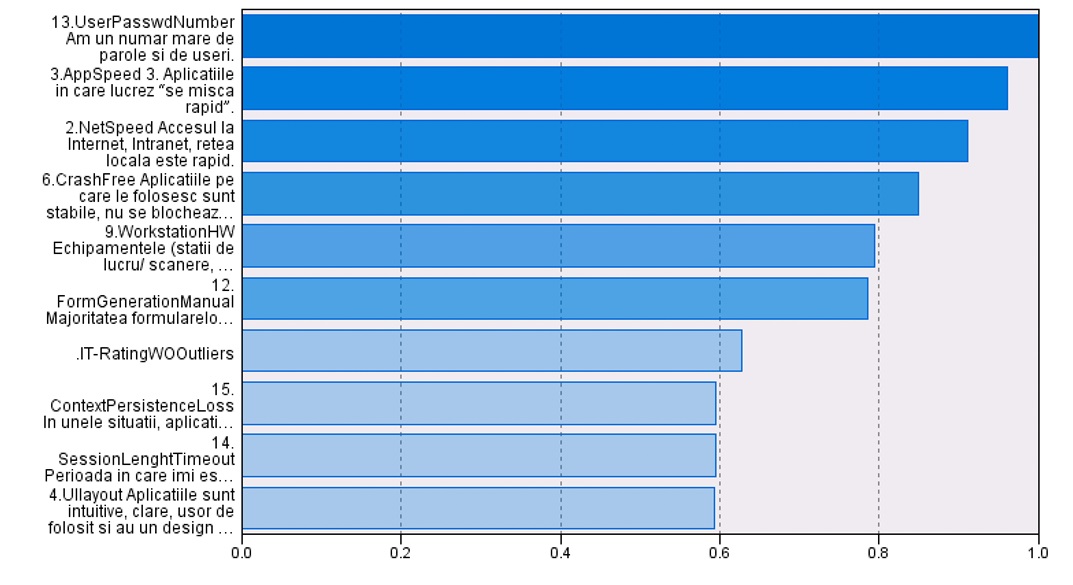
Exploratory analysis on quantitative data collected using survey instrument with K-means segmentation algorithm (unsupervised learning) was performed to identify patterns in data collected with survey instrument. K-mean provides also predictor importance list. Thus two clusters were generated, with an average silhouette of 0.3 in a range of [-1;1] using 29 input variables. Silhouette measurement provides a mathematical way to calculate how far each point is located form the cluster center for each point and useful to identify the optimum number of clusters. Value of 1 would indicate that points are exactly on the cluster center, while -1 that points are located on the center of the other cluster. Value of 0 indicates that points are equidistant to all cluster centers (IBM Knowledge Center – IBM SPSS Modeler V17.0.0 documentation, 2014). Cluster distribution was balanced, with 54.7% in Cluster 1 and 45.3% in Cluster 2. It is noted that again the findings from qualitative research are confirmed, factors as speed (variable 3), network performance and application stability (variable 15,6) are critical, but also need for application consolidation and integration (variable 13). Interestingly the overall rating is not the most important predictor.
Fig. 11: Predictors importance generated using Kmeans Algorithm for two clusters.
Source: Author generated in SPSS
Alternatively, the SPSS Classification and regression Tree (CRT) decision tree model was used with a limited set of factors, excluding some very specific to cash transactions derived factors, to reduce the missing data. CRT provides a way to split the data and keep the predictive purpose, in our case target variable being Bankrating (without outliers). The employee’s role was not selected as a control variable due to the fact that in more than 400 Branches the responsibilities are shared. The generated CRT model had 5 levels depth and a Gain of 75.8 at 60% (percentile) compared to 86.861 for the best line. The random model had a gain of ^) at 60%. It is also noted the strongest predictors in this case also are common with previous exploratory research.
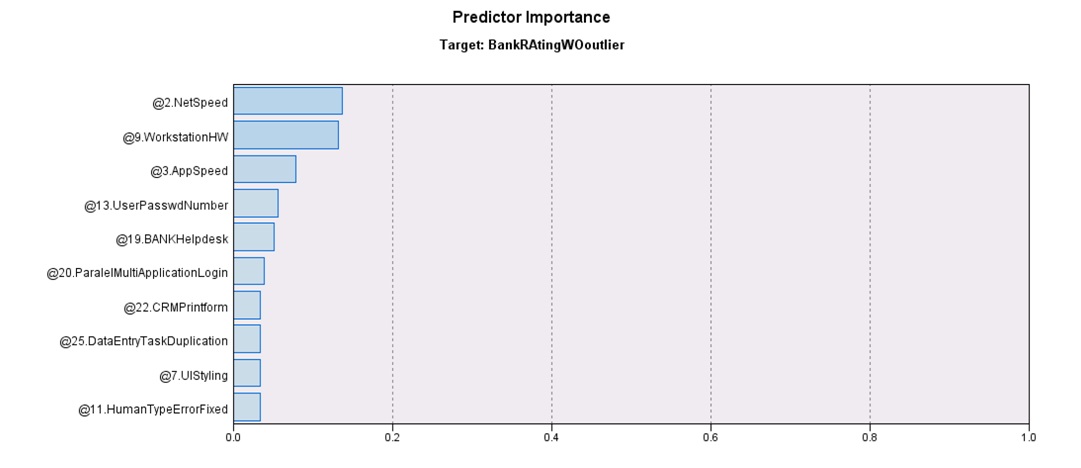
Fig 12: Predictor importance using predictive C-RT decision tree model in SPSS Modeler 17. .
Source: Author generated in SPSS
The CRT Decision Tree model explain the predictor’s importance for a sample size of 421 responses in dataset.
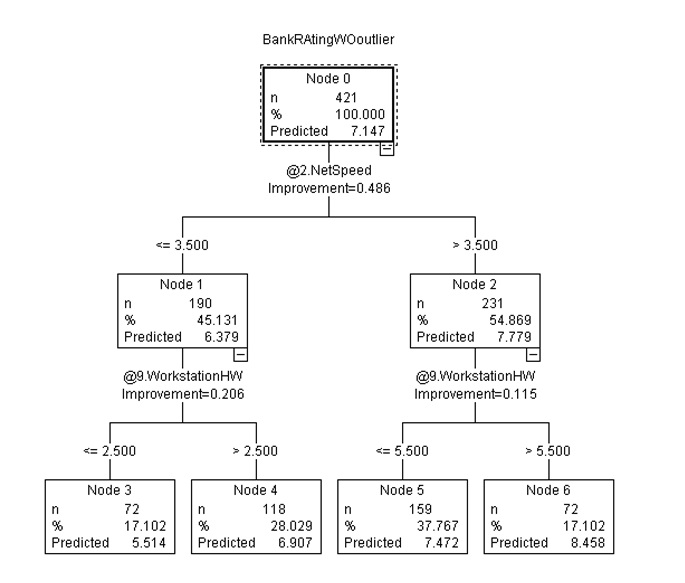
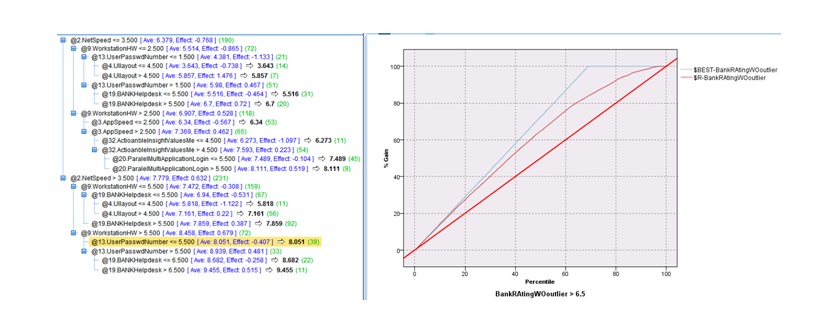
Fig. 13: SPSS Modeller CRT model distribution- predictive model, partial tree view.
Source: Author generated in SPSS
We noted that the findings of different models are converging in terms of factor importance. We also noted that due to high correlation between variables during factorial analysis, either dimensionality reduction or selecting the most relevant variable is necessary. The predicted values are included at each new branch ion order to understand the impact of independent variable on dependent variable. In that case that is the best dataset split using 21 input variables, gain curve shows acceptable performance of the model even if it reflects a gap between model and best fit curve but it is better than „no model baseline”.
Fig. 14: Model parameters and Gain curve for CRT Model.
Source: Author generated in SPSS
Results
The final model is based on multivariate linear regression, computed in SPSS Statistics. Alternative models were explored using either statistical approach or machine learning approach.
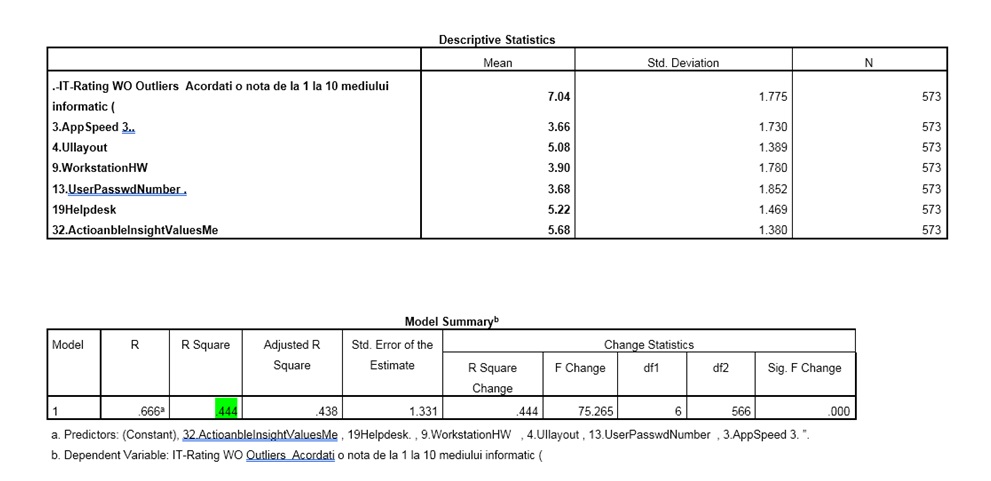
Data were analysed using descriptive statistics techniques: normality, including skewness and kurtosis, getting acceptable values between -2/2 range. The measurement of overall Employee Satisfaction was done with the variable “IT Rating (outliers filtered)” which has a mean of 7.04, being equivalent to a “Partial Satisfied” on a 7 points Likert scale measurement. Outliers were identified and replaced with median or case excluded. We recorded negative measurements (between 1-4 ranks) of average values for application speed evaluation overall (AppSpeed 3.66), hardware equipment, close to neutral point (WorkstationHW, mean 3.90) and complexity in security environment due to distributed, loosely coupled environment (UserPAsswdNumber, mean 3.68). There was also positive evaluation between [5-6] range, expressing measurements between partial satisfied and mostly satisfied of average, measured by application design and user experience (UIlayout 5.08), the internal helpdesk provided support (Helpdesk 5.22) and highest ranking from beliefs that the organisation is supporting change based on the voice of the employees (ActionableInsightValuesMe 5.68). The number of valid cases considered for ANOVA analysis was N=573. The results passed T Test being valid for the entire population
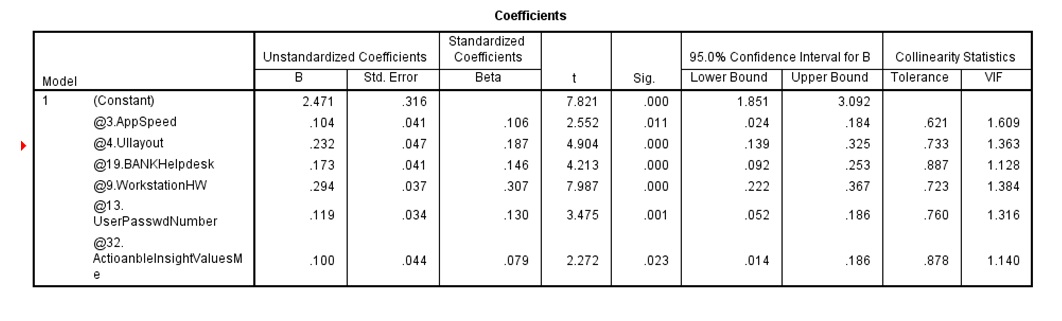
Figure 15: SPSS screen capture on selected model parameters.
Source: Reproduced with permission from Jipa (2017)
Special attention should be given to the Organisational support factor that contributes significantly to the explanation of the model.
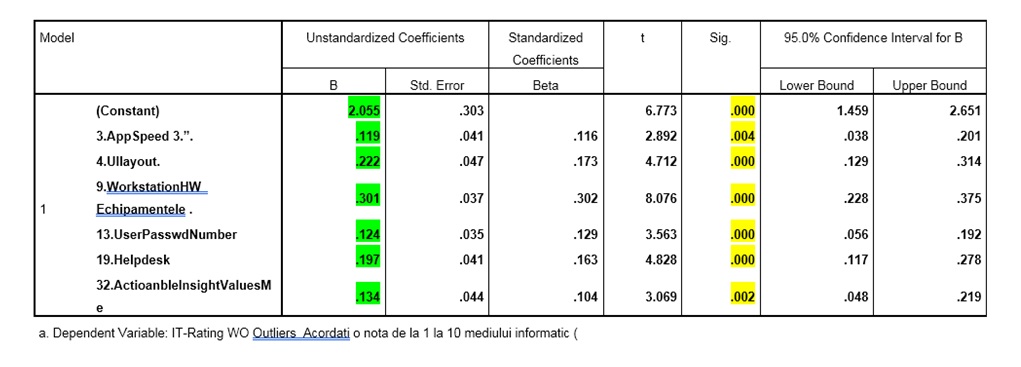
The proposed model was linear regression analysis using multivariate ANOVA. Due to its applicability in business decisions the overall findings of validated model can be summarised as equation (1).
The regression model can be used with a probability of 95% to describe the effects of the most significant 6 variables against Employee satisfaction “IT Rating WO outliers”. A constant of 2.055 could be attributed to other unmeasured factors, not included in the model. Analysing the Significance level p or Sig. in SPSS table compared to α = 0.05 shows acceptable values, at limit for Appspeed (.004). However a second mesurement of Network Speed recorded a high correlation, but due to colinearity issues we decided to exclude it from final model, sugesting a factor analysis approach. The measured employee satisfaction recorded average 7.04 out of 10 with acceptable model Strength, R Square= 44.4%, but we estimate that improving negative situation might change the model. Currently, the biggest impact in improving satisfaction is done by hardware changes; where close to neutral measurement was recorded, even if more and more processing is moved from local to network. Therefore, component analysis would help clarify the impact, as well as potential beliefs existing into organisation.
Figure 16: SPSS screen-Anova model parameters
Source: Reproduced with permission from Jipa (2017
The results are summarised in the following list:
Current ten points UX Rating 7.04 is equivalent to Partial Satisfied Level (5.02). High Level of trust is expressed that Client voice generates reasonable and applicable actions.
A relative large number of tested hypothesis with negative feedback (between Mostly dissatisfying toward Neutral point) are found, especially basic need for Human Computer Interactions- HCI (Network Speed, Application Speed, Workstation Infrastructure, Application Stability).
A relative large number of tested hypotheses 20 out of 28 have negative satisfaction ratings in interval [2.95-3.93]; Employees stated during interviews that their personal image is negatively impacted by the performance of the IT environment of the bank during Customer facing activities, statement confirmed by the survey.
The closest rating to Neutral points is the level of satisfaction while operating 2-3 Application in the same time (4.01). This suggests that consolidation of the current number of applications to this 2-3 would be acceptable. Currently, a very large number of applications are deployed with partial overlapping.
The client perceives the User Interface friendliness as positive, mainly due to split between Loan Origination APP A and CRM, both with strong UI capabilities (emulates Fat client, Strong contrast, unified colour styling, predictable flow and intuitive). Also expressed by Best Application in survey (Loan Origination APP A #1 42.8%, CRM#2 24.7%)
Most valued application qualities are: Speed, Information and Error Free.
The most requested changes captured in open format question are: Consolidate and Integrate applications/ Upgrade Network and Application Speed/ Refresh Workstation and Printer & Consumables Park.
All findings in interviews were validated as valid for population. That indicated that factors’ selection was correct and survey included areas of concern valid for employees. Univariate regression models were analysed for each of the variables, testing H0/H1.
Vey high number of User /Password credentials currently in place due to current IT environment creating dissatisfaction.
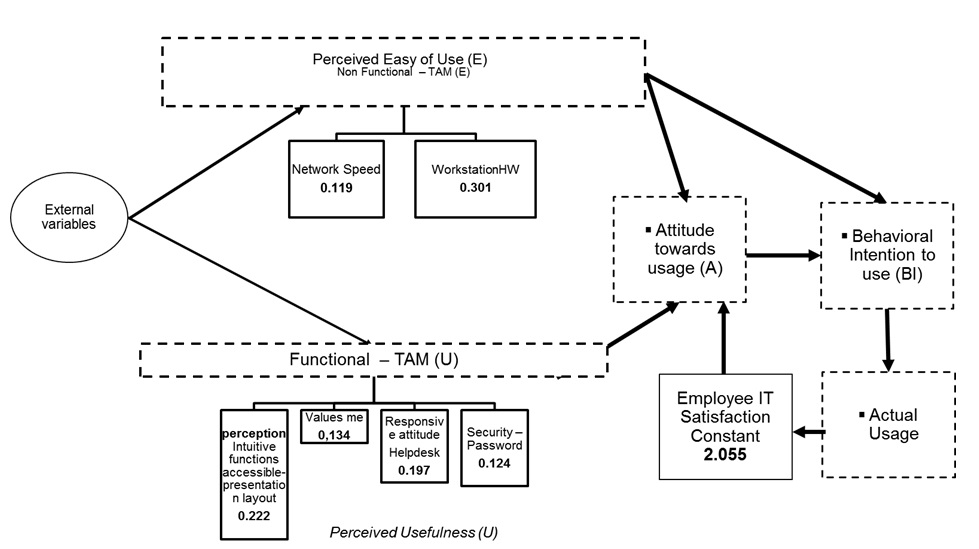
Important Non-Functional qualities of the systems are perceived as groups described by two common factor analyses.
Figure 17: Revised Model after regression model selection includes original TAM constructs.
Source: Reproduced with permission from Jipa (2017)
Machine learning model: alternative-modeling technique was used using a split of dataset in training/test. The same algorithm was used, values being different due to test/ train sampling used in machine learning approach. Managerial and practical implication of a machine learning model is that the analysis can be automated and performed multiple times using application flow in SPSS Modeler compared to SPSS Statistic approach. R square value is 40.9% and results are significant for a 95% confidence assumed.
Fig. 18: Linear Regression parameters using machine-learning model, coefficients are similar but not identic with statistical approach.
Source: Author generated
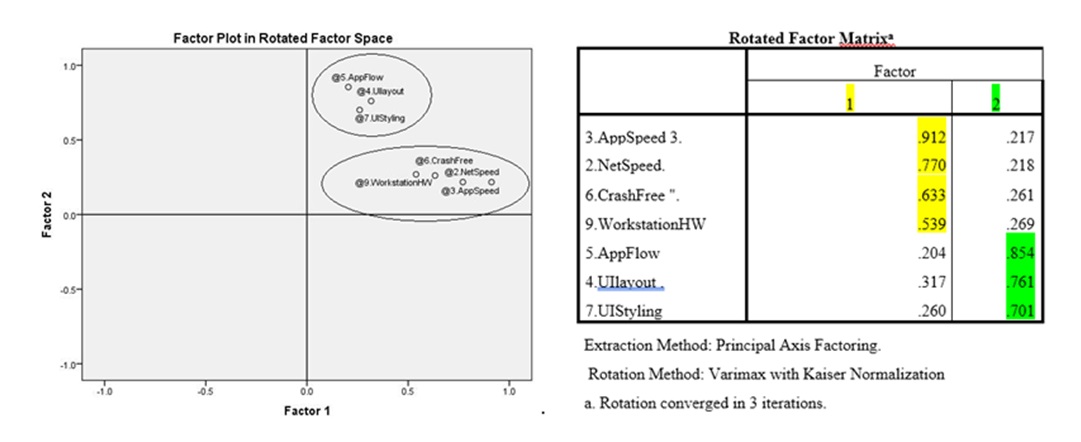
Factor Analysis: Considering co-linearity issues identified, exploratory factor analysis was performed, and two new variables were created: Index 1 (PCExperience) that cumulates variables that measures hardware performance with error or crash stability, application and network speed -WorkstationHW, CrashFree, AppSpeed and NetSpeed and explains how a platform is perceived from a performance perspective. CrashFree Index 2 (UserlayoutExpIndex) cumulates effects of user design and experience with application flow for guided operations, including 3 variables: UIlayout, UIStyling, and AppFlow.
Figure 19: SPSS Factor analyis identification.
Source: Reproduced with permission from Jipa (2017)
Index 1 (PCExperience) was computed on sample size of N=596, giving a mean of 3.793 and a Std Error of 0.061. Component matrix using principal component analysis as extraction method shows AppSpeed the highest contributor, with 0.909. Index 2 (UserExperience) recorded a mean of 5.203, with a standard error 0.047 and as factor extraction suggests the index was created out of user layout, styling and application flow. However, model strenght was not increased after runing a model to include this (Model Strength R Square 43.9% at a probability 95%). The research analysed also results from sample to population based on age, job role, years of experience in the bank and preffered qualities. Experience in the bank was not found significant in explaining the effects on employee satifaction and the model is valid only for sample, but we cannot generalize this statement due to H0 hypothesis acceptance during T Test. Age of respondent is significant only for population over 45 years. This is valid for population, but is at limit level of 95%, p value (Sig.) with a value of 0.048 close to 0.05 and R Square 0.024 that is very low. We might be cautious about this or lower probability to 90%, as a person older than 45years would have a tendency to over-rate by 0.411). Clients in Age segment 46+ tend to overrate in average by 0.4 points the IT Rate. This significance validated at limit was excluded from decision-making. We followed qualitative and quantitative research methodology and statistical analysis that included data validation, descriptive statistics, performing test validity of variables for generalization to entire population (29 hypothesis) and multiple Anova (40+ models).
Alternatively to statistical approach, using a machine learning approach with PCA factor extraction, we were able to extract unsupervised 5 factors, explaining with 59.381 % of total variance, using 29 factors as inputs. That confirmed also the statistical approach, showing that AppSpeed (0.624), NetSpeed (0.621) and WorkstationHW (0.626) share a common perception while CrashFree is in proximity (0.563).
Conclusions and Discussions
A final model was proposed with 6 explanatory variables and 44,4% model strength as well as alternate models or analysis of the data. Results were analyzed for applicability to support change management. Validated responses included 608 out of 3000 respondents, giving a response ratio of 20.2%. Unsupervised machine learning agorithms provide useful exploratory tools on both qualitative and quantitative research activities to extend theoretical approach to data and find potential model variants, applied to both structured data (coded based on Likert/ categorical variables) and text format data. Our findings empirically validated the model hypotheses (H1, H2, H3, H4). TAM specific relationship between Ease of Use and Usefullness (H3) should be further evaluated in a different approach, specific to latent variables measurement. The research provided validation of relevant factors influencing Bank’s employee IT satisfaction. Due to the complex business environment including tens of applications, managerial and practical implications of the findings are important. We found that the main concerns relate to stability and performance of access, but also that application consolidation is a key factor contributing to overall satisfaction. User experience (design layout, contextual help provided or intuitive navigation) is also important. Current User Experience/ Satisfaction is 7.04 (on a scale 1 to 10, with 10 being the best), expressing Partial Satisfaction and the most important application qualities relevant for population (from a given set) are speed, information and error free. The value of survey input shows a positive organization value that strongly influences experience rating (Values Me with a partial satisfaction 5.6) that indicates the level of expectations from employees. The survey instrument included also open ended questions to capture expectations or comments. Interviews’ findings and model hypotheses were validated during statistical testing as significant for the entire population. Actions to support change management were identified with granularity at system/ area level (by validating and assessing specific tested hypothesis). While dimension reduction does not improve the model strength, it was an indication that future analysis should be done by evaluating under TAM the effect of latent variables with specific modelling techniques that handle correlation and co-linearity as structural equation modelling. No significant difference exists between user roles in rating employee satisfaction probing that responsibilities and roles are not clearly separated. All evaluated factors were significant for the entire populations. We expect that the model will change in the dynamic IT environment. As further development, a different statistical approach might be used to bring confirmatory analysis of the TAM proposed model. Another finding identified with factor analysis exploration was that employees are not able to distinguish between potential issues on communication, application of specific performance issues or running hardware. That perception is also reflected for the graphical or user interface and application flow capabilities even if they address separate IT capabilities. Another valuable finding related to organisational response and support for employees, associated to existing beliefs, indicates that additional constructs as causal attribution (Kelley, 1973; Harvey and Martinko, 2009) should be evaluated along with TAM constructs.
Natural language processing can help or simplify both qualitative and quantitative research tasks. We extracted valuable information out of corpus, validated by empirical test results. Data analysis using statistical approach (based on hypothesis validation) or machine learning approach using supervised and unsupervised models shows similar but not identical results. We didn’t aim to reproduce exact parametric result across tools but rather to evaluate both approaches using SPSS Statistics and SPSS Modeller. Efficiency in modelling and the ability to move to an operational model is much higher, but also possible with SPSS Statistics. Exploration of data is faster in SPSS Modeller due to the ability to probe multiple algorithms. Managerial communication is facilitated by visual exploration using algorithms as decision tree. While TAM provides a more general-purpose tool, in specific cases as the current analysis, discrete variables adapted to the case provided valuable insights for change management. Currently employees tend to have a positive and trustful perception of the values that they provide to the bank and support that IT Organization gives. In the same time, their perception is influenced by Perceived Ease of Use, (that in our case includes the communication speed and hardware platform parameters, sometimes old equipment) which has a direct negative impact on the overall rating. The current state was modelled on a base of 6 factors out of 29. Analysis of future state can be facilitated by the use of a full model that benefits of machine learning automation. We also concluded that most important factors for clustering are not necessarily the same for predicting the impact of change in environment, as in case of application consolidation and lack of integrated user credentials across platforms.
Ajzen, I. and Fishbein, M., 1980a. Theory Of Reasoned Action / Theory Of Planned Behavior. Social Psychology, 2007, pp.67–98.
Ajzen, I. and Fishbein, M., 1980b. Theory Of Reasoned Action / Theory Of Planned Behavior. Social Psychology, 2007, pp.67–98.
Al-alawi, A.I., Al-azri, A.S. and Mohammad, H.N., 2016. Investigating the Factors Affecting Job Satisfaction and Turnover : Case of Sultan Qaboos University. 2016.
Anon 2014. IBM Knowledge Center – IBM SPSS Modeler V17.0.0 documentation. [online] Available at: [Accessed 8 Dec. 2018].
Aziri, B., 2011. JOB SATISFACTION: A LITERATURE REVIEW. Management Research and Practice, 3(4), pp.77–86.
Bird, S., Klein, E. and Loper, E., 2009. Natural Language Processing with Python. [online] Available at: .
Bird, S. and Loper, E., 2004. NLTK: The Natural Language Toolkit. In: The Companion Volume to the Proceedings of 42st Annual Meeting of the Association for Computational Linguistics. Barcelona, Spain: Association for Computational Linguistics, pp.214–217.
Davis, F.D., 1989. Perceived Usefulness, Perceived Ease of Use, and User Acceptance of Information Technology. MIS Quarterly, 13(3), pp.319–340.
Davis, F.D., 1993a. User Acceptance of Information Technology: System Characteristics, User Perceptions and Behavioral Impacts. International Journal of ManMachine Studies, 38(3), pp.475–487.
Davis, F.D., 1993b. User Acceptance of Information Technology: System Characteristics, User Perceptions and Behavioral Impacts. International Journal of ManMachine Studies, .
Davis, F.D., Bagozzi, R. and Warshaw, P., 1989a. User acceptance of computer technology: a comparison of two theoretical models. Management Science, 35, pp.181–192.
Davis, F.D., Bagozzi, R.P. and Warshaw, P.R., 2012. User Acceptance of Computer Technology : a Comparison of Two Theoretical Models *. Management Science, 35(8), pp.982–1003.
Dawes, J., 2002. Five point vs. eleven point scales: does it make a difference to data characteristics. Australasian Journal of Market Research, 10(1), pp.1–17.
Deci, E.L., 1972a. Intrinsic motivation, extrinsic reinforcement, and inequity. Journal of personality and social psychology, 22(1), p.113.
Deci, E.L., 1972b. Intrinsic motivation, extrinsic reinforcement, and inequity. Journal of personality and social psychology, 22(1), p.113.
Eisenberger, R., Cummings, J., Armeli, S. and Lynch, P., 1997a. Perceived organizational support, discretionary treatment, and job satisfaction. The Journal of applied psychology, 82(5), pp.812–820.
Eisenberger, R., Cummings, J., Armeli, S. and Lynch, P., 1997b. Perceived organizational support, discretionary treatment, and job satisfaction. The Journal of applied psychology, 82(5), pp.812–820.
Garland, R., 1991. The mid-point on a rating scale: Is it desirable? Marketing Bulletin, 2, pp.66–70.
Ha, S. and Stoel, L., 2009. Consumer e-shopping acceptance: Antecedents in a technology acceptance model. Journal of Business Research, 62(5), pp.565–571.
Harvey, P. and Martinko, M.J., 2009. Attribution theory and motivation. Organizational Behavior in Health Care, pp.147–164.
Hew, J.J., 2017. Hall of fame for mobile commerce and its applications: A bibliometric evaluation of a decade and a half (2000-2015). Telematics and Informatics, 34(1), pp.43–66.
Hew, J.-J., Lee, V.-H., Ooi, K.-B. and Wei, J., 2015. What catalyses mobile apps usage intention: an empirical analysis. Industrial Management & Data Systems, 115(7), pp.1269–1291.
Hwang, Y., Al-Arabiat, M. and Shin, D.-H., 2015. Understanding technology acceptance in a mandatory environment: A literature review. Information Development, 31(3), pp.1–18.
Jipa, G., 2017. Employee Satisfaction – IT User Experience Evaluation in Banking: A Case Study, in: Soliman, K. (Ed.), SUSTAINABLE ECONOMIC GROWTH, EDUCATION EXCELLENCE, AND INNOVATION MANAGEMENT THROUGH VISION 2020, VOLS I-VII. pp. 2724–2735.
Kelley, H.H., 1973. The process of causal attribution. American Psychologist, 28(2), pp.107–128.
Lee, Y., Kozar, K. and Larsen, K., 2003. The technology acceptance model: past, present, and future. Communications of the Association for Information System, 12(50), pp.752–780.
Lee, Y., Lee, J. and Hwang, Y., 2015. Relating motivation to information and communication technology acceptance: Self-determination theory perspective. Computers in Human Behavior, 51(PA), pp.418–428.
Locke, E.A., 1976. The nature and causes of job satisfaction. In: Handbook of Industrial and Organizational Psychology. pp.1297–1349.
Marangunić, N. and Granić, A., 2015. Technology acceptance model: a literature review from 1986 to 2013. Universal Access in the Information Society, 14(1), pp.81–95.
Patten, M.L., 2007. Qualitative versus Quantitative Research. Understanding research methods: an overview of the essentials, pp.21–23.
Pedregosa, F., Varoquaux, G., Gramfort, A., Michel, V., Thirion, B., Grisel, O., Blondel, M., Prettenhofer, P., Weiss, R., Dubourg, V., Vanderplas, J., Passos, A. and Cournapeau, D., 2011. Scikit-learn: Machine Learning in Python. MACHINE LEARNING IN PYTHON, p.6.
Rousseeuw, P.J., 1987. Silhouettes: A graphical aid to the interpretation and validation of cluster analysis. Journal of Computational and Applied Mathematics, 20, pp.53–65.
Saunders, M., Lewis, P. and Thornhill, A., 2008. Research Methods for Business Students.
Sekhar, C., Patwardhan, M. and Singh, R.K., 2013. A literature review on motivation. Global Business Perspectives, 1(4), pp.471–487.
Shumaila, Y., Foxall, G.R. and Pallister, J.G., 2010. Explaining internet banking behavior: Theory of reasoned action, theory of planned behavior, or technology acceptance model? Journal of Applied Social Psychology, 40(5), pp.1172–1202.
Singh, S., Srivastava, V. and Srivastava, R.K., 2010. Customer Acceptance of Mobile Banking: A Conceptual Framework. SIES Journal of Management, 7(1), pp.55–64.
Teodorescu, N., 2009. Metode avansate de marketing: suport de curs. Bucureşti: Editura A.S.E.
Venkatesh, V., 2003. User Acceptance of Information Technology: Toward a Unified View. MIS Qarterly, 27(3), pp.425–478.
Venkatesh, V. and Bala, H., 2008. Technology acceptance model 3 and a research agenda on interventions. Decision Sciences, 39(2), pp.273–315.
Venkatesh, V. and Davis, 2000. A Theoretical Extension of the Technology Acceptance Model: Four Longitudinal Field Studies. Management Science, 46(2), pp.186–204.
Wixom, B.H. and Todd, P.A., 2005. A theoretical integration of user satisfaction and technology acceptance. Information Systems Research, 16(1), pp.85–102.