Wroclaw University of Economics and Business, Wrocław, Poland
Volume 2020,
Article ID 784622,
Journal of Innovation and Business Best Practice,
30 pages,
DOI: 10.5171/2020.784622
Received date: 24 February 2020; Accepted date: 16 July 2020; Published date: 28 August 2020
Academic Editor: Joanna Krasodomska
Cite this Article as:
Joanna Dyczkowska (2020)," R&D Narratives in Annual Reports of European Biopharmaceutical Companies", Journal of Innovation & Business Best Practice, Vol. 2020 (2020), Article ID 784622, DOI: 10.5171/2020.784622
This study has two objectives. Firstly, it explores how do R&D narratives differ in various clusters of biopharmaceutical companies in terms of discussion context and text readability. Secondly, it examines whether the way how biopharmaceutical companies depict their business within R&D context is dependent on R&D expenses or R&D intensity levels. The paper contributes to the literature in applying qualitative and quantitative methods. They are used to examine relations between particular words, establish the contextual meaning of the paragraphs and evaluate readability of the texts extracted from annual reports. An in-depth text analysis covers both creation of co-occurrence network exemplifying the relations between words and assessment of selected readability measures. In order to understand differences in-between the analysed entities in terms of R&D discussion a cluster analysis is applied. The conducted analysis allowed to recognize three different R&D disclosure approaches. The companies from first cluster focused on disclosing R&D accounting policy. The companies from the second and third clusters debated intensively on strategic issues whereas R&D discussion in the fourth and fifth clusters oscillated around operational aspects. The evaluation of readability measures evidenced that R&D narratives were difficult or very difficult to understand. The results of the study proved also that the companies which disclosed more strategically about their R&D activities had higher R&D expenses levels and growths than the companies which reported on R&D operational aspects. Moreover, the companies which debated intensively on R&D accounting policy differed with statistical relevance from the group reporting on R&D operational aspects in terms of R&D expenses growth.
Keywords: R&D expenses, R&D intensity, R&D narrative, text readability
Introduction
The business activities of science-based companies are affected by many impacts and fraught with perceptible risks (Białek-Jaworska and Gabryelczyk 2016). These impacts include still changing technologies, definite need for highly skilled employees as well as intensive efforts directed at effective managing R&D expenses, launching new products and attaining marketing approvals issued by regulatory authorities. High-tech companies experience sector-specific conditions and face several problems related with patent protection. As a result of global orientation of business activities, the majority of high-tech companies is exposed to currency, credit and country-specific risks, as well. Moreover, R&D budget holders more and more often face a problem of delivering better performance with limited budgets, whereas new product launches have to provide a significant improvement over the existing treatment options to be taken into account for reimbursement (Deloitte 2015).
A multitude of sector-specific conditions, complexity of business activities revealed in various business models adopted by pharmaceutical companies as well as long R&D project life cycles cause that a decision on what should be disclosed becomes challenging even for experienced managers. It should be noted that mission statements of European biopharmaceutical companies usually include a notably clear message of improving human life by developing innovative medicines or therapies for diseases at the front-line. At the same time patients are more conscious of available therapies and are demanding choice. However, only a few companies mention what they actually propose to shareholders1. In order to fulfil that gap each company should search for a balance in creating the value for patients, society and shareholders, what may be achieved by acting in a collaborative and sustainable way.
Investors, who attentively observe activities of high-tech companies in terms of financial and non-financial performance, expect that periodic reports will reflect the actual situation of an entity. In turn, companies are on the horns of dilemmas regarding the framework of voluntary disclosures in the context of proprietary costs and possible benefits (Dye 1985; Verrecchia 1983). Cheng (2004) claims that R&D activities seem to be a source of agency problems between insiders and outsiders. Aboody and Lev (2000) support that statement and argue that R&D activities are significant drivers of the information asymmetry which cause that investors can react more sturdily to the disclosure of insider trades in R&D companies than in non-R&D companies. Therefore, many researchers perceive voluntary narrative disclosure as a mechanism which aims at a reduction of the information asymmetry and agency conflicts (Jensen and Meckling, 1976; Patelli and Prencipe, 2007; Nekhili et al., 2015). Disclosures made by high-tech innovative companies refer to broader aspects, including substantial risks from openness to external organizations. In order to win the support of external parties or to obtain an access to external knowledge sources, companies may be impelled to share knowledge with other institutions. Laursen and Salter (2014) argue that “when negotiating contracts in the market for ideas, disclosure can increase the bargaining power of the buyer and reduce the power of the innovator, especially in the absence of credible threats and IP rights protection.”. That situation is labelled as “the paradox of disclosure” (Arrow, 1962).
This study has two objectives. Firstly, it explores how do R&D narratives differ in various clusters of biopharmaceutical companies in terms of discussion context and text readability. Secondly, it examines whether the way how biopharmaceutical companies depict their business within R&D context is dependent on R&D expenses or R&D intensity levels. The paper contributes to the literature in applying qualitative and quantitative methods. They are used to examine relations between particular words, establish the contextual meaning of the paragraphs and evaluate readability of the texts extracted from annual reports. An in-depth text analysis covers both creation of co-occurrence network exemplifying the relations between words and assessment of selected readability measures. In order to understand differences in-between the analysed entities in terms of R&D discussion, a cluster analysis is applied.
Motivation and empirical background
Biopharmaceutical companies spend a lot of time and huge sums on its basic research and clinical studies or trials, expecting effects of those efforts contributing to a major breakthrough in a treatment of incurable diseases. Therefore, a topic of communicating R&D activities is interesting both from the viewpoint of companies, society and investors. The latter group may expect outstanding performance being a result of extending products’ portfolio. That is why a matter of R&D disclosures is thought-provoking in the context of their drivers and associated proprietary costs. An issue of proprietary costs results from “disclosing information which may be used by competitors and other parties in a way which is harmful for the reporting company” whereas a lack of these costs may stimulate companies „to voluntarily disclose relevant information to the market in order to reduce information asymmetry and, consequently the cost of capital” (Prencipe, 2004). There is always a trade-off between disclosing more or disclosing less, since more disclosures decrease the cost of capital but also reduce the manager’s profits from inside trading (Baiman and Verrecchia, 1996). These trade-offs may be considered as partial-disclosure equilibria, which are contingent on the information to be disclosed, the level of regulatory related costs, and the probability that a competitor will enter the product market (Wagenhofer, 1990; Cohen 2002). However, Fishman and Hagerty (2003) argued that some investors may not have the technical expertise to comprehend properly the R&D information disclosed in annual reports. The other reason is just a lack of time to develop extensive analysis. These two arguments suggest that disclosure of R&D information which could have potential implications for future earnings may not be significant to unaware investors.
There are several studies which refers to the nature of disclosures within R&D activities, the approaches of executives or analysts to R&D disclosures, the factors shaping R&D disclosures and the impacts of R&D disclosures on cost of equity, information asymmetry, analysts’ forecasts. In 1999, Entwistle interviewed analysts and executives in order to obtain an insight into disclosures of R&D intensive companies. The interview delved into the types of information the companies disclosed to communicate how they created value through R&D expenditures. The questions concerned the following categories: “Inputs” (How does a company invest its R&D expenditures?); “Outputs (What are the actual and potential outcomes from the R&D expenditures?); “Future expenditures” (What are the future plans concerning R&D expenditures?); “Financing” (How does a company finance its R&D?); “Accounting/Financial” (Does information have accounting or financial-analysis orientation?); “Strategy” (Does R&D information have a highly “strategic” tone?). The executives were also asked about their anxiety for disclosing proprietary or bad news of R&D information, the methods of monitoring the effectiveness of R&D disclosures and overall R&D disclosure philosophy labelled as “conservative”, “aggressive” or “mid-range”. Moreover, Entwistle (1999) inquired the executives and analysts to identify the potential benefits from effective R&D disclosure management and to express their opinion on deferring vs. expensing development expenditures. The last part of that examination, based on a content analysis of annual reports of 113 Canadian stock-listed companies, evidenced that the ratio of R&D expenditures to total operating expenses and a listing status explained the amount of R&D disclosures provided by the high-tech companies.
Ding et al. (2004) examined disclosure practices in French and Canadian high-tech companies based on 186 annual reports. They found a significant positive correlation between R&D disclosures and R&D intensity of Canadian entities. Moreover, Ding et al. (2004) remarked that Canadian companies were more eager to disclose non-financial information and prospects concerning the level of R&D expenses than their French counterparts which provided more financial and accounting information in a traditional way.
Another interesting study was carried out by Jones (2007) who examined 119 R&D intensive companies. Jones (2007) searched for voluntary disclosures of R&D companies in the annual reports and the sources beyond financial reporting such as direct disclosures to financial analysts mainly in the form of conference calls. The study focused on three types of R&D information, including R&D spending, R&D projects in progress and development-stage R&D. Jones (2007) developed three research questions concerning the types of information disclosed by managers of R&D intensive companies, the conditions under which managers made voluntary disclosures, the relations between the level of voluntary disclosures on R&D activities and analysts’ forecasts. The research results indicated that companies disclosed more R&D information when their financial statements were less informative about a market value. Then, no evidence suggested that companies with a higher level of information asymmetry disclosed more. Finally, the relation between R&D expenditures and R&D disclosures was positive but not significant, whereas the relation between analysts’ forecast accuracy at the beginning of the year and the level of R&D disclosures during the year was negative.
La Rosa and Liberatore (2014) investigated whether biotechnological companies in countries with a mandatory system of R&D disclosures provided more information than these from countries where R&D disclosures were voluntary. They examined also whether higher quantitative disclosure levels were related with lower cost of equity and how they referred to the various regulatory systems. The research results showed that in highly regulated countries companies were steadier in disclosing R&D information. Moreover, those companies benefited more in terms of cost of an equity capital.
Another important investigation concerns in general the extent of R&D narratives in annual reports and its relation to earnings performance. Merkley (2014) carried out a content analysis examining whether what companies actually disclosed within R&D area varied in reference to earnings performance. Moreover, Merkley (2014) examined whether the extent of R&D disclosures was associated with measures of analyst forecast behaviour, information content and information asymmetry. The results of that study evidenced that earnings performance was negatively associated with the quantity of R&D disclosures. The reason why companies disclosed more in case of lower earnings performance was not that managers used disclosures to put a positive spin on performance information, but it was just a respond to investors’ information needs. The study showed also that the extent of R&D disclosures was negatively related to analyst forecast dispersion and positively related to analyst following and earnings forecast accuracy. Consistently with the previous research (Jensen and Meckling, 1976; Patelli and Prencipe, 2007), the study of Merkley (2014) supported the statement that voluntary narrative disclosures aim at reduction of information asymmetry since the relation between the extent of R&D disclosures and information asymmetry proved to be negative.
Most of the abovementioned findings relate to different conditions and various, though narrow, research samples including high-tech firms or in particular biotechnological companies. Therefore, the results should not be generalized, nevertheless, they may constitute a point of reference for the further research studies.
Research Questions
The growing interest of non-financial narratives’ role in communicating topical issues to stakeholders and the empirical evidence on determinants and effects of R&D disclosures have become a motivation to take a closer look at annual reports of biopharmaceutical companies. Consequently, two research questions were developed in this study:
RQ1: How do R&D narratives differ in various clusters of biopharmaceutical companies in terms of discussion context and text readability?
Biopharmaceutical companies carry out their business activities in a specific area which is highly regulated by institutional bodies such as EMA or FDA, national and foreign health agencies. New products in this sector are subject to extensive pre- and post-market regulations which refer to testing, manufacturing, safety, efficacy, labelling, storage, record keeping, advertising and promotion of the products. Moreover, biopharmaceutical companies are expected to follow Good Manufacturing Practices (GMP) and Good Clinical Practices (GCP). All these impacts cause that biopharmaceutical companies face various risks. The complexity of developmental projects and the related long-term period of realisation imply that it is not possible to be certain that R&D investments will always produce the expected results. The reasons are that the research conducted may fail, the necessary authorisations to market products may not be obtained or the pricing and reimbursement conditions may not be satisfactory. Furthermore, biopharmaceutical companies apply different business models and are in various phases of business cycle. The list of impacts is not limited whilst their multitude may influence diversely a context of non-financial narrative. Another point is related with the readability level of R&D narratives included in annual reports. As one may expect, annual reports of biopharmaceutical companies do not belong to the easiest text to read. Despite that conjecture, it is worth to look inside the readability levels of R&D narratives.
RQ2: Is the context of R&D narratives contingent on R&D expenses and R&D intensity levels?
The empirical research studies linking disclosure of R&D narratives with R&D expenses and intensity levels have concerned mainly the extent of disclosures. Lev and Zarowin (1999) prove that companies with greater increase in R&D expenses have less informative earnings which is caused by a mismatch between revenues and expenses under the rules on R&D accounting policy concerning R&D expensing. Consequently, Napoli (2013) assumes that firms make more R&D disclosure when their earnings are less informative. That assumption is consistent with the earlier evidence provided by Entwistle (1999). Likewise, Gu and Li (2003) prove that companies make greater disclosures of innovation whilst increasing the rate of R&D expenses. Moreover they evidence that disclosures of innovation are positively associated with the firm’s R&D intensity. Positive association between R&D intensity and R&D disclosures was indicated in many studies, including: Entwistle, (1999); Ding et al. (2004); Nekhili et al. (2012) and Merkley (2014). However, R&D expenses and R&D intensity levels have not been combined with R&D disclosure context so far. In order to fill the research gap, this study examines whether the context of R&D narratives is dependent on R&D expenses and intensity levels.
Research Sample
Since investigation in this study is motivated by the predetermined research questions, relevant texts for the purpose to answer them were sampled. The study is based on annual reports of European biopharmaceutical companies classified in terms of R&D expenses level in the 2500 world top companies, 2014 R&D ranking. The population of biopharmaceutical companies included in the 2014 EU Industrial R&D Investment Scoreboard ranking covered 105 entities coming from EU countries represented mostly by UK (30), France (17) and Germany (11), whereas the population of biopharmaceutical companies included in the 2500 world top companies 2014 R&D ranking was composed of 77 European entities, dominated by companies from UK (14) and Switzerland (10). The final research sample included 65 entities which constitute 84,4% of the population (See table 1). The other 12 companies (15,6%) were excluded due to a lack of access to their annual reports of 2014.
Table 1: Composition of the research sample (n=65)
Source: Own presentation.
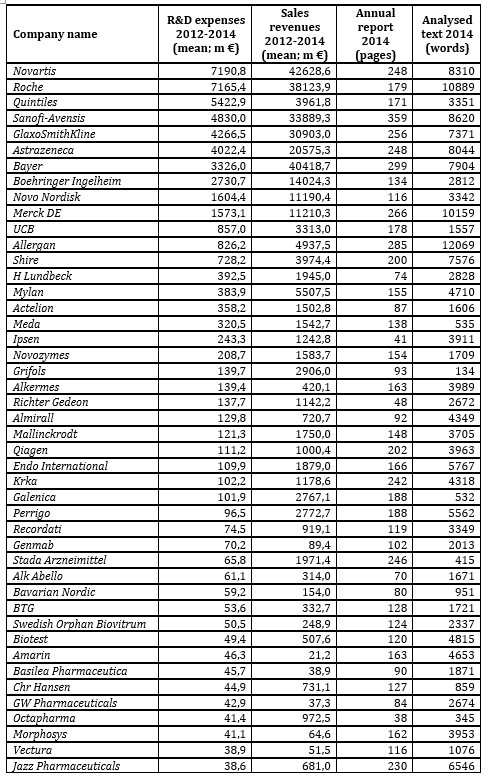
Table 1 demonstrates the analysed entities in terms of the main characteristics, including: R&D expenses, sales revenues, annual report’s length and R&D narrative’s length. Although, the companies from the West European region (including Belgian, Dutch, French, German and Swiss companies) spent on average the highest amounts on R&D activities, their R&D narratives were not the longest ones comparing to other regions. The entities from the European Anglosphere (including Irish and British companies) produced both the longest annual reports and the parts concerning R&D narrative (Allergan and GlaxoSmithKline prevailed in that region). It is worth remarking that the South and Central European region which covered only 7 companies (from Hungary, Italy, Slovenia and Spain) and had on average the lowest R&D expenses and sales revenues was ranked at the third place in terms of the mean length of annual reports and R&D narratives (KRKA prevailed here in terms of the length of an annual report – 242 pages – and a relatively long R&D narrative – 4318 words – with not so high R&D expenses of 97,24 €million). In turn, the Scandinavian companies (from Denmark and Sweden) had the shortest annual reports and R&D narratives.
Research Methodology
This study has an exploratory character. Following a distinction provided by Jones and Shoemaker (1994) as well as by Beattie et al. (2014), a thematic analysis (related with exploring narrative content) and syntactic analysis (related with examining the difficulty of reading a text) were applied.
The study benefits from a text mining method of exploration. As Atkinson (2009) said “Like gold, information is both an object of desire and a medium of exchange. Also like gold, it is rarely found just lying about. It must be mined (…)”. Text mining serves to discover previously unexplored relations by automatic extraction of information from different written sources. Hearst (2003) remarks that the aim of text mining is to relate the extracted information together to form new facts or new hypotheses to be further investigated by more conventional means of experimentation, whereas Krippendorf (2012) asserts that “research questions are the targets of the analyst’s inferences from available texts”. Moreover, a cluster analysis method which is applied in this examination is mostly used when there are no a priori hypotheses, but researcher’s interest circulates within the exploratory phase with a clear objective to explore a structure of data or texts. Therefore, this study does not develop any hypotheses but formulates two research questions. The first one (RQ1) is answered through inferences drawn from texts (qualitative and quantitative approach), whereas the second one (RQ2) by using a statistical methodology.
A textual analysis of annual reports is justified in a way that a source of texts is not contaminated, since an examination relies on historical information which cannot be manipulated by the author of a text as a result of emotional behaviour or intended self-defence in the face of criticism. The problem is, however, that either results of a textual analysis may become known to the texts’ authors in a long-term period or the categories that analysts applied (Krippendorf, 2012), therefore, a creative and unconventional approach to formulate new categories and to look at textuality in new ways might increase the value of analyses.
The procedure applied in this study was divided into three stages. First of all, annual reports of all companies included in the final research sample were carefully examined in order to search for separate sections or paragraphs discussing R&D activities. It was clear to identify separate sections, since they were often placed on a content page. However, there were cases where information on R&D activities was not easily noticeable in annual reports. Guthrie et al. (2004) point out that in content analysis paragraphs’ exploration seems to be more appropriate in drawing inferences from narrative statements than exploration of separate sentences or words since it enables to establish the appropriate sense of text. Therefore, when a lack of clear separate R&D sections was identified, the overall text was decomposed into meaningful paragraphs, including the terms: „research and development”, „R&D” or „research & development” which were essential to recognize and understand the meaning of R&D activities and their contextual linkages.
The extracts from annual reports created both an aggregated document covering narratives concerning all companies and single documents referring to each company separately. Such documents were ready to be mined. It was interesting to investigate relations between the most common words for the purpose of this study. Consequently, the aggregated text was inserted into text mining tool. The applied procedure was to examine concomitance of words within the same paragraph. In order to examine the relations between particular words, Jaccard’s coefficient of similarity was computed. The said measure is a ratio of the number of elements in the intersection set divided by the size of the union set (J(A, B) = (| A ∩ B |) / (| A | + | B | – | A ∩ B |). In this case, Jaccard’s coefficientof similarity showed how frequently did two particular words occur in the same paragraph in relation to total occurrence of those words in the examined narrative.
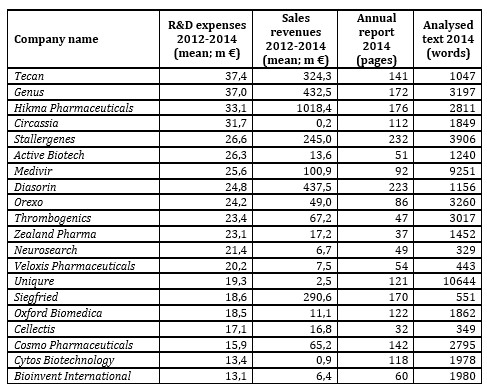
Figure 1 presents one of various options of co-occurrence networks that were analysed during the research process. The network exemplifies 200 relations between 100 most common words and sheds the lights on the most important linkages which show explicitly five thematic modules. The sizes of the circles exemplify numbers of particular words which appeared in the analysed text, hence the bigger circles show more frequent words. It should be explained that although the content analysis is based on 100 most common words the said co-occurrence network does not illustrate all of them, since 24 words did not create strong linkages with the other 76 words. In order to show more words, Jaccard’s coefficient should be decreased leading to reveal more linkages visible on the network.
Based on contextual relations exemplified in figure 1, five main modules discussed in the R&D narrative parts of annual reports were singled out. The first module (a yellow graph) concerns a topic of ‘CLINICAL STUDIES’ and is composed of the following phrases: clinical programs, clinical trial phases, clinical trial data, study result, patient therapies, cancer treatment, disease area, disease medicine. There are 12 nouns included in the module – ‘CLINICAL STUDIES’ – which precisely indicate a discussion framework. However, the other part of speech – a verb “complete” – in combination with noun “study” introduces dynamism into R&D narrative. It turns out that the importance of study completion and disclosure of related final results are accentuated by many annual reports of biopharmaceutical companies. The other example is an adverb “currently” used in the context of “cancer treatment”. This implies priority in business activity both in terms of timing and discussion intensity (occurrence frequency of a word in overall R&D narrative).
Fig 1. Contextual analysis: 200 relations between 100 most common words (n=65)
Source: (Dyczkowska 2020, p. 7631)
The second module (a purple graph) refers to ‘PROJECT DEVELOPMENT’ and covers the following phrases: research activity, pharmaceutical company development, development cost and development in time dimension, as for example 2-year development. Likewise, here nouns are the most frequent words which combine with verbs, adjectives and adverbs. Therefore, it may be remarked that biopharmaceutical companies ‘incur expenses” which cause ‘development costs”. While analysing a train of thought ‘increase – primarily – relate – expenses’, it may be deducted that growth in expenses accounts for a central problem broadly debated in R&D narratives.
The third module (a red graph) discusses on ‘NEW PRODUCTS” and reflects the following phrases: new product market, technology use, new drug candidate, sale marketing, business growth and investment increase. This module shows how many issues have arisen around new product development. They entail not only product-related aspects but also technology applied, R&D investments as well as a final phase associated with sale marketing.
The next module (a blue graph) focuses on ‘EXTERNAL ENVIRONMENT’ and draw an attention to the following phrases: collaboration agreement, milestone payment, regulatory approval. These issues are pivotal for continuity of business activities in biopharma industry. Companies enter into collaboration agreements for different reasons. They may search for early-stage collaborations with leading academic centres to foster the development of new targets, technologies and platforms. The cooperation may refer also to further stages of business life cycle when companies are looking for partners to develop innovative ways of assessing the treatment efficacy or commercialising and marketing new medicines. In each case, the robust collaboration aims at gaining scientific excellence and enabling growth opportunities.
The last module (a turquoise graph) refers to R&D accounting policy. The debate oscillate around the topics related with value, acquisition and impairment of intangible assets, acquisition of patent rights, future cash, recognition of revenues and income tax.
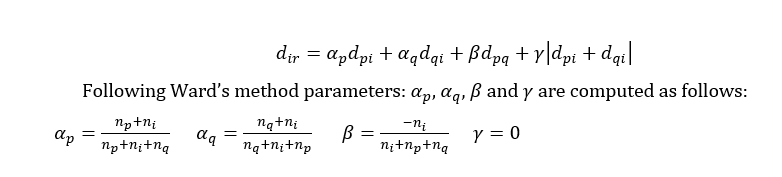
The second stage of the study aims at examining how the analysed entities merged into clusters in terms of similarity of how they tell the story about R&D activities. Therefore, vectors consisting of the number of Top 100 most common words were created for each company. Agglomerative hierarchical clustering approach was applied and Euclidean distances between particular objects were calculated. In order to determine how particular objects merge, Ward’s method was applied. Ward’s method does not use cluster distances to link objects (Ferreira and Hitchcock, 2009). Instead, it takes into consideration a classical sum of squares criterion and generates groups that minimize within-group dispersion. In other words, this method joins at each stage of an agglomerative procedure those cluster pairs whose fusion minimizes an increase in a total within-group error sum of squares (Rasmussen, 1992). The results of the cluster analysis are presented at the dendrogram (See: Figure 2).
The last stage of the study covered readability analysis which is based on two readability measures, including: Flesch Reading Ease Score and Automated Readability Index. The first measure is an old and the most accurate readability test developed by R. Flesch in 1948. It takes into account average sentence length (syntactic variable) and average number of syllables per word (semantic variable)2. It demonstrates on a scale of 0-100 the difficulty in understating a text. In order to categorize a level of text readability based on Flesch Reading Ease Score seven ranges are recognized, as follows: [0-29] – very confusing text; [30-49] – difficult text; [50-59] – fairly difficult text; [60-69] – standard text; [70-79] – fairly easy text; [80-89] – easy text; [90-100] – very easy text. The second measure was developed in the 60’s. It reflects the age required to comprehend the text and is based on formula which applies word difficulty ratio (number of letters per word) and sentence difficulty ratio (number of words per sentence)3. The Automated Readability Index takes the scores from the range between 5 and 22 which correspond to U.S. grade levels4.
Empirical evidence of the study
Results of Cluster Analysis
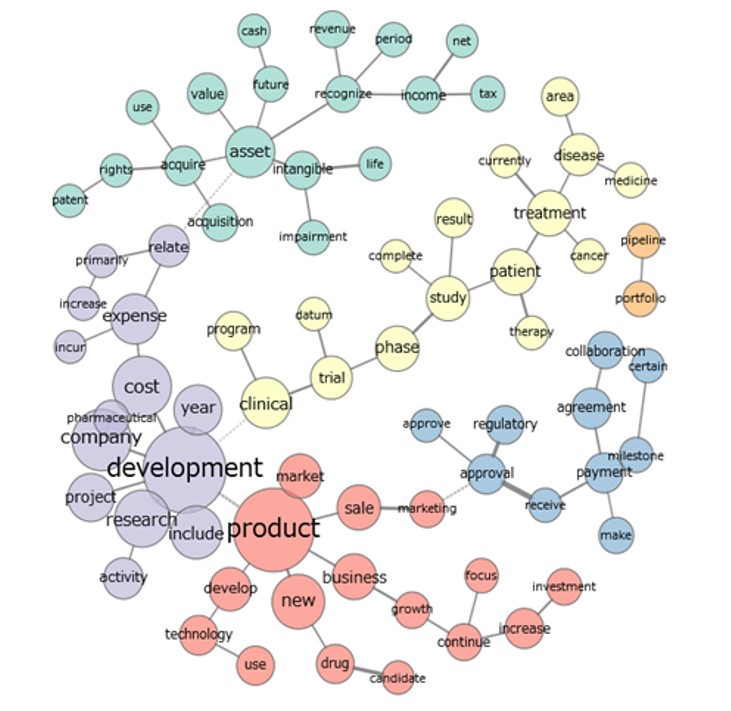
Figure 2 presents a dendrogram which visualizes the results of the hierarchical clustering approach. The adopted approach allowed to distinguish five clusters which differed in terms of narrative context in the R&D area.
The tree diagram illustrates a way how clusters are created. In this procedure, each object Oi (i = 1,2,…49) is considered to be a single element cluster (Gi) in the beginning. Then the Euclidean distances between all pairwise clusters are computed. If we assume that clusters Gp and Gq merge into a new cluster Gr where Gr = Gp ∪ Gq, the next step is to specify a dissimilarity between Gr and all other objects (Oi) or clusters (Gi). The Lance-Williams dissimilarity update formula allows to establish the abovementioned distance (Murtagh and Contreras, 2012).
Fig. 2. Cluster analysis (n=65)
Source: (Dyczkowska 2020, p. 7633)
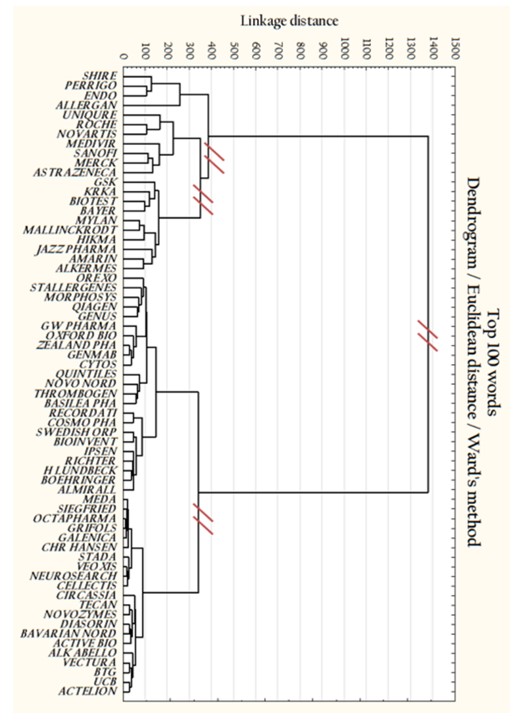
The dendrogram presents how two individual entities merge together or with an existing cluster consisting of more than one observation. A visual inspection of the tree diagram allows to identify five various groups separated through cutting off four linkages. The groups are not equinumerous. Another point is that the dendrogram clearly shows two agglomerations which has quite long distance from each other. The aim of the next part of the paper is to find out whether there were any contextual differences in a direction of R&D narratives between specified clusters.
R&D narratives context across the clusters
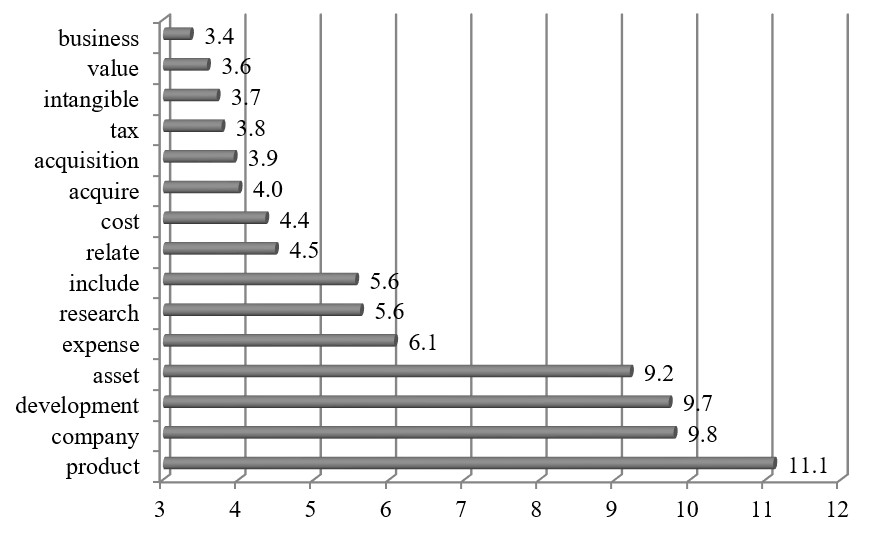
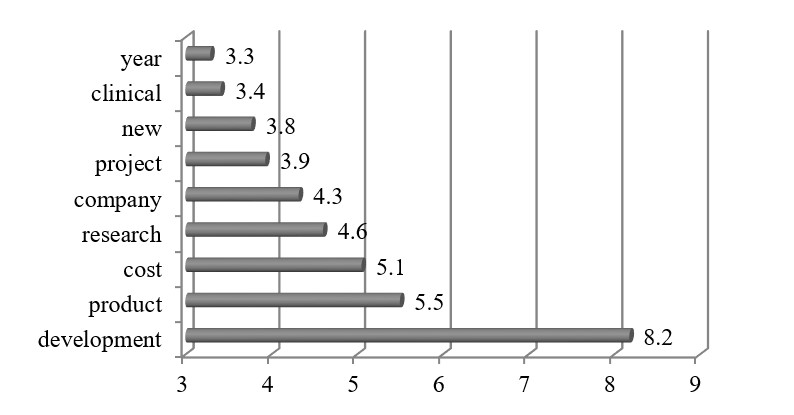
The first cluster covers four objects: Allergan (Ireland), Endo International (Ireland), Perrigo (Ireland) and Shire (United Kingdom). All these companies come from the European Anglosphere and are similar in terms of mean annual sales revenues generated in 2012-2014 (the variation coefficient was moderately low and amounted to 40%). Mean annual R&D expenses incurred in 2012-2014 equalled €440m. It should be noted that two entities: Endo International and Allergan prepared their annual reports using form 10-K, which is required by the U.S. Securities and Exchange Commission (SEC). The narrative analysis indicates that the main discussion oscillated around product, development, company as well as R&D accounting policy. The latter feature distinguishes the first cluster from the other groups analysed in this study.
Fig. 3: Cluster 1: Word occurrence intensity measure (n=4)
Source: Own presentation.
In order to visualize results achieved for the first cluster, a word occurrence intensity measure was calculated5, which shows how frequently the particular word was applied in the examined text. Figure 3 exemplifies the most frequent words in the first cluster for which the measure reached the level above 3.
The companies from the first cluster reported much on assets. The examined R&D paragraphs provide a lot of information about intangibles, their structure, amortization and impairment. Intangible assets account for significant part of fixed assets in the balance sheets of biopharmaceutical companies. They are classified into indefinite-lived intangibles which cover in-process research and development (“IPR&D”) and definite-lived intangibles such as licenses, customer relationships, tradenames, developed technology etc. for which weighted average life is established.
The next area reported by biopharmaceutical companies concerns R&D expenses. The companies disclose amounts and changes in the levels of R&D expenses as compared to the previous years and the structure of R&D expenses. Another issue debated in the annual reports is the recognition of R&D expenses in the financial statement following the assumed R&D accounting policy. A topic of R&D expenses is discussed also in different context. Allergan, for example, explains how it assigns R&D expenses to R&D project for management purposes by disclosing the level of direct costs allocated to late-stage project (covering candidates in Phase III clinical trials), other R&D projects, upfront payments to license or purchase in-process R&D assets and all other R&D expenses.
“For management purposes, we accumulate direct costs for R&D projects, but do not allocate all indirect project costs, such as R&D administration, infrastructure and regulatory affairs costs, to specific R&D projects. Additionally, R&D expense includes upfront payments to license or purchase in-process R&D assets that have not achieved regulatory approval. Our overall R&D expenses are not materially concentrated in any specific project or stage of development.” (Allergan, 2014, p. 54).
The biopharmaceutical companies discuss readily on acquisitions in which they seek incremental development growth opportunities. Through acquisitions of other entities, a companies may expand their knowledge with new technologies or increase their efforts to develop generic products with complex formulations and high barriers to market entry. In that context, Endo International reports:
“In addition to our in-house research and development efforts, we seek to acquire rights to new intellectual property through corporate acquisitions, asset acquisitions, licensing and joint venture arrangements. We compete to acquire the intellectual property assets that we require to continue to develop and broaden our product range. Competitors with greater resources may acquire assets that we seek, and even where we are successful, competition may increase the acquisition price of such assets or prevent us from capitalizing on such acquisitions or licensing opportunities. If we fail to compete successfully, our growth may be limited.” (Endo International, 2014, p. 24).
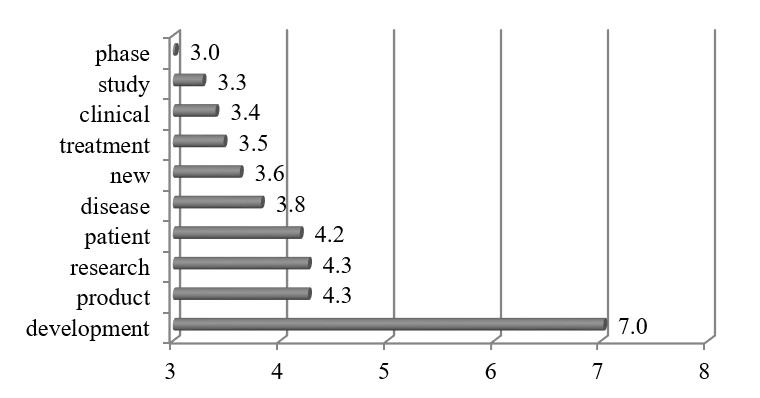
The second cluster is composed of seven companies, including: AstraZeneca (UK), Medivir (Sweden), Merck (Germany), Novartis (Switzerland), Roche (Switzerland), Sanofi-Avensis (France) and Uniqure (The Netherlands). This group is characterized by the highest mean levels of R&D expenses and sales revenues, the longest annual reports (mean: 216 pages) and R&D narratives (mean: 9417 words). More in-depth analysis, however, shows that the cluster is not uniform in terms of the levels of R&D expenses and sales revenues. Five companies reached 10-digit level of R&D expenses and sales revenues whereas two other entities only 8-digit level.
A careful analysis proves that all companies assigned to the second cluster intensively discuss on diseases and other contextual aspects such as patients, treatments, clinical phases or product development in their R&D narratives (See fig. 4).
Fig. 4. Cluster 2: Word occurrence intensity measure (n=7)
Source: Own presentation.
In this way, they make a contribution about how they pursue the mission by communicating a sense of intended directions of the whole organization and providing tangible effects of clinical trials, treatments or therapies. Such an approach is consistent with stakeholder and legitimacy theories. Stakeholder theory underlines existence of various groups of interests and assumes that stakeholders have a right to know what happens in an organization (normative branch of the theory) and their needs should not be disdained (positive branch of the theory) (Deegan 2000). In this context managers are required to contemplate the frameworks of voluntary narrative disclosure. Legitimacy theory is based on an assumption that organizations act in a manner which is consistent with “socially constructed system of norms, values, beliefs and definitions” adopted by society (Suchman 1995). Following this theory, a quality of voluntary disclosure is to be adjusted to the expectations of society whereas narratives should legitimize business activities, efforts and performance in a comprehensive and readable way.
The companies of the second cluster stress an importance of potential beneficiaries – patients which should be treated equivalently with shareholders. In this context, they are searching for patients most likely to benefit from their treatments. Therefore, they examine efficacy of drug candidates in a particular group of patients and report about the results in R&D narratives.
“We strengthened and accelerated our pipeline, and increased the momentum behind our growth platforms. Our efforts are creating significant value for patients and shareholders.”(AstraZeneca, 2014, p. 6).
“Our innovativeness is concentrated, in our research and development operations, on areas where a substantial need exists for new medical treatments that can offer considerable patient benefit.”(Medivir, 2014, p. 7).
The companies in the second cluster describe precisely the activities’ areas and specify the range of diseases they are aiming at with various treatments and therapies as well. They strengthen the importance of new technologies and a role of effective collaboration with strategic research partners.
“We seek to develop gene therapies targeting a range of liver-based, cardio/metabolic and CNS indications, from ultra-orphan diseases, such as LPLD (for which Glybera is designated), to orphan diseases such as hemophilia B and Sanfilippo B syndrome, to common diseases that affect far larger populations, such as congestive heart failure and Parkinson’s disease. The core of our approach is our modular technology backbone, which allows us to advance our programs in multiple therapeutic areas using validated components of our technology and safety and efficacy data from earlier clinical studies, in multiple therapeutic areas, with the potential to reduce development risk, cost and time to market. As part of our strategy, we are accessing important medical expertise for our therapeutic focuses through strong ties with academic thought leaders and clinical institutions.” (Uniqure, 2014, p. 9).
“Collaboration” is a word frequently meet in the part concerning R&D narratives. AstraZeneca underlines several times its collaborations, including cooperation with diagnostic and biomarker companies, partnerships with the universities and cooperation with research institutions. In its annual report we may find the following statements:
“To ensure the full potential of our science-led strategy is realised, our business model is evolving to include value creation through collaboration, out-licensing and divestment.” (AstraZeneca, 2014, p. 11).
“Collaboration is key to accessing the best science and technology, achieving scientific leadership and delivering innovative, life-changing medicines.” (AstraZeneca, 2014, p. 45).
Although being innovative requires from companies to collaborate with a large number of external research institutions, there arises a paradox of openness since creation of innovations often entails openness, but the commercialization of innovations requires protection (Laursen and Salten, 2014). This problem seems to be essential for the high-tech sectors and is debated in literature (Inauen and Schenker-Wicki, 2012; Laursen and Salten, 2014; Boudreau and Lakhami, 2015). Boudreau and Lakhami (2015) attempted to understand the comparative advantages of final versus intermediate disclosure policies6 and how they shape innovations, whereas Inauen and Schenker-Wicki (2012) examined the impact of open innovation strategies (as opposed to closed innovation strategies) on firm’s innovation performance.
The interesting but difficult part of disclosure concerns the results of clinical studies. The companies of the second cluster report on outcomes achieved in various phases of clinical trials. Phase 1 usually tests medicine in terms of metabolism, pharmacokinetics and pharmacological actions as well as presents side effects related with increasing doses. Trials are conducted on healthy volunteers and, if possible, companies disclose early evidence on medicine effectiveness. Phase 2 of clinical trials is carried out in regard to a limited patient population. It aims at determining effectiveness of medicine for particular indications and dosage tolerance as well as identifying common adverse effects or safety risks. Phase 3 of clinical trials is conducted if medicine tested in Phase 2 demonstrated effectiveness and an acceptable safety profile. The purpose of Phase 3 is to collect information on clinical efficacy and safety in a larger number of patients often geographically dispersed.
“2014 had some very positive clinical trial results. In HER2- positive metastatic breast cancer, a particularly aggressive form of the disease, we saw unprecedented data on Perjeta, which, when combined with chemotherapy and Herceptin, increased survival time for patients to almost five years. In advanced melanoma, we also had very good clinical trial results for the combination of cobimetinib and Zelboraf, which halved the risk of the disease worsening. Roche now has over 30 different combination therapies in its oncology pipeline.” (Roche, 2014, p. 45).
It should be emphasized that the descriptive parts concerning results of clinical studies are very difficult to track over with a lot of scientific expressions, proper names and long words. Therefore, the Flesch Reading Ease Score indicated that the readability of the second cluster was assessed as very confusing or difficult to read with the mean score 24.2.
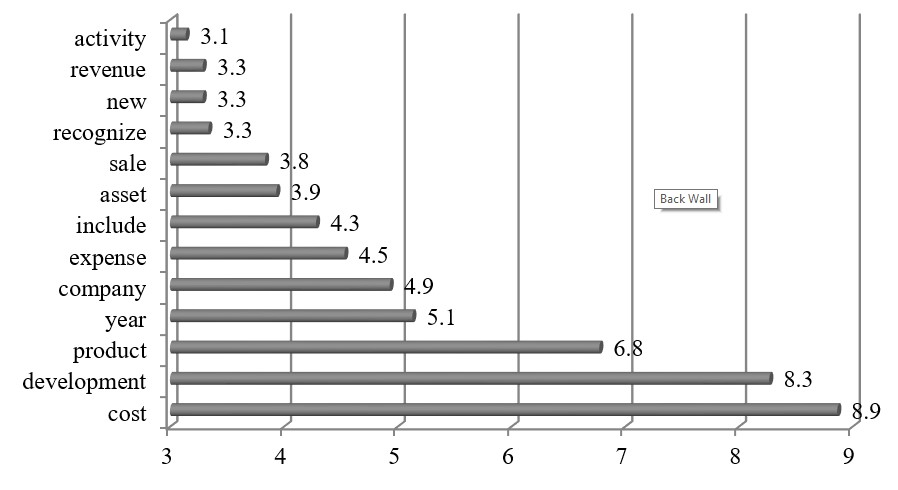
The third cluster consists of ten objects of which six companies are from the European Anglosphere (Alkermes, Amarin, GlaxoSmithKline, Hikma Pharmaceuticals, Jazz Pharmaceuticals, Mallinckrodt) whereas the other four are from continental Europe (Bayer, Biotest, Krka, Mylan). The group is quite diverse in terms of R&D expenses and sales revenue levels. Two large companies: Bayer and GlaxoSmithKline recorded mean R&D expenses of over €3bn and €4bn respectively in 2012-2014 and consequently high sales revenue levels. The next four companies reached R&D expenses in the range of €100m and €400m, whereas the other firms in the range of €30m and €40m. The objects in the third cluster had moderately long annual reports (mean: 195 pages) and R&D narratives (mean: 5082 words). It should be noted that a half of this group prepare their annual reports on form 10-k.
The companies included in the third cluster focus on presenting their strategic activities related with development of new products (See fig. 5). They mention about that in the context of product differentiation within a product pipeline, business or operating models, product licencing or acquisition.
“Our key strategic priority is to develop a strong product pipeline, with a focus on niche, differentiated products. In part, this is being achieved through increased investment in internal R&D, including more complex regulatory filings …” (Hikma Pharmaceuticals, 2014, p. 22).
“Our long-term strategy is to increase patient access and appropriate utilization of our existing products, develop new and follow-on formulations for recently acquired products, advance pipeline products and bring them to market and selectively acquire or license products that are strategically aligned with our product portfolio to expand the size and profitability of our Specialty Brands segment”(Mallinckrodt, 2014, p. 6).
Fig. 5. Cluster 3: Word occurrence intensity measure (n=10)
Source: Own presentation.
Interestingly, more than a half of companies concentrate intensively on financial topics such as costs, expenses or cash in R&D narratives (See fig. 5), which may be explained by observing the rules of form 10-k. Alkermes, for instance, admits that its spending depended on operational and financial factors, including: the progress of R&D programs (clinical trials), the time and expense needed to pursue FDA or non-U.S. regulatory approvals, the time and expense needed to prosecute, enforce and challenge patent or other intellectual property rights, the impacts of technological and market developments on product candidates and many other aspects. Moreover, the company specifies its R&D expenses dividing them into external and internal ones.
“External R&D expenses include costs related to clinical and non-clinical activities performed by CROs, consulting fees, laboratory services, purchases of drug product materials and third-party manufacturing development costs. Internal R&D expenses include employee-related expenses, occupancy costs, depreciation and general overhead. We track external R&D expenses for each of our development programs, however, internal R&D expenses are not tracked by individual program as they benefit multiple programs or our technologies in general.” (Alkermes, 2014, p. 64).
The other companies report in the similar tone by putting their attention to a structure of R&D expenses.
“Research and development expense consists primarily of fees paid to professional service providers in conjunction with independent monitoring of our clinical trials and acquiring and evaluating data in conjunction with our clinical trials, fees paid to independent researchers, costs of qualifying contract manufacturers, services expenses incurred in developing and testing products and product candidates, salaries and related expenses for personnel, including stock-based compensation expense, costs of materials, depreciation, rent, utilities and other facilities costs. In addition, research and development expenses include the cost to support current development efforts, including patent costs and milestone payments.” (Amarin, 2014, p. 66).
The majority of companies in the third cluster disclose information on sales performance. They report about the changes in sales volumes and factors affecting thereof. Some organizations provide detailed information on sales in segments across various markets all over the world. Mylan, for example, Dutch biopharmaceutical company, discloses information about the sales markets in North America, Europe and in the rest of the world, including India, Australia, Japan, New Zealand, Brazil and Taiwan. The company determines the customer groups, including: hospitals, group purchasing organizations (“GPOs”), long term care facilities, wholesalers, surgical services, home infusion service providers, correctional facilities, specialty pharmacies and retail outlets in the US and Canada generic market. Since the company acts actively on generic pharmaceuticals market, it points out the related risk connected with possibility of future growth.
Another issue discussed broadly in R&D narrative parts concerns the achievement of marketing approvals which was a key step in strengthening and broadening product portfolios.
“With respect to all of our products and product candidates, we believe that our ability to successfully compete will depend on, among other things: (…) our ability to complete clinical development and obtain regulatory approvals for our product candidates, and the timing and scope of regulatory approvals” (Jazz Pharmaceuticals, 2014, p. 12).
It should be noted that business activities of biopharmaceutical companies are subject to extensive regulations issued by various institutions. They impose several requirements on manufacturing, labelling, packaging, storage, advertising, promotion, sale, distribution and R&D activities. Due to these requirements product development, marketing approval and commercialization processes are very often expensive and time-consuming, therefore Hikma Pharmaceuticals, for example, developed local R&D centres which were established to propel product approvals.
“We are benefiting from recent investments to establish strong local R&D centres which are accelerating the rate of product submissions and approvals.” (Hikma Pharmaceuticals, 2014, p. 18).
The fourth cluster is the most numerous one and consists of 23 objects of which about 65% come from Western Europe and Scandinavia: Basilea Pharmaceutica (Switzerland), Boehringer Ingelheim (Germany), Cytos Biotechnology (Switzerland), Ipsen (France), Morphosys (Germany), Quiagen (The Netherlands), Stallergenes (France), Thrombogenics (Belgium), Bioinvent International (Sweden), Genmab (Denmark); H Lundbeck (Denmark), Novo Nordisk (Denmark), Orexo (Sweden), Swedish Orphan Biovitrum (Sweden) and Zealand Pharma (Denmark). The cluster includes also four companies from the European Anglosphere: Genus (UK), GW Pharmaceuticals (UK), Oxford Biomedica (UK), Quintiles (UK) and the same number from Central and Southern Europe: Almirall (Spain), Cosmo Pharmaceuticals (Italy), Recordati (Italy), Richter Gedeon (Hungary).
The fourth cluster is diverse in terms of R&D expenses and sales revenue levels. Three large companies: Boehringer Ingelheim, Novo Nordisk and Quintiles recorded mean R&D expenses in the range of €1.5bn and €5.5bn and consequently high sales revenue levels. The next five companies reached the range of R&D expenses between €100m and €400m, whereas the other 65% companies were moderately similar with the mean level of R&D expenses equalled about €35m. The objects in this cluster have the shortest annual reports (mean: 112 pages) but moderately long R&D narratives (mean: 2907 words) as compared to the lengths of annual reports.
The discussion in the fourth cluster oscillates around product development, cost and research (See Fig. 6). The companies report much on activities undertaken to realize the strategy.
Fig. 6. Cluster 4: Word occurrence intensity measure (n=23)
Source: Own presentation.
The topic of research is quite intensively debated in the R&D narratives. French company – Ipsen – reports a lot on research activities and stresses that ”Research is crucially important to deliver innovations to meet patients’ needs.” (Ipsen, 2014, p. 14). It should be noted that partnerships have a strong impact on Ipsen’s research activities since they “accelerate testing of the feasibilityand relevance of research concepts, strengthen the technological platforms, identify new therapeutic targets (…).” (Ipsen, 2014, p. 48). The company underlines its focus on patient-driven R&D which consists in building “a dynamic bridge between fundamental science and clinical medicine, where researchers and clinicians work together with the project team” (Ipsen, 2014, p. 49). The idea aims at fostering the interactions between these two groups with an intention to share the unique expertise of these professions.
British company – Genus – puts attention on risks concerning research commercialisation. The company recognizes a risk of a lack of focus on research initiatives directed at commercially important areas. Another tough problem identified concerns rapidly changing technologies and difficulties with commercialisation of new ones due to the third-party intellectual properties.
The Dutch company – Qiagen – depicts its research by disclosing parallel paths of innovation which consists in creating new platforms for automation workflows, expanding its portfolio, integrating bioinformatics with the testing process.
„Our bioinformatics teams are developing new software solutions and adding proprietary cloud-based resources to support the latest research and clinical trends in molecular testing, especially the interpretation of large volumes of data from next-generation sequencing.”(Qiagen, 2014, p. 35).
Qiagen as an innovative company efficiently links research context with a new technology and careful narration of performance.
“Our marketing strategy focuses on providing high-quality products that offer customers unique value, coupled with commitment to technical excellence and customer service.” (Qiagen, 2014, p. 35).
Interestingly, a thematic module which distinguishes the fourth cluster from the other ones is related with R&D projects. Swedish company – Orexo – reports much on collaboration projects and partners with whom it enters into agreements. Moreover, the company discloses several factors due to which the project may fail or be delayed, including: unfavourable results in clinical trials, failure to gain the authority approval required for sales of the pharmaceutical product or a change in the requirements of the regulatory authorities.
“Orexo entered into a collaboration agreement with AstraZeneca in January 2013 regarding OX-CLI, a preclinical program for potential new treatment of respiratory tract diseases. Under the agreement AstraZeneca gained the rights to perform extensive preclinical research and evaluation of compounds in Orexo’s OX-CLI program. AstraZeneca has an option to acquire all compounds linked to the program, whereby Orexo will receive milestone payments during the development phase and royalty payments based on future revenues. AstraZeneca is responsible for all development costs for the project.”(Orexo, 2014, p. 17).
Danish company – H Lundbeck – reports on the number of R&D project in different phases of research also in the context of its human resources in R&D departments.
“At year end 2014, Lundbeck had ten projects in R&D, ranging from early-stage research through to registration applications. While these new drug candidates may or may not eventually receive regulatory approval, getting potential new treatments into the clinical development phase is the foundation of possible future products. At the end of 2014, we employed approximately 1,300 people in our R&D units, including a substantial number of physicians and scientists holding graduate or post-graduate degrees, as well as many highly skilled technical personnel. The number of clinical studies underway has increased from 18 in 2011 to 29 in 2014.” (H Lundbeck, 2014, p. 15).
French company – Stallergenes – reports on activities of its Foundation in the context of projects. The Stallergenes Foundation aims at improving both the prevention and the early management of allergies and provides grants financing projects within allergology area.
“Moreover, under the authority of a scientific committee made up of experts, each year the Foundation allocates grants to support innovation and help researchers to strengthen their knowledge of allergology. In 2014, initial calls for research, education and training projects resulted in approximately 20 applications, including 12 in research. Grants were allocated to 8 projects: 4 in research, 2 for allergology training and 2 for projects on allergy education.” (Stallergenes, 2014, p. 21).
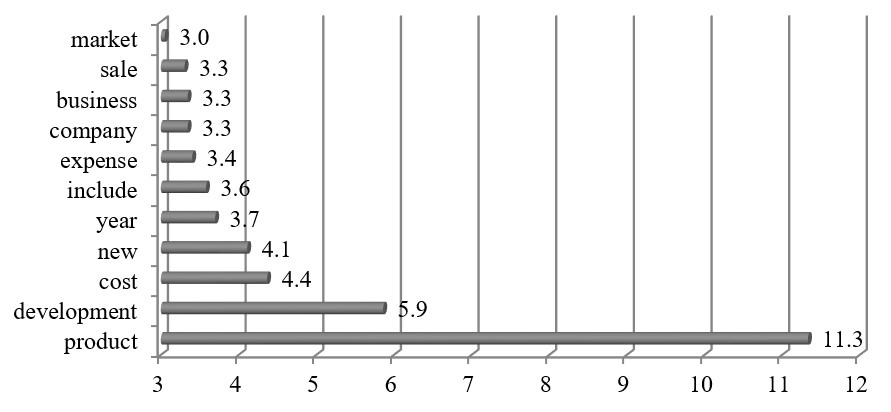
The last cluster covers 21 objects of which 38% come from the Western Europe (Actelion, Cellectis, Galenica, Octapharma, Siegfried, Stada Arzneimittel, Tecan and UCB) and the same percent form Scandinavia (Active Biotech, Alk Abello, Bavarian Nordic, Chr Hansen, Meda, Neurosearch, Novozymes and Veloxix Pharmaceuticals). There are also three companies from the European Anglosphere (BTG, Circassia and Vectura) and one from Central and Southern Europe (Grifols). The average length of annual reports in this group is 118 pages whereas the parts dedicated to R&D narrative are much narrower than in the clusters 1-4 (mean: 956 words). The fifth cluster is characterised by the lowest R&D expenses and sales revenues levels.
The R&D narratives in that group concentrates intensively on product development and related cost, sale and revenues.
Fig. 7. Cluster 5: Word occurrence intensity measure (n=21)
Source: Own presentation.
The disclosures have operational character since they refer mainly to financial effects of activities carried out in the reported period. The companies in that cluster rarely discuss on patients, therapies, clinical studies or collaboration with external partners in the R&D context. It may be explained by their less strategic orientation due to the lower R&D expenses as compared to other clusters.
Context of R&D narratives and R&D expenses and intensity levels
Based on cluster analysis and R&D narratives explored in previous sections the next research step was taken. It consisted in checking whether the specified subsamples came from different populations in terms of R&D expenses level and consequently whether they significantly differed between each other. With regard to discussion character three subsamples were distinguished. They represented various discussion contexts, including R&D accounting policy context (cluster 1), R&D strategic context (clusters 2-3) and R&D operational context (cluster 4-5). Such a division is consistent with the agglomerative hierarchical clustering approach whose results are demonstrated on dendrogram.
Then a null hypothesis was posed that three specified subsamples came from populations with the same distribution. Since the ANOVA has restrictive assumptions concerning the distributions of the samples7 which in fact have not been met for this dataset, a rank-based nonparametric Kruskal-Wallis H test was applied. It is an omnibus test checking whether the mean ranks of the groups are the same.
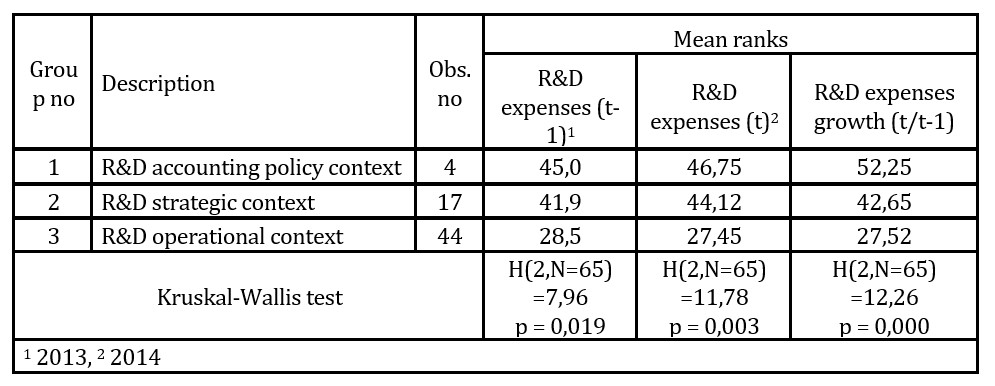
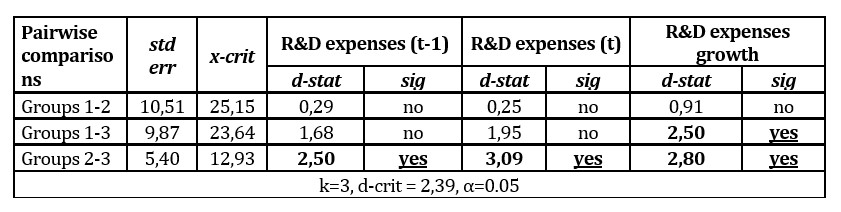
The results of Kruskal-Wallis H test for independent variables related with R&D expenses indicated that there existed statistically significant difference in each median variable among the three samples which differed in terms of R&D narrative context (See table 2).
Table 2: Analysis of R&D expenses mean ranks across the subsamples
Source: (Dyczkowska 2020, p. 7635)
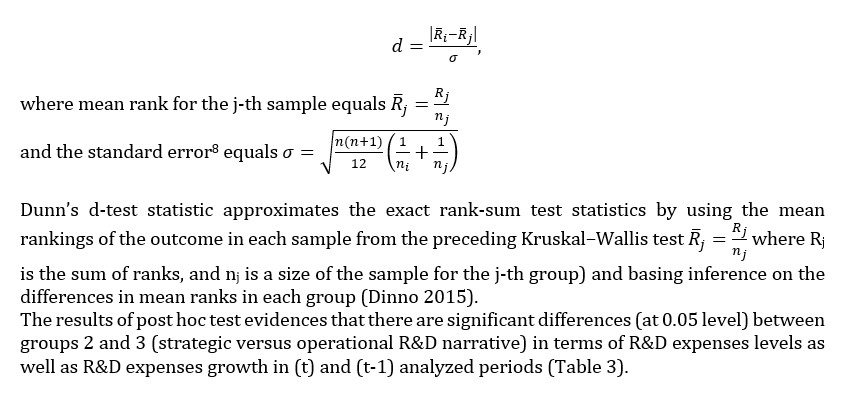
Due to the rejection of all null hypotheses of the Kruskal-Wallis H tests for independent variables, multiple pairwise comparisons were carried out looking for stochastic dominance or median differences between particular subsamples. Then a post hoc Dunn’s test was applied. It uses the following statistic:
Table 3: Dunn’s post hoc test
Source: (Dyczkowska 2020, p. 7636)
The conclusion is that companies which disclose more strategically on their R&D activities have higher R&D expenses levels and growths than companies with operational R&D narrative context. Moreover, the group which reports intensively on R&D accounting policy differs with statistical relevance from the group reporting on R&D operational aspects in terms of R&D expenses growth. In this case companies which orientate on R&D accounting policy discussion have higher R&D expenses growths over the years of 2013 and 2014 than companies reporting on operational aspects.
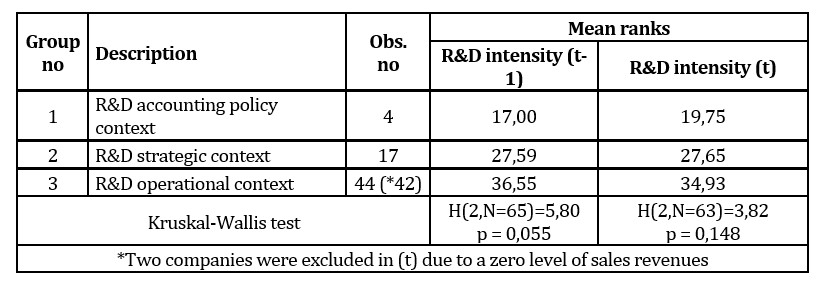
Similar analysis was carried out in reference to R&D intensity – a measure of R&D expenses to sales revenues (Table 4). In this case Kruskal-Wallis H test allows to accept the null hypothesis that the subsamples come from populations with the same distribution with reference to independent variables. It means that mean ranks of the groups are the same. Therefore, there is no reason to proceed with post hoc Dunn’s test. Concluding, it was proved that the subsamples did not differ statistically significant between each other in terms of R&D intensity levels.
Table 4: Analysis of R&D intensity mean ranks across the subsamples
Source: (Dyczkowska 2020, p. 7636)
Context and readability of R&D narratives
A text readability is one of two concepts of syntactic analysis (Moreno and Casasola 2016) which is associated with narrative’s inherent capability of being read promptly and easily (Schroeder and Gibson 1990). The other concept refers to text comprehensibility by the readers (Smith and Taffler 1992, Soper and Dolphin 1964). In that concept, characteristics of the individual reader play an important role and its competence to understand a text properly and fluently. The previous empirical studies evidenced that narratives included in annual reports as a rule are difficult or very difficult to read (Pashalian and Crissy 1952; Soper and Dolphin 1964; Dolphin and Wagley 1977; Smith and Taffler 1992; Clatworthy and Jones 2001) which is consistent with the results obtained in this study.
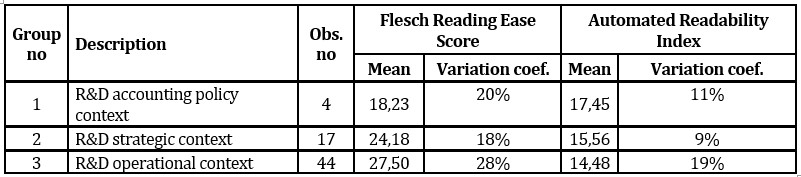
The mean levels of Flesch Reading Ease Score and Automated Readability Index indicated that readability of R&D narratives is very low, although there are visible slight differences in these measures between three analysed subsamples (See table 5).
Table 5: Text readability indices in the examined clusters
Source: Own presentation.
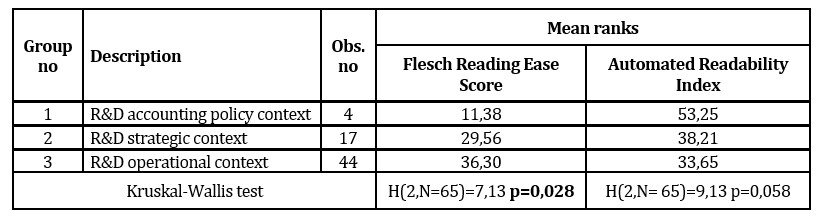
In order to validate a conjecture that three analysed subsamples come from different populations in terms of readability, Kruskal-Wallis H tests was applied. With reference to Automated Readability Index, Kruskal-Wallis H test allows to accept the null hypothesis that subsamples come from populations with the same distribution. The results confirms, however, that there exists statistically significant difference (at 0.05 significance level) in mean ranks of Flesch Reading Ease Score across three subsamples (See table 6)
Table 6: Analysis of Text readability indices mean ranks across the subsamples
Source: Own presentation.
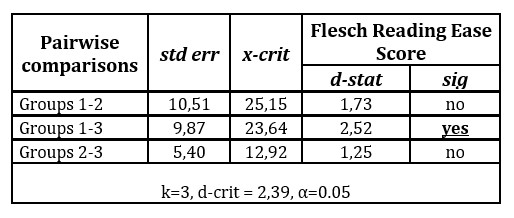
Consequently, the multiple pairwise comparisons were conducted. Their aim was to search for median differences between particular subsamples in reference to Flesch Reading Ease Score using a post hoc Dunn’s test (See table 7). The outcomes of post hoc test evidences that there are relevant differences (at 0.05 significance level) between groups 1 and 3 considering Flesch Reading Ease Score. The conclusion is that the companies which discuss R&D accounting policy issues apply more cluttered and unclear language than the companies which report on operational activities.
Table 7: Dunn’s post hoc test
Source: Own presentation.
It should be noted that Flesch Reading Ease Score consists of syntactic and semantic variables which explain the final results. R&D accounting narratives are saturated with complex and difficult words as well as with longer sentences, whereas R&D operational narratives are easier to follow with shorter sentences filled with numbers and percentages capturing discussions on company’s performance9. Although slight but relevant differences in terms of readability levels are identified between these two groups of companies, it must be stated that in general R&D narratives are difficult or very difficult to read10 which fully support the previous empirical results (Pashalian and Crissy 1952; Soper and Dolphin 1964; Dolphin and Wagley 1977; Smith and Taffler 1992; Clatworthy and Jones 2001).
Discussion and conclusion
International Accounting Standards Board (IASB) clearly underlines that annual reports are expected to be useful to readers for making decisions no matter whether information provided is of quantitative or qualitative character (IASB 2010). In turn, Financial Reporting Council (FRC) adds that language used in annual reporting should be plain with “well-defined terms, consistent terminology and an easy-to-follow structure” (FRC 2009).
Following Merkley (2014) I support the opinion that despite the significance of R&D information knowledge on how companies disclose R&D related information in their financial reports is limited. Although R&D narratives constitute an important part of annual reports of biopharmaceutical companies, in fact, they are difficult to capture. The reason is that, with minor exceptions, R&D narratives are not well distinguished as separate sections of annual reports. Therefore, in order to obtain a comprehensive sense of corporate R&D activities, the contents of R&D narratives were examined using text mining as a qualitative method. The cluster analysis as an exploratory tool to support the examination of relations in the text was applied as well. The abovementioned technique represents a mixed approach which allows processing qualitative data through clustering. Macia (2015) underlines that such an approach allows to manage a complexity of qualitative data while still maintaining its richness. She argues that cluster analysis with qualitative data has already been discussed and documented for instance in the study of Guest and McLellan (2003), however, it remained underused mainly due to an obscurity regarding how to apply that tool to qualitative data correctly.
The first research question formulated in this study concerned the differences in a way how companies from specified clusters debated on R&D issues and the differences in R&D narrative readability.
RQ1: How do R&D narratives differ in various clusters of biopharmaceutical companies in terms of discussion context and text readability?
The qualitative text analysis supported by text mining technique contributed to the identification of the most frequent words and the relationships between them whereas the cluster analysis allowed to distinguish five groups of companies representing different R&D disclosure approaches.
The first cluster was composed of four companies coming from the European Anglosphere. The main discussion in R&D narrative parts oscillated around product, development, company as well as R&D accounting policy. The latter feature distinguished the first cluster from the other groups analysed in this study. This disclosure approach, however, might have been induced by the requirements of U.S. Securities and Exchange Commission (SEC) since two out of four companies in this cluster used 10-K form of annual reports. R&D narratives of the second and the third cluster had definitely strategic character. The second cluster contained seven companies of which the majority came from Western Europe. This group was characterized by the highest mean levels of R&D expenses and sales revenues, the longest annual reports (mean: 216 pages) and R&D narratives (mean: 9417 words). The companies assigned to the second cluster intensively discussed on diseases and other contextual aspects related to patients, treatments, clinical phases or product development. This open and broad discussion reflects stakeholder approach when the reporting company legitimizes its actions by communicating a sense of existence and providing tangible effects of business activities. The third cluster consisted of ten companies, which published moderately long annual reports (mean: 195 pages) and R&D narratives (mean: 5082 words). The objects in the third cluster concentrated on presenting their strategic activities related with the development of new products in the context of product differentiation within a product pipeline, business or operating models, product licencing or acquisition. The companies included in the last two clusters focused on disclosure of operational aspects of their activities. The objects from the fourth cluster reported much on actions undertaken to realize the strategy, including research activities and partnerships stimulating such activities. Consequently, the companies revealed information about collaboration projects, partners and several factors due to which the project could fail or be delayed. Moreover, the companies put attention on risks concerning research commercialisation opportunities. The companies from the fifth cluster rarely discussed on patients, therapies and clinical studies which may be explained by their less strategic orientation due to the lower R&D expenses as compared to other clusters. Instead, they provided more information about financial effects of activities carried out in the reported period.
The assessment of the readability measures evidenced that in general R&D narratives were difficult or very difficult to track. Nevertheless, the outcomes of statistical analysis proved that the readability level of R&D narratives provided by companies which reported intensively on operating issues differed statistically relevant from narratives provided by companies disclosing R&D accounting policy. The latter group applied cluttered language including long sentences and unintelligible words difficult to follow by the ordinary readers.
The second research question referred to relationships between the content of R&D narratives and R&D expenses and intensity levels.
RQ2: Is the context of R&D narratives contingent on R&D expenses and intensity levels?
In order to obtain an answer whether the context of R&D narratives was related with R&D expenses or intensity levels, a non-parametric counterpart of the one-way ANOVA – an omnibus Kruskal-Wallis test for median difference – and post hoc Dunn’s test for pairwise multiple comparisons were applied. The results of the study proved that the companies which disclosed more strategically on their R&D activities had higher R&D expenses levels and higher R&D expense growths than the companies with operational R&D narrative context. Moreover, the group which reported intensively on R&D accounting policy differed from the group reporting on R&D operational aspects in terms of R&D expenses growth. The empirical evidence did not support the conjecture that intensity level may affect R&D narratives’ context.
This paper contributes to the existing body of literature by applying a qualitative approach to examine relations between particular words in the analysed texts and established the contextual meaning of these relations. Moreover, an in-depth text analysis allowed to create a co-occurrence network which exemplified the said relations. The advantage of this study is that it applies an international context on the European level. However, there are also certain limitations of the study, therefore, future research can upgrade and broaden the analyses. Firstly, the study focuses on biopharmaceutical companies only which was an intended limitation due to idiosyncrasy of R&D activities. The concentration on a specific sector of high-tech companies due to relative uniqueness of their R&D activities facilitates to some extent the formulation of final inferences. Secondly, the study refers to R&D disclosures provided in annual reports and ignores R&D information revealed voluntary through other media such as corporate websites or press releases. Finally, a separation of R&D content from the annual report when it is not clearly distinguished in text depends on a researcher’s approach and may raise questions concerning objectivity.
Concluding, future research may search for an answer to the essential question what drives R&D disclosures considering (1) R&D information sensitivity when companies have internal strong technological capabilities and necessary resources to commercialize innovations and (2) open innovation paradox related with sharing and protecting knowledge within R&D collaborations?
Acknowledgment
The project is financed by the Ministry of Science and Higher Education in Poland under the programme “Regional Initiative of Excellence” 2019 – 2022 project number 015/RID/2018/19 total funding amount 10 721 040,00 PLN.
Endnotes
1Novartis, for instance, recognizes investors’ needs and rewards them adequately: „Our mission is to care and cure. We want to discover, develop and successfully market innovative products to prevent and cure diseases, to ease suffering and to enhance the quality of life. We also want to provide a shareholder return that reflects outstanding performance and to adequately reward those who invest their money, their time and their ideas in our company.” (Novartis, 2014, p. 1)
2 Flesch Reading Ease Score = 206.835 – (1.015 × average sentence length) – 84.6 × average syllables per word.
5 Word occurrence intensity measure is calculated as follows: number of word occurrences in the examined R&D narrative divided by total length of R&D narrative and multiplied by 1000.
6 Final disclosure policy relates to a situation in which an institution tends to provide complete information on innovation or problem-solving output (Boudreau and Lakhami, 2015). When the objects of disclosures are working inventions or complete research publications the revelation may be done by licencing for working inventions protected until the patent expires and by enabling access to academic journal database in case of the latter. Intermediate disclosures appear continuously and produce different amounts of data which are unstructured, may present partial or even negative results, since they are gradually updated. These disclosures concern ongoing projects as a rule, which present partial results of research studies through specific platforms with open or limited access for end-users (i.e. scientists).
7 The samples must have equal variances, the measures in each sample have to be continuous and normally distributed variables.
8 If there are a lot of ties, an improved version of the standard error calculation should be applied, such as follows
,where n is the total number of observations across all samples, τ is the number of tied ranks, and s is the number of observations tied at the s-th specific tied value.
9 The mean lengths of sentences in the first and third subsamples equalled 25 and 21 words per sentence respectively. However, some sentences depicting R&D accounting policy were much more longer, as indicated in the following example (over 80 words per sentence): “Intangible assets include developed technology, customer relationships, licensing agreements, trademarks, technology-related assets and other rights, which are being amortized over their estimated useful lives ranging from three years to 21 years, and in-process research and development assets with indefinite useful lives that are not amortized, but instead tested for impairment until the successful completion and commercialization or abandonment of the associated research and development efforts, at which point the in-process research and development assets are either amortized over their estimated useful lives or written-off immediately.” (Allergan, 2014, p. F-10)
10 The maximum and minimum level of Flesch readability index equalled 46 and 14 scores respectively.
Aboody, D. and Lev, B. (2000), ‘Information Asymmetry, R&D, and Insider Gains,’ The Journal of Finance 55 (6), 2747-2766.
Alkermes, (2014), ‘Annual Report,’ [Online], [Retrieved August 30, 2018] http://www.annualreports.com/Company/alkermes-inc
Allergan, (2014), Annual report, [Online], [Retrieved August 30, 2018], http://www.annualreports.com/Company/allergan-plc
Amarin, (2014), ‘Annual Report,’ [Online], [Retrieved August 30, 2018] http://investor.amarincorp.com/annuals.cfm
Arrow K.J., (1962) Economic welfare and the allocation of resources for invention. [in]: Arrow K.J. [ed.], The rate and direction of inventive activity, Princeton University Press, Princeton.
Astrazeneca, (2014), ‘Annual Report,’ [Online], [Retrieved August 30, 2018] https://www.astrazeneca.com/investor-relations/annual-reports.html
Atkinson, J. (2009), Intelligent Text Mining: Putting Evolutionary Methods and Language Technologies together, Handbook of Research on Text and Web Mining Technologies, Song M., Wu YB. (eds), New York: Information Science Reference, 37-59.
Baiman, S. and Verrecchia, RE. (1996), ‘The Relation among Capital Markets, Financial Disclosure, Production Efficiency and Insider Trading,’ Journal of Accounting Research, 34 (1), 1-22.
Beattie, V., McInnes, W. and Fearnley, S. (2004), ‘A Methodology for Analyzing and Evaluating Narratives in Annual Reports: a Comprehensive Descriptive Profile and Metrics for Disclosure Quality Attributes.’ Accounting Forum, 28 (3), 205-236.
Białek-Jaworska A., Gabryelczyk R. (2016), ‘Biotech spin-off business models for the internationalization strategy’, Baltic Journal of Management, 11 (4): 380-404.
Boudreau K.J., Lakhani K.R. (2015) ‘Open” disclosure of innovations, incentives and follow-on reuse: Theory on processes of cumulative innovation and a field experiment in computational biology’, Research Policy, 44 (1), 4-19.
Cheng, S. (2004), ‘R&D Expenditures and CEO Compensation,’ Accounting Review, 79 (2), 305–328.
Clatworthy M., Jones M. J. (2001), ‘The effect of thematic structure on the variability of annual report readability’, Accounting, Auditing and Accountability Journal, 14 (3), 311–326.
Cohen, D. (2003), ‘Quality of Financial Reporting Choice: Determinants and Economic Consequences, ‘ Working Paper, Northwestern University.
Dedman, E, Lin. SWJ., Prakash, AJ. and Chang, ChH. (2008), ‘Voluntary Disclosure and its Impact on Share Prices: Evidence from the UK Biotechnology Sector,’ Journal of Accounting and Public Policy 27 (3), 195–216.
Deegan, C. (2000) Financial Accounting Theory, McGraw-Hill Book Company, Sydney.
Deloitte (2015), ‘Measuring the Return from Pharmaceutical Innovation 2015. Transforming R&D Returns in Uncertain Times’ [Online], [Retrieved March 15, 2017], https://www2.deloitte.com/content/dam/Deloitte/uk/Documents/life-sciences-health-care/uk-deloitte-lshc-pharma-innovation-2015.pdf
Ding, Y., Entwistle, G. and Stolowy, H. (2004), ‘International Differences in R&D Disclosure Practices: Evidence in a French and Canadian Context,’ Advances in International Accounting, 17, 55-72.
Dinno, A. (2015), ‘Nonparametric Pairwise Multiple Comparisons in Independent Groups using Dunn’s Test,’ Stata Journal, 15 (1), 292-300.
Dolphin R., Wagley R. A. (1977), ‘Reading the annual report’, Financial Executive, 45: 20–22.
Dyczkowska J., (2020), Is the context of R&D narrative contingent on R&D expenses orR&D intensity? Evidence from European biopharmaceutical companies [in:] Soliman Khalid S. (ed.): Education Excellence and Innovation Management: A 2025 Vision to Sustain Economic Development during Global Challenges, International Business Information Management Association (IBIMA).
Dye, RA. (1985), ‘Disclosure of Nonproprietary Information,’ Journal of Accounting Research, 23 (1), 123–145.
Ferreira, L. and Hitchcock, DB. (2009), ‘A Comparison of Hierarchical Methods for Clustering Functional Data,’ Communications in Statistics: Simulation and Computation, 38 (9), 1925-1949.
Fishman M. J., Hagerty K. M. (2003), ‘Mandatory versus voluntary disclosure in markets with informed and uninformed customers’, The Journal of Law, Economics and Organization, 19 (1): 45–63.
Flesch R., 1948, ‘A new readability yardstick’, Journal of Applied Psychology, 32 (3), 221-233.
FRC (2009), Louder than words. Principles and actions for making corporate reports less complex and more relevant, London, England.
Gu, F. and Li, JQ. (2003), ‘Disclosure of Innovation Activities by High-Technology Firms,’ Asia-Pacific Journal of Accounting and Economics, 10 (2), 43-172.
Guest G., McLellan E. (2003), ‘Distinguishing the trees from the forest: Applying cluster analysis to thematic qualitative data’, Field Methods, 15 (2), 186-201.
Guthrie, J., Petty, R., Yongvanich, K. and Ricceri, F. (2004), ‘Using Content Analysis as a Research Method to Inquire into Intellectual Capital Reporting,’ Journal of Intellectual Capital, 5 (2), 282-293.
Haruya, M. and Kano, S. (2015), ‘A New Look at the Corporate Capability of Personalized Medicine Development in the Pharmaceutical Industry,’ R&D Management, 45 (1), 94–103.
H Lundbeck, (2014), ‘Annual Report,’ [Online], [Retrieved August 30, 2018] http://investor.lundbeck.com/downloads.cfm?dYear=2014
Inauen M., Schenker-Wicki A. (2012), ‘Fostering radical innovations with open innovation’, European Journal of Innovation Management, 15 (2), 212 – 231.
IASB (2010), The conceptual framework for financial reporting. London, England.
Ipsen, (2014), ‘Annual Report,’ [Online], [Retrieved August 30, 2018] https://www.ipsen.com/reports-publications
Jazz Pharmaceuticals, (2014), ‘Annual Report,’ [Online], [Retrieved August 30, 2018] http://www.annualreports.com/Company/jazz-pharmaceuticals-inc
Jensen MC. And Meckling WH. (1976), ‘Theory of the Firm: Managerial Behavior, Agency Costs and Ownership Structure,’ Journal of Financial Economics, 3 (4), 305–360.
Jones, MJ. And Shoemaker, PA. (1994), ‘Accounting Narratives: A Review of Empirical Studies of Content and Readability,’ Journal of Accounting Literature, 13, 142–184.
Jones, DA. (2007), ‘Voluntary Disclosure in R&D-Intensive Industries,’ Contemporary Accounting Research, 24 (2), 489–522.
Krippendorf, K. (2012), Content analysis; An introduction to its methodology, 3rd Edition, Thousand Oaks, CA: Sage.
La Rosa F., Liberatore G. (2014), ‘Biopharmaceutical and chemical firms’ R&D disclosure, and cost of equity: The impact of the regulatory regime’, European Management Journal, 32 (5), 806–820.
Laursen K., Salter A. (2014), ‘The paradox of openness. Appropriability, external search and collaboration’, Research Policy 43 (5), 867-878.
Lev B., Zarowin P. (1999), ‘The boundaries of financial reporting and how to extend them’, Journal of Accounting Research, 37 (2), 353-385.
Macia, L. (2015), ‘Using Clustering as a Tool: Mixed Methods in Qualitative Data Analysis,’ The Qualitative Report, 20 (7), 1083-1094. [Online], [Retrieved November 20, 2015], http://nsuworks.nova.edu/tqr/vol20/iss7/9
Mallinckrodt, (2014), ‘Annual Report,’ [Online], [Retrieved August 30, 2018] http://www.mallinckrodt.com/investors/annual-reports
Mazzi F., Slack R., Tsalavoutas I. and Tsoligkas F. (2019) ‘The Capitalization Debate: R&D expenditure, Disclosure Content and Quantity, and Stakeholder Views,’ Project Report. Association of Chartered Certified Accountants, London.
Medivir, (2014), ‘Annual Report,’ [Online], [Retrieved August 30, 2018] http://www.medivir.se/v5/en/ir_media/financial_reports.cfm
Merkley, KJ. (2014), ‘Narrative Disclosure and Earnings Performance: Evidence from R&D Disclosures,’ The Accounting Review, 89 (2), 725-757.
Moreno A., Casasola A. (2016), ‘A readability evolution of narratives in annual reports: A longitudinal study of two Spanish companies’, Journal of Business and Technical Communication, 30 (2), 202-235
Murtagh, F. and Contreras, P. (2012), ‘Methods of Hierarchical Clustering,’ Data Mining and Knowledge Discovery, 2 (1), 86–97.
Napoli, F. (2013), ‘Which Most Influences the Non-Financial Reporting of R&D Assets, Strategies or Shortcomings in Financial Accounting?’ [Online], [Retrieved January 20, 2017], http://www.aidea2013.it/docs/285_aidea2013_accounting.pdf
Nekhilli, M., Boubaker S. and Lakhal F. (2012), ‘Ownership Structure, Voluntary R&D Disclosure and Market Value of Firms: the French Case,’ International Journal of Business, 17 (2), 126-140.
Nekhili, M., Cheffi, W. and Hubert, T. (2015), ‘The Value Relevance of R&D Voluntary Disclosure: Evidence from Listed Companies in France,’ SSRN Electronic Journal, Working paper, DOI: 10.2139/ssrn.1534153
Orexo, (2014), ‘Annual Report,’ [Online], [Retrieved August 30, 2018] http://orexo.com/en/investors/financial-reports-presentations-and-audiocasts/
Pashalian S., Crissy W.E. (1952), ‘Corporate annual reports are difficult, dull reading, human interest value low, survey shows’, Journal of Accountancy, 94, 215–219.
Patelli, L. and Prencipe, A. (2007), ‘The Relationship between Voluntary Disclosure and Independent Directors in the Presence of a Dominant Shareholder,’ European Accounting Review, 16 (1), 5–33.
Prencipe, A. (2004), ‘Proprietary Costs and Voluntary Segment Disclosure: Evidence from Italian Listed Companies,’ European Accounting Review, 13 (2), 319-340.
Rasmussen, E. (1992), Clustering Algorithms, Information Retrieval: Data Structures and Algorithms, Prentice-Hall, Inc., Upper Saddle River:
Schroeder N., Gibson C. (1990), ‘Readability of management’s discussion and analysis’, Accounting Horizons, 4 (4), 78–87.
Smith M., Taffler R.J. (1992), ‘Readability and understandability: Different measures of the textual complexity of accounting narrative’, Accounting, Auditing and Accountability Journal, 5 (4), 84–98.
Soper F. J., Dolphin R. J. (1964), ‘Readability and corporate annual reports’, Accounting Review, 39 (2), 358–362.
Stallergenes, (2014), ‘Annual Report,’ [Online], [Retrieved August 30, 2018], http://www.stallergenesgreer.com/annual-report
Suchman, MC. (1995), ‘Managing Legitimacy: Strategy and Institutional Approaches,’ Academy of Management Review, 20 (3), 571–610.
Uniqure, (2014), ‘Annual Report,’ [Online], [Retrieved August 30, 2018] http://www.uniqure.com/investors-newsroom/sec-filings.php
Verrecchia, R. (1983), ‘Discretionary Disclosure,’ Journal of Accounting and Economics, 5 (1), 179-194.
Wagenhofer, A. (1990), ‘Voluntary Disclosure with a Strategic Opponent,’ Journal of Accounting and Economics, 12 (4), 341-363.