Volume 2021,
Article ID 536861,
Journal of Innovation and Business Best Practice,
17 pages,
DOI: 10.5171/2021.536861
Received date: 2 December 2020; Accepted date: 11 December 2020; Published date: 4 February 2021
Academic Editor: Oana Vlăduţ
Cite this Article as:
Dina DIGA and Irina SEVERIN (2021)," Key Life Test Process Optimization Using Six-Sigma Approach", Journal of Innovation & Business Best Practice, Vol. 2021 (2021), Article ID 536861, DOI: 10.5171/2021.536861
The progress of automotive companies has led to a broad development in all sectors of the automotive industry, having an impact on all processes of design, engineering, systems, prototyping, testing and validation. At the same time, consumers’ demand for durable products remains high. Desiring to accomplish and satisfy customer requirements, the testing team is in high demand for work and is under time pressure due to existing delays. The goal of this work is to optimize the key life testing process that is performed to help evaluate the life of the vehicle components. Test process optimization means identifying and fixing gaps. There are no defined rules for test process optimization and these vary from case to client. The paper proposes a model of predicted life of durability testing process that should interface to the total engineering process. The test engineering team, most of the time, at the beginning of a new project is limited by time and delays generated by other project teams, suppliers, production and other entities involved. This creates project-level pressure on deliverables that need to be delivered on time. Optimizing the testing process will help test engineers streamline their work and time using six sigma quality methods and tools. In this way all the proposed targets will be completed. The objective of the paper is to minimize delays in the testing process using six sigma techniques. Following the Pareto and Ishikawa analysis, a number of factors that generate the causes of the delays were identified. Improving the testing process consists in streamlining the available time and resources. As presented in the paper, the planning and flowchart of activities will structure the quality of work and improve customer satisfaction.
Keywords: key life test, durability test, six- sigma, customer satisfaction, life cycle, process optimization.
Introduction
In the component design and development process, testing validates the final product and helps prevent and resolve potential problems that could cause component malfunctions. All tests necessary to validate the product must be performed to provide confidence in all markets of the world and to avoid non-commercial vehicle.
A. Lund and K. H. Donaldson, Jr. (1982) said in their work that “the successful testing starts with a clear definition of the test objective. This allows the test engineer to “keep his eye on the ball”, so to speak. It is possible to categorize test objectives by taking an overview of the total design process”. The authors Stuart Lebowitz and Craig T. Hodorek, (1996), Ronald H. Salzman and Scott L. Ciemniecki, (1997), Andrew W. Bur, Peter P. Dierauer and Lamar F. Ricks, (2003), had similar ideas.
In this paper we applied the Six Sigma methodology for determining and measuring the optimization of the durability key life testing process on automotive testing laboratories.
In his work, Shashank Soni (2013) says that the “Six Sigma improves the process performance (process yield) of the critical operational process, leading to better utilization of resources, decreases variations and maintains consistent quality of the process output”. The authors Ravindra Mohan, Lokesh Bajpai and S K Katare support this theory.
According to P.N. Koch, R.-J. Yang & L. Gu, “design quality is measured with respect to probability of constraint satisfaction and sensitivity of performance objectives, both of which can be related to a design sigma level”. Similar ideas were adopted by the authors Shashank Soni (2013), A.K. Sahoo, M.K. Tiwari and A.R. Milehamc.
Optimizing the key life test creates better quality products that developed faster and cost less to produce. Achieving that optimization takes planning. Following the results, test process optimization will increase customer satisfaction.
Defining the test process through Six Sigma approach
This paper deals with the current situation of the durability testing laboratory within an automotive company, which requires optimization of the testing process. Based on the existing data on the quality and efficiency of testing, the important criteria for performing the test are:
Test planning:
Full list of stakeholders;
Sign off sheet completed and signed by all relevant stakeholders;
Complete list of part numbers and names;
Correct requirements and procedures and all agreed deviations.
Test monitoring and control:
The test is to be performed using the required design intent component system;
The component is to be tested in an environmental chamber;
A valid risk assessment must be in place before this test is conducted;
Test and measurement equipment must have up-to-date calibration and certification;
Test run according to the procedure.
Test process optimization:
Continuous improvement of the testing process;
Tracking each step and measuring quality using dedicated testing tools;
Delivery and execution of work projects of test components on time.
Validating the performance of the key life test and the durability of the components will be followed step by step in each stage of the test process. The aim of this test is to simulate the life of the components, through cycles performed at time intervals and over a determined period of time. The process will be described and evaluated according to customer requirements, in order to determine the test conditions and measurements needed to determine the failure, life and durability of components.
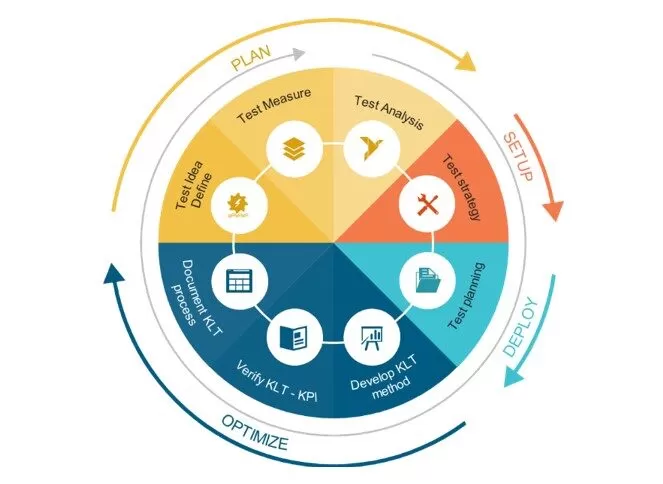
The use of six sigma will aim to determine the lifespan and durability of the components once the test results are obtained. The important steps of the testing process required for improvement are shown in Fig. 1.
Fig.1: Durability Optimization model (Legend: KLT key life test; KPI key performance indicators)
Comments on Results
Test Idea
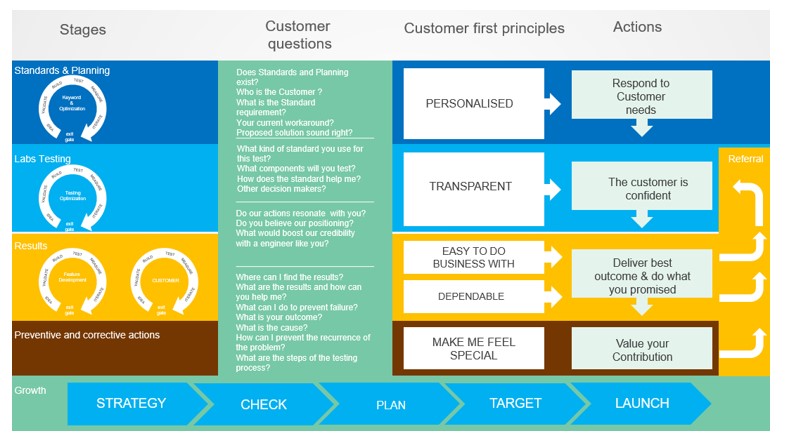
The idea of testing is determined by the idea of product or concept. A new product is developed and tested according to the test procedure requirements. Customer satisfaction is measured by its degree of reaction to new improvements to the product, the quality of services offered and results. To better understand customer needs, we need to answer their questions.
Fig. 2 below shows the ‘Customer first’ principle that should be followed in any test process step and at the same time their most frequently addressed questions.
Fig. 2: ‘Customer first’ principle
Each stage of planning aims to standardize the improvement and meet customer expectations. The new testing ideas aim to prevent and control the product effectively from the moment the idea is proposed to the management until the moment the product reaches the customer.
Test measure
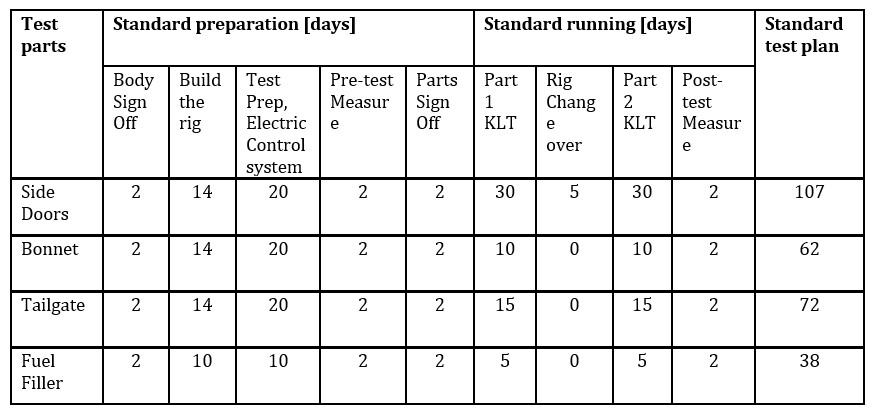
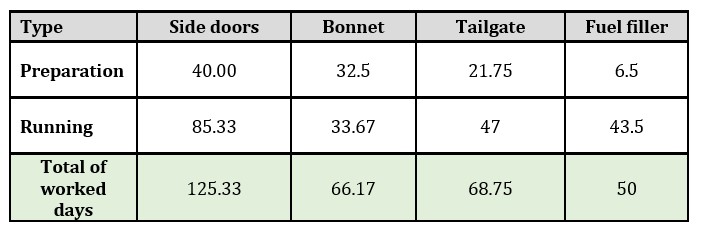
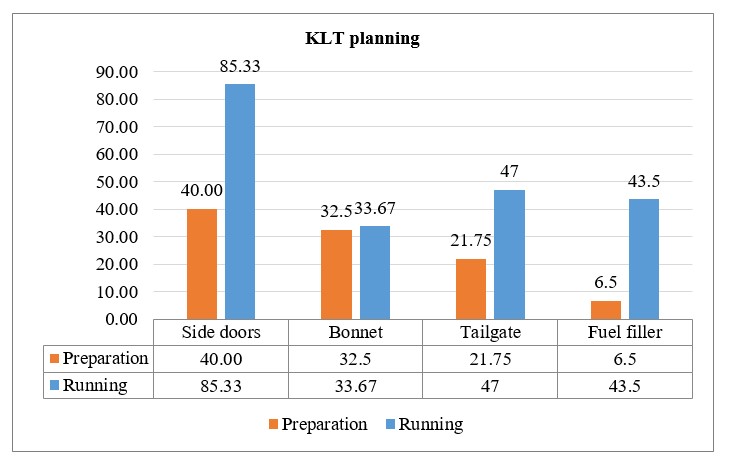
For each component specified (such as: side doors, bonnet, tailgate, fuel filler), it is necessary to use statistical criteria to compare the measured reliability during the test. It usually takes a considerable amount of testing time to run and evaluate the results, especially if one wants to evaluate the durability of a product. To accomplish this requires the comparison of output and input variables (test preparation and test running) in the laboratory. The tables below show the standardized time (days) and the feasible time that involves delays.
Table 1: Standard test plan
The test plan presented in Table 2 below shows the component testing delays compared with standard test plan. The causes of delays lead to several problems in determining the reasons for failures and how to eliminate them.
Table 2: Feasible test plan
The graph in Fig. 3 shows that the standard time of the test plan was not reached in any of the four tested components.
Fig. 3: KLT planning timing
Test Analysis
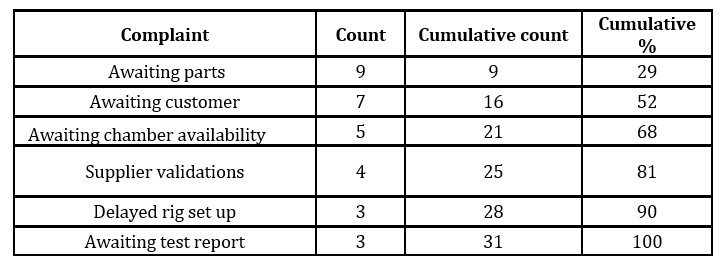
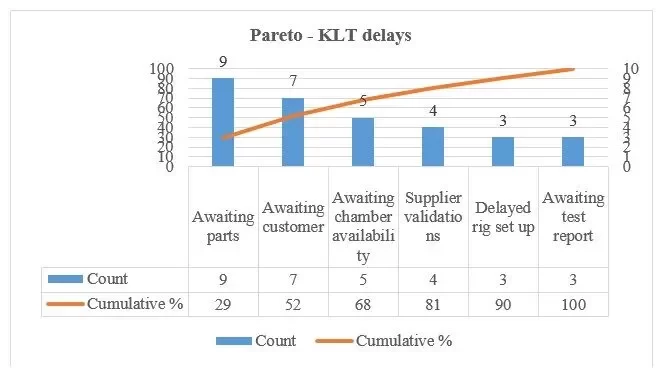
Following the tests performed, the delays and their causes were analyzed. Thus, possible causes were identified, as follows in Table 3:
Table 3: Pareto analysis
According to Pareto, the biggest impact in the identified delays was the first three causes (awaiting parts, customer and chamber availability), as seen in Fig.4.
Fig.4: Pareto – KLT delays
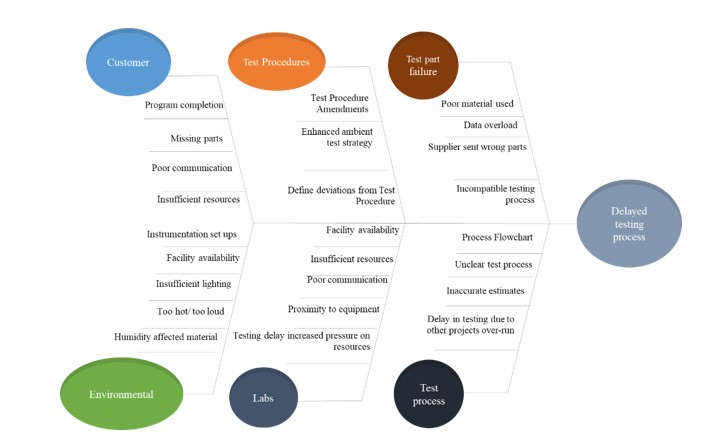
Analysis of causes and effects (Ishikawa), shown in Fig. 5, presents the problem and it can be seen that the tested components face serious problems due to delays caused by several factors.
Fig.5: Ishikawa – Delayed testing process
Failure modes can be measured using six sigma quality instruments such as Failure Mode and Effects Analysis (FMEA), Fault Tree Analysis (FTA) and Finite Element Analysis (FEA). The causes that generate the failure modes must be defined throughout the optimization process. In order to solve the process problems that cannot be managed by one method alone, we proposed a scenario to incorporate FMEA, FTA and FEA.
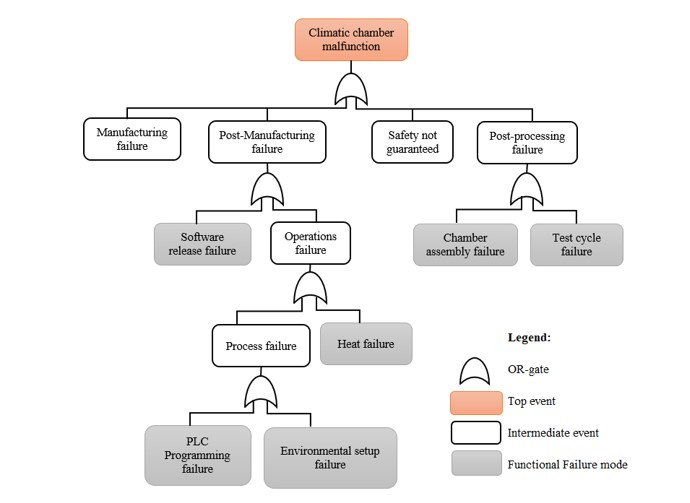
In the next step, the critical functional failure modes are analyzed using Fault Tree Analysis tool; in our case the problem is the malfunction of the climatic test chamber, the cause generated by Heat exposure, as shown in Fig.6.
Fig.6: Fault Tree Analysis identified the Climate chamber malfunction
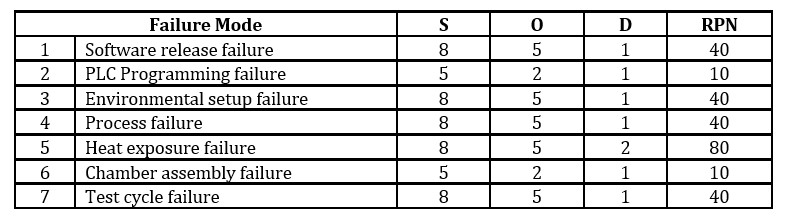
In Table 4, a Failure Mode and Effects Analysis is performed for the functional failure modes mentioned in the Fault Tree Analysis.
*A theoretical model already applied by Peeters J. F. W in ”Improving failure analysis efficiency by combining FTA and FMEA in a recursive manner”.
The results of the analysis provide us with important information about the critical failures of the process. There are 7 failure modes, 1 has an RPN (Risk Priority Number) of 80 (having the highest impact), 4 an RPN of 40 and 2 an RPN of 10. The first 5 failure modes will be analyzed in more detail.
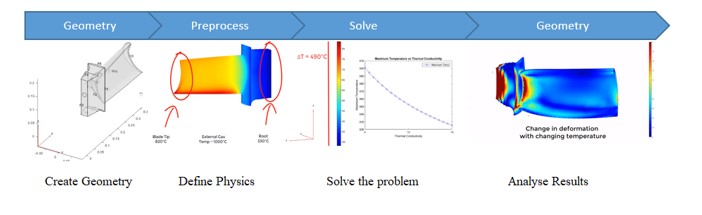
Finite element analysis (FEA) is performed to detect possible problems related to the functionality of the product that is subjected to heat exposure. In the next section, Fig. 7 presents the results of the Finite Element Analysis on the Heat Transfer example, using a typical FEA workflow in MATLAB.
Fig.7: Finite Element Analysis Demo [https://www.mathworks.com/videos/finite-element-analysis-in-matlab-part-2-heat-transfer-using-finite-element-method-in-matlab-1600851714895.html]
In this example, the limit conditions are defined by the heat transfer between the surrounding gases and the faces of the blade. The simulation of the real conditions on the part is performed through MATLAB that allows to locate potential problems, including areas of tension and weaknesses. FEA analysis results, give confidence in the heat exposure and testing of the components in the climate chamber.
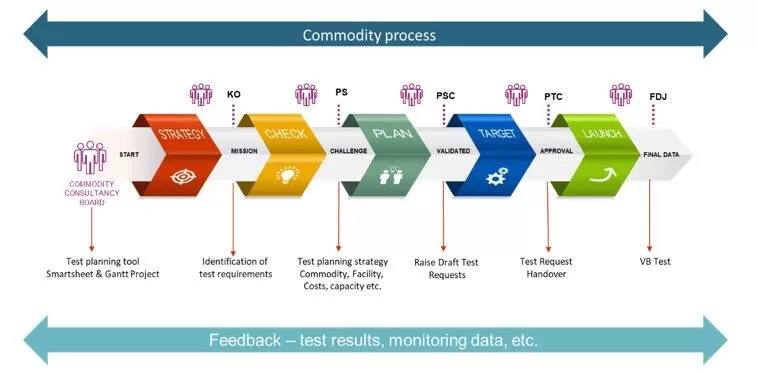
Test strategy
The testing strategy aims to identify the capabilities and time planned for each activity in the testing process. Having a well-developed strategy, a detailed qualitative analysis can be ensured, following the six sigma instruments, a series of defects can be detected. By reducing the recurrence of component failure, the risks and costs will be lower. Each phase of the strategy is defined and organized in a logical form, providing a high degree of confidence in the overall testing strategy.
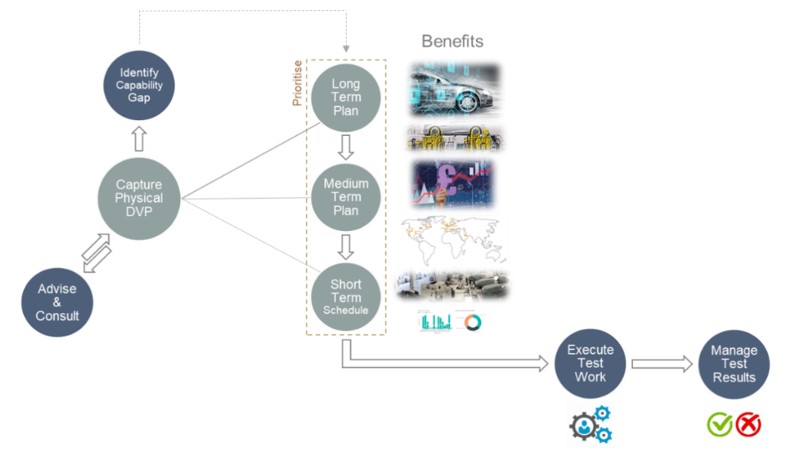
Fig. 8: Process strategy
As shown in Fig.8, the steps for implementing the testing strategy are by capturing the Physical Design Verification Plan (DVP) which is used to ensure and verify that the requirements and specifications of the product are met during the process.
Test planning
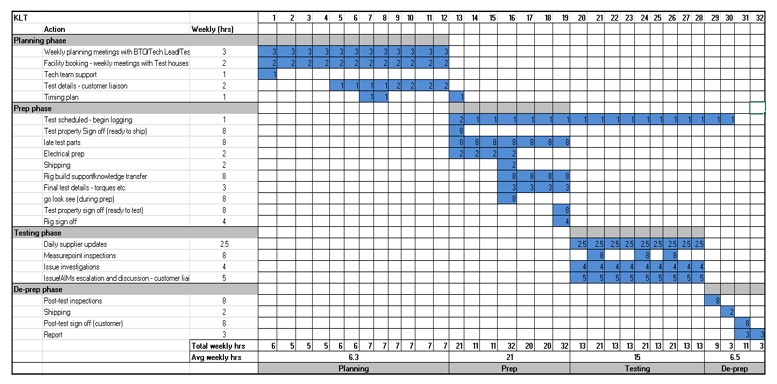
At the beginning of the project, will be made detailed planning of all activities that define product and customer requirements, according to testing process and testing procedure. The planning team should keep a close relationship with the design team, test team and suppliers Planning the activities of the testing process and the necessary resources is shown in Fig.9.
Fig. 9: Test planning
Test milestones and quality tools used to support test activities described above are presented in Fig.10.
During the testing process, a series of stages can be followed, starting with the planning stage, the test preparation stage, the test run stage in the climate chamber and the final inspection stage. Each activity requires the following: test planning tools, test procedures and requirements, test facility and climate chamber, test capacity and costs, software and hardware testing, test equipment, testing team and a well-defined process.
Fuel Filler Key life Test method
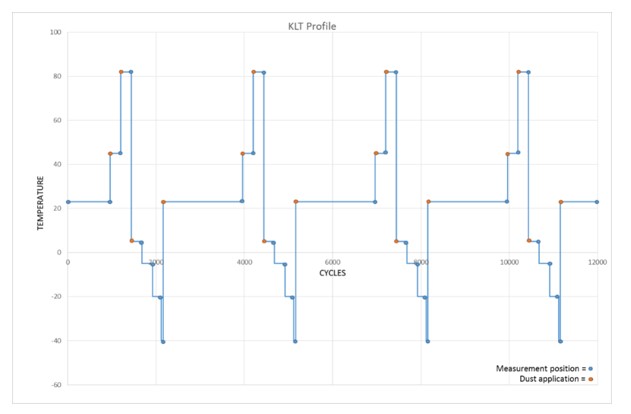
The Fuel Filler test procedure must be well detailed, with the specified test conditions, measurements required and possible defects defined. In order to perform the test, the temperature profile of the test chamber must be set according to the program required by the procedure.
The method is presented: The section of the vehicle body together with the fuel filler shall be firmly mounted in the test installation, which shall be placed in an environmental chamber. Mounted on the platform will be three pneumatic cylinders. These will be controlled by a PLC (Programmable logic controller) that will simulate the cylinders in the correct order. Two sensors, a small simple switch and a non-contact light sensor will also be used. The micro switch will detect that the fuel filler door is fully open – the light sensor that the door is closed.
As an example, the Test procedure for Fuel Filler Key Life Test is presented. This procedure is to define the Fuel Filler Key Life Test (KLT) procedure for all new model programmed vehicles. The Fuel Filler is to perform a total of 12,000 cycles, with formal Measure Points (MP) identified in Fig. 11.
The reporting criteria set out in this document allow for the severity of a particular failure to be categorized and reacted to accordingly. When a change is made to the new vehicle components or in (PVT) Production Verification Test plan, the change must be evaluated together with the DFMEA analysis (design failure mode and effect analysis), resulting in the signing of the approval to start the test, taking into account the following:
Surrogate data
Computer-aided engineering (CAE) evaluation
Local or Outsource rig/bucks to KLT test specification
Supplier testing to KLT test specification
*Dust application or Arizona dust (SAE J726 – saturated salt-water solution) is required for ingress testing. Ingress protection testing helps determine whether Fuel Filler will function properly throughout the lifetime of the vehicle. Prepare a salt/grit solution consisting of 1 level teaspoon Arizona coarse dust 237 ml ± 5 ml saturated salt-water solution, and 237 ml ± 5 ml fresh tap water. Arizona salt solution is applied to the outside of Fuel Filler door margins while in closed position, left for 30 minutes before performing the test cycles.
Fig. 11: Durability Test Fuel Filler Measure Point
This test method is used to evaluate material component performance after 12.000 cycles of heat exposure and is intended to assess the dimensional properties of the materials/components under test. The running time of the test is standard as shown in Table 1, i.e. 10 days. Often, during the test, the component is damaged and the problem must be inspected, the running time increases.
Verify Key Life Test – Key performance indicators
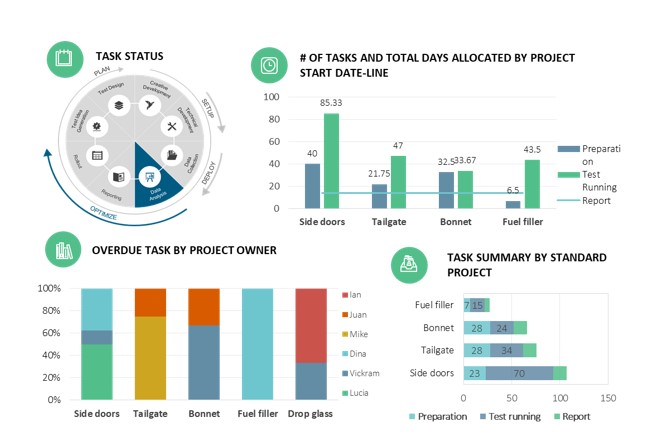
Once the testing has been performed, the test data obtained will be analyzed to determine the final results. The results of the testing team, key life tests and components will be presented in dashboard form. It should be known that equipping the testing team with tools and technologies, along with most testers, can increase resources for testing activities, but does not optimize the efficiency of the process. Thus, KPIs show their usefulness and importance in measuring process efficiency and, as a result, make improvements to optimize the process.
There are various key performance indicators (KPI) that are considered in order to improve the process, as shown in Fig.12.
Fig.12: Durability Testing – KPI
The tests were performed by the test engineers presented in the graph and their results are presented in the form of KPIs.
Document Durability Key Life Test process
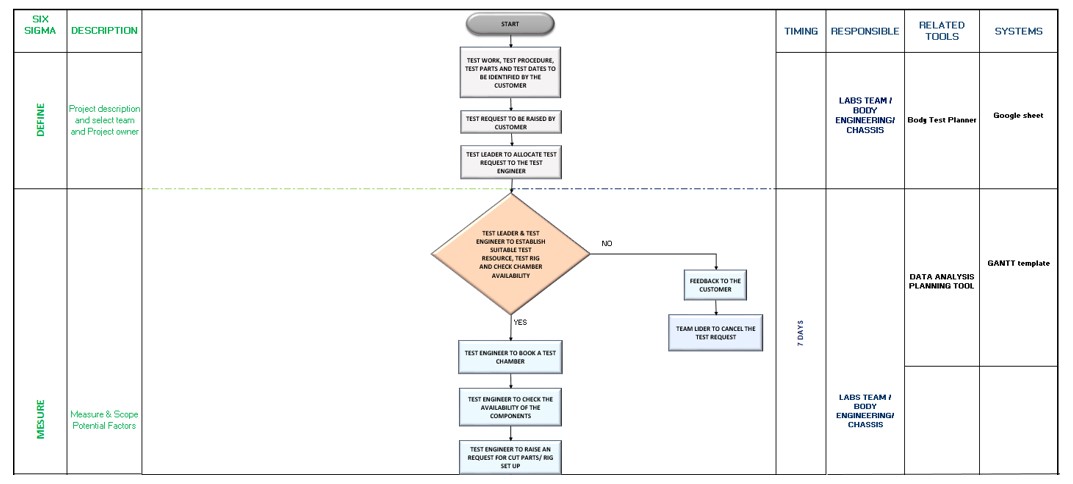
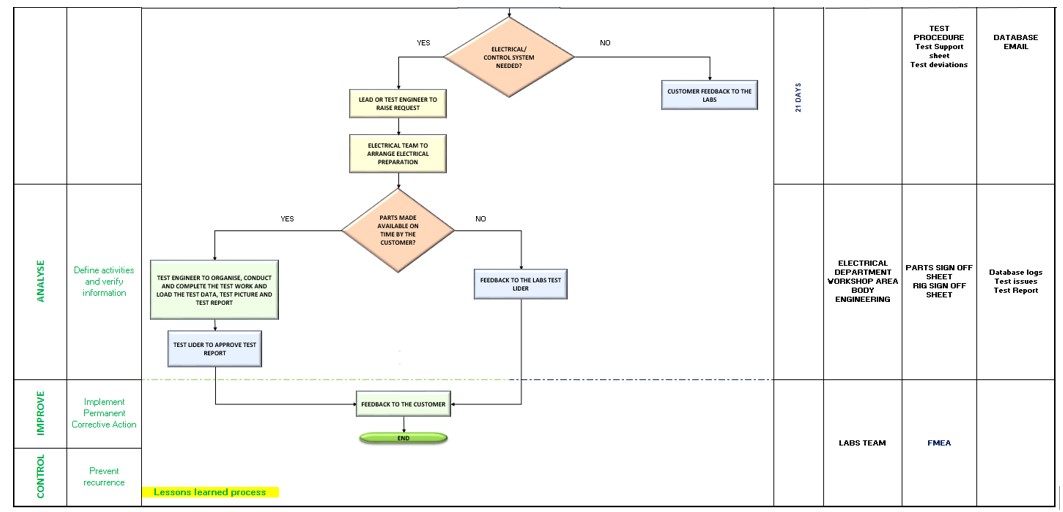
Optimizing the testing process requires good documentation and recording of test information. Thus, all testing activities, stockholders, programs and databases, testing methods and procedures will be presented in the form of a flowchart, as shown in Fig.13, in this way each stage will be organized and managed. All documentation must be kept in a database for use by engineering, planning, quality teams, suppliers and all parties involved in product development.
In order to optimize the process, a Flowchart was implemented using six sigma method.
Figure 13: Process Flowchart
The planning of the activities was improved due to the fact that the testing process was detailed and organized in a logical form. It gives the confidence that by following each step of the process we will reduce the degree of component failure and we will improve the durability life test time.
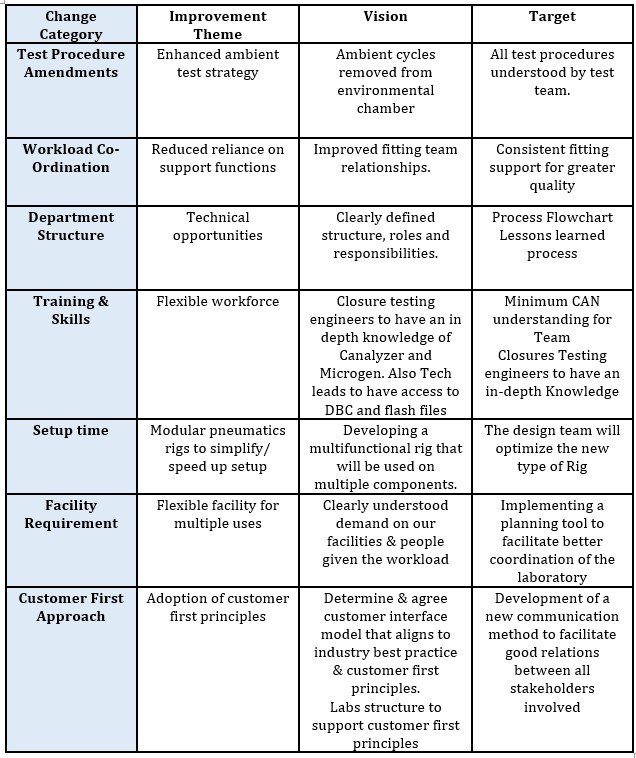
Following the results, ideas for improvement were searched and durability key life test optimization plan was proposed (Table 5):
Table 5: Optimization Plan
All the considerable results of the testing process were represented in Table 5, the improvement theme, vision and target can be observed. Redefining the durability process of the key life test and improving it will streamline the optimization of the testing laboratory.
Conclusions
The paper presents the stages of the testing process and the advantages of its optimization. Following these aspects, we will conclude with the following:
An optimization study was conducted for durability key life process in the automotive industry, which took into account the lack of resources, flawed processes and implementation of the best practices.
The use of six sigma techniques in the testing process helps to achieve the objectives regarding the testing method, test planning and test strategy highly critical.
The study is a theoretical model that aims to optimize the testing process in Component and Subsystem Test Laboratories.
The testing strategy should streamline each stage of the testing process to prevent possible failure mode. The testing process is divided into several stages such as: the test planning stage, the test preparation stage, the test running stage and the final inspection.
Actions to improve the testing process are established once the activities have been detailed and the results evaluated using the six sigma techniques and presented as corrective actions in the optimization table above. Improving the testing process will be possible gradually, using effective quality control.
A formalized flow chart is proposed, the approach being applicable for different industries, some being already reported [Nae I. a.o, Lascu E. a.o., Vizireanu E. a.o., Severin I. a.o., Mitrache I. a.o., Stinga F. a.o.].
Acknowledgement
“This work has been funded by the European Social Fund from the Sectoral Operational Programme Human Capital 2014-2020, through the Financial Agreement with the title “Scholarships for entrepreneurial education among doctoral students and postdoctoral researchers (Be Antreprenor!)”, Contract no. 51680/09.07.2019 – SMIS code: 124539″.
A. Lund and K. H. Donaldson Jr (1982), ”Approaches to Vehicle Dynamics and Durability Testing” SAE Transactions, Vol. 91, Section 1: 820003–820283, pp. 289-298, [Online]. Published by: SAE International. Accessed: 09-11-2020 15:34 UTC. https://www.jstor.org/stable/44631946
Ronald H. Salzman and Scott L. Ciemniecki, (1997) ”Reliability Predictions Using Probabilistic Methods and Key Life Testing”, SAE Transactions, Vol.106, Section 1: Journal of Aerospace, [Online] pp.1169-1178. https://www.jstor.org/stable/44650503
Stuart Lebowitz and Craig T. Hodorek, (1996) ”Testing to Ensure the Achievement of Corporate Goals for Customer Satisfaction”, SAE Transactions, Vol. 105, Section 5: Journal of Materials & Manufacturing, [Online] pp. 920-932. https://www.jstor.org/stable/44734121
Andrew W. Bur, Peter P. Dierauer and Lamar F. Ricks, (2003) ”Honeywell’s Automotive Door Latch Design is Ideal for Corporate Latch Strategy”, SAE Transactions, Vol. 112, Section 5: Journal of Materials & Manufacturing, [Online] pp. 683-688. https://www.jstor.org/stable/44699631
Shashank Soni*, Ravindra Mohan, Lokesh Bajpai and S K Katare (2013), ”Reduction of welding defects using six sigma techniques”, International Journal of Mechanical Engineering and Robotics Research India. ISSN 2278 – 0149 www.ijmerr.comVol. 2, No. 3, July 2013.
Dina Bantea, (2018) ”Environmental Durability Side doors Key Life Test Report”, Structural Test Laboratories.
IATF 16949: 2016, ”Quality management system for organizations in the automotive industry”, ISO 2016.
ISO/IEC 17025:2017 ”General requirements for the competence of testing and calibration laboratories”.
ISO 9001:2008 and 2015, ”Quality management systems. Requirements”, ISO, 2015.
ISO 9004:2018 and 2010, ”Quality management – Quality of an organization – Guidance to achieve a sustained success”, ISO, 2018
Alexandru, I. M. (2008). ”Six Sigma approach: interpretations, controversies, procedures”. Economic Publishing House, Bucharest
Kifor C. (2006). ”Quality Engineering – 6 Sigma improvement”. Lucian Blaga University Publishing House, Sibiu
Nae I. and Severin I., (2018), ”Performance management model for third party logistics companies”, UPB Scientific Bulletin, Series D: Mechanical Engineering 80 (4), 279-286.
Lascu E., Mitrache IA., Stinga F. and Severin I. (2020), ”Customer satisfaction improvement using six sigma automotive service”, Proceedings of the 35th International Business Information Management Association Conference, Seville, 1-2, pp 10133-10144.
Vizireanu E., Severin I. (2016), ”KPI Correlation in Industrial Engineering: A Case Study”, 2nd Int. Conf. on Humanity & Social Science (ICHSS 2016), DEStech Publications, 189-193.
Severin I, Ilinca M.F., Dumitru B., Caramihai M. (2018), ”Productivity increase through carousel posts balance for engine wiring fabrication: A Business Process Reengineering”, Case Study, Proc. 32nd IBIMA, Seville, pp 1420-1431.
Mitrache, I.A., Stinga, F. and Severin, I. (2020), ”Continuous improvement in practice within oil and gas industry”, Quality Access to Success, vol. 21, nr. 175, pp. 52-58. [Online], Publisher Romanian Society for Quality Assurance, [Retrieved February 8, 2020], https://www.srac.ro/calitatea/en/arhiva/2020/QAS_Vol.21_No.175_Apr.2020.pdf
Lascu E., Lascu F.D., Stinga F., Severin I. (2020), ”Process redesign to reduce stocks of obsolete parts in automotive industry”, Quality Access to Success, vol. 21, nr. 178, pp. 43-49, Publisher Romanian Society for Quality Assurance
Stinga F., Severin I., Mitrache I. (2020), Lascu E., ”Redesign of the curing area of the tire manufacturing process”, Sustainability, Vol. 12, Issue 17, 6909, MDPI
Peeters, J. F. W., Basten, R. J. I., & Tinga, T. (2017). ”Improving failure analysis efficiency by combining FTA and FMEA in a recursive manner”. (BETA publication: working papers; Vol. 528). Technische Universiteit Eindhoven.