Czech Technical University in Prague, Prague, Czech Republic
Volume 2025,
Article ID 688574,
Journal of Innovation and Business Best Practice,
13 pages,
DOI: https://doi.org/10.5171/2025.688574
Received date: 2 October 2023; Accepted date: 25 October 2024; Published date: 6 March 2025
Academic Editor: Piotr Walentynowicz
Cite this Article as:
Vaclav Michalec (2025)," Leveraging Simulation as a Tool for Lean Manufacturing Process Improvement: Case Study ", Journal of Innovation & Business Best Practice, Vol. 2025 (2025), Article ID 688574, DOI:10.5171/2025.688574
This study investigates the integration of simulation techniques within the Lean Manufacturing framework, focusing on its potential to enhance decision-making and operational efficiency. By examining a real-world case study of a specific production line, this research demonstrates the value of simulation as a complementary tool in Lean Manufacturing. Addressing a gap in existing literature, this study contributes to an evolving body of knowledge that bridges Lean methodologies with simulation-driven insights. Key findings indicate that simulation can significantly support decision-making processes and boost operational performance within manufacturing. The paper concludes with an evaluation of the benefits and limitations of simulation as a core Lean tool, highlighting its transformative impact on production efficiency and strategic decision-making in the studied context.
Keywords: simulation, lean, lean manufacturing
Introduction
In today’s fast-paced industrial environment, the drive for efficiency, waste reduction, and continuous improvement has led manufacturers to adopt innovative methodologies that optimize their manufacturing processes. Among these methodologies, Lean Manufacturing, Six Sigma, or in combination Lean Six Sigma stands out as the cornerstone of a philosophy that seeks to eliminate non-value-added activities while maximizing value creation. At the heart of lean manufacturing lies a commitment to deliver superior products with minimal waste, reduced lead times, and increased customer satisfaction through maximizing value creation. To achieve these goals, companies are increasingly turning to simulation techniques as a powerful tool in lean manufacturing. This paper explores the connection between lean manufacturing tools and simulation techniques and highlights the integration of dynamic modeling as a powerful tool to visualize, analyze, and design optimization of manufacturing processes. By simulating real-life scenarios in a virtual environment, manufacturers can experiment with process modifications, analyze the results, and verify improvements before actual implementation in small enterprises.
The article is organized into two main parts, the first of which focuses on the basic concepts of lean manufacturing and describes its advantages and challenges together with simulation technologies and the possible application to modeling production processes and predicting their performance. The second part describes a case study in a real manufacturing company with an example of successful integration and use. The article concludes by summarizing the key findings and highlighting the prospects of this dynamic collaboration between lean manufacturing and simulation.
Literature Bases of the Studied Phenomenon
Lean manufacturing, often referred to as lean, is a systematic approach to manufacturing that originates from Japan’s Toyota Production System (TPS). At its core, lean manufacturing is focused on eliminating waste in all forms throughout the manufacturing process. Waste includes activities that do not add value to the final product, such as overproduction, waiting, unnecessary transportation, excess inventory, and defects. (Womack, 1996) Lean focuses on streamlining processes, maximizing value-added activities, and optimizing the use of resources. The methodology emphasizes continuous improvement, employee participation, and a customer-orientated approach to production. (Liker, 2004a) Implementing lean manufacturing principles offers organizations several benefits. One of the key benefits is improved operational efficiency achieved precisely through the elimination of activities that do not create value. This leads to shorter delivery times, lower production costs, and improved product quality. Lean practices also contribute to increased flexibility and responsiveness, allowing companies to quickly adapt to changing market demands. (Shah, 2003) One of the main benefits is employee involvement, which is another critical aspect because lean promotes a culture of continuous improvement and enables front-line workers to identify and solve problems. In addition, lean practices promote better use of resources, reducing excess inventory, and freeing up capital to invest in innovation and growth. (Jasti, 2014)
Although lean manufacturing offers several advantages, its successful implementation is not without challenges. One of the significant obstacles is the cultural change that is required in organisations in order for both company management and all other employees to adopt the principles and practices of lean manufacturing. Changing established work practices and mindsets can be met with resistance from both employees and management. (Ferdows, 1997) In addition, accurate identification and elimination of waste require a comprehensive understanding of processes that can be time-consuming and complex. Additionally, finding the right balance between, for example, reducing inventory levels and meeting customer demand can be difficult, and a company’s reliance on standardized processes may not always align smoothly with changing product requirements and customer needs. (Liker, 2004b)
Regarding simulation, it is a powerful technique used in various industries, including manufacturing, especially for modeling and analyzing real systems in a virtual environment. It involves creating a computer representation of the system that mimics its behavior over time. This allows manufacturers to experiment with different scenarios and variables without affecting actual operations. (Nelson, 2000) Techniques such as discrete event simulation, system dynamics, and agent-based modeling are commonly used to simulate manufacturing processes. For example, discrete event simulation focusses on modeling events that occur at different points in time, such as machine breakdowns or material arrivals. The dynamics of the system, on the other hand, capture the relationships between different components of a system to understand how changes affect the behavior of the entire system. (Sterman, 2000) Agent-based modeling involves representing individual entities in a system as autonomous agents that interact with each other. From the point of view of the possible application of simulation techniques in production processes, several advantages are offered. One of the key benefits is the ability to visualize complex systems and processes, allowing manufacturers to gain insight into how different components interact and affect the overall performance. (Pidd, 2004) The simulation also facilitates the testing of various “what if” scenarios and helps identify potential bottlenecks, resource constraints, and areas for improvement before implementing changes in the real world. In addition, simulation helps to optimize production schedules, minimize cycle times, and improve resource allocation with support data-driven decision-making by providing quantifiable results and allowing the assessment of long-term impacts. (Robinson, 2012)
Despite its advantages, simulation is not without its challenges when applied in manufacturing contexts. Building an accurate simulation model requires a deep understanding of the processes, systems, and variables involved, which can be time-consuming and resource-intensive. (Banks, 1998) Ensuring that a simulation model matches real-world observations requires rigorous validation and calibration. Furthermore, data availability and quality are critical, as inaccurate or incomplete data can lead to unreliable simulation results. Interpreting the simulation results also requires experience, as complex models can yield complex insights that require careful analysis. Finally, choosing the appropriate simulation technique and software can be challenging due to the variety of options available and their different capabilities. (Elsayed, 2008)
In terms of integrating simulation into manufacturing processes, modeling has the potential to revolutionize the way operations are managed. By simulating processes in a virtual environment, manufacturers can experiment with new layouts, technologies, and workflows without disrupting ongoing production. This helps to optimize resource usage, minimize downtime, and predict the impact of changes on the overall performance. (ElMaraghy, 2005) Simulation also facilitates the identification of production bottlenecks and enables proactive strategies to address them. Furthermore, the simulation serves as a platform for workforce training and evaluation of the impact of changes on employee work practices. The integration of simulation aligns with lean manufacturing’s emphasis on continuous improvement and enables manufacturers to make informed decisions that increase operational efficiency and competitiveness. (Gunasekaran, 2016)
Case Study
The study describes a project focusing on the design of measurement, analysis and optimization of the production process using lean manufacturing and modeling tools. The project took place at the turn of 2022 and 2023 in a medium-sized engineering company dealing with the development, production, and assembly of containers of various volumes and designs. The company employs approximately 350 people and according to the EU definitions can be considered as a small-large enterprise.
Company Introduction
During its history, the company has offered a wide range of products; currently, it is focusing on the production of waste containers and barrels. The company strives to fully meet customer requirements, which is why its product portfolio is very diverse. To use the free capacity of the machines, the company also provides pressing, machining, metal stamping, painting, and material division services.
Currently, my company has four divisions, two of which are manufacturing. These divisions produce different products, have their customers, suppliers, and locations, and each division is managed by its own director. Both production divisions are responsible for their own activities in the area of supply, production, trade, and cooperation with other divisions. The other two divisions are nonmanufacturing. One of them is the company management division, which is led by the CEO and provides accounting, financial management, planning, information system maintenance, human resources, and other aspects such as ecology.
The company focuses on the B2B and B2C markets. Products are distributed throughout Europe and Asia. The company sells its products through subsidiaries and representatives in more than 25 countries. In the Czech Republic, the company is one of the main customers of cities and municipalities.
The technological process takes place as follows: Parts such as casings, pipes, container bottoms, or pockets are first created from the purchased material. These parts are then assembled into subassemblies (e.g. container body, lid, etc.), which undergo a galvanizing surface treatment. This process is carried out by an external supplier, which is located in the southern part of the building. If painting is required, the products are moved to the painting line in the southern part of the company building. After the surface treatments have been finished, the containers go through a cleaning and inspection process and are then assembled in one of the assembly halls. After assembly, the containers are stored and then shipped.
Step 1: Define
During the meeting with the company’s management and the head of technical production preparation, the entire area of the division was familiarised and then the expected output of the work was determined. The general goal of the company was to conduct a study of a specific center that specializes primarily in bulk containers and to propose possible automation of laser, die cutting, and press braking. The company mentioned that it is willing to invest in a new folding machine and that it would be possible to adjust the layout of individual workplaces as needed.
The creation of the study and the proposal were based on current company data, and the DMAIC approach was used in the creation of the study, where the information provided by the company served as input. In particular, these were structured parts’ lists containing production procedures, but also the actual observation in production and other information provided from interviews with the employees of the given workplaces, as well as with the company’s management.
During the definition, it was found that one of the complications would be a large number of workplaces, each of which was marked with its number, and, at the same time, uniform descriptions of the operations performed at these workplaces were not precisely defined and differed depending on the type of product. For this reason, it was necessary to transform the data to obtain the desired results. For this purpose, the MS Excel program was used, which made it possible to filter the necessary information using pivot tables.
When choosing the appropriate approach to the study, three approaches were taken into account, which enabled a comprehensive understanding of the organizational structure of production.
The first approach focused on a selected product or a group of products. The implementation of this approach involved identifying the product that is produced the most frequently and optimizing product flow. The second approach focused on the production work environment through which the selected products pass. Workplaces are divided into groups according to the types of operations carried out in them. Then it focuses on identifying the busiest workplace and uncovering its problem areas to optimize material flow and movement within the center, with a planned contribution to reducing the time consumption of the production process. The third approach was a combination of the two previous principles, and this approach enabled a comprehensive view of the production system.
Step 2: Measure
The next step was to understand the given operation with a primary focus on the workplace designated by the company (2840), i.e. the workplace of the laser, die cut, and press brake using the established steps from the previous chapter.
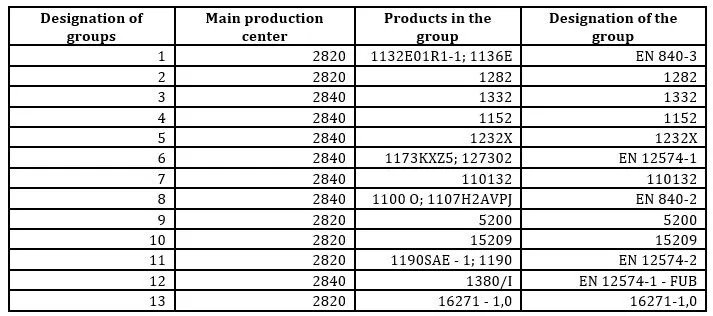
The data supplied by the company contained the company’s entire product portfolio with the production groups that the company produces most often. From the production procedures, it was complicated to determine exactly which product family a specific product belongs to, and therefore for the next procedure it was necessary to group the products based on their similarity in the sequence of production activities and the international standards EN 840 – 2, EN 840 – 3 and EN 12574, EN 12574 – 1, see the table below.
Determination of Product Groups
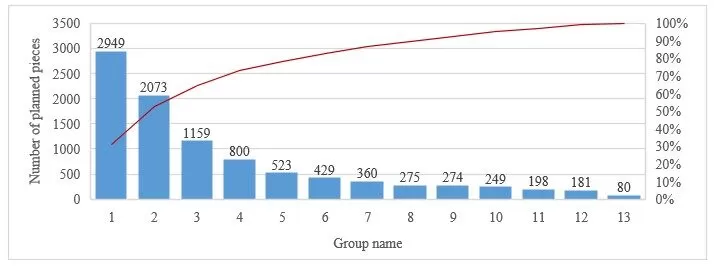
Furthermore, the interest groups of the products were determined according to the established criterion, which in this case was the quantity of pieces in the production plan. For this, the Pareto diagram with the corresponding Lorenz curve was used, where the individual columns on this diagram show the quantity of products and the cumulative frequencies of these quantities serve as the basis for creating the Lorenz curve.
Table 1: Division of products into groups
From the Pareto diagram, it is clear that 80% of all investigated groups are groups 1, 2, 3, 4, 5, 6. These groups are the most numerous, and by focusing on improving production in these groups, a significant overall improvement can be achieved.
Fig 1. Pareto diagram of product groups
After determining product groups based on the similarity of the sequence of production activities, it was found that 80% of all investigated groups are groups 1, 2, 3, 4, 5, and 6. However, the production process of groups 1 and 2 takes place primarily in center 2820, but the interest of the company is directed to center 2840. For this reason, these two most numerous groups were not considered, and, for the next steps, attention will be focused on group 3, in which the product with the designation 1332 is located.
Production sites
From the previous chapter, the second step was to focus on the workplace of the company, through which the groups of products from the previous analysis go through, together with focusing on the criterion of workload according to the time requirement.
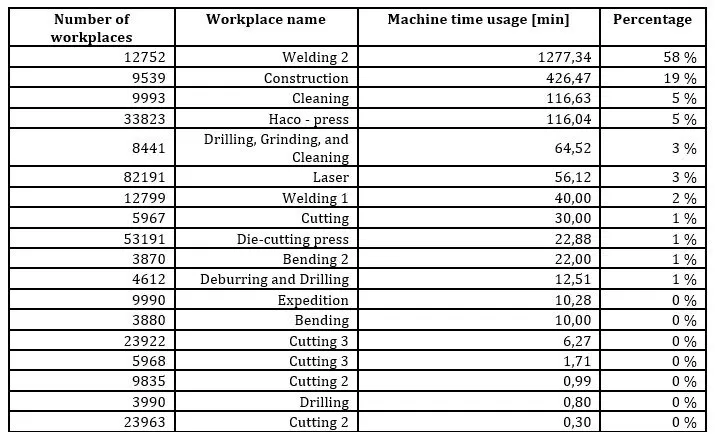
Table 2: Workplace 2840 Use
As a result of this analysis, with the help of a structured bill of materials, it was then possible to determine the time workload of individual workplaces, i.e. the workplaces of the laser, die-cutting, and press brakes. By determining the workload of the workplace, we found that products spend approximately 9% of the total production time in this section of production.
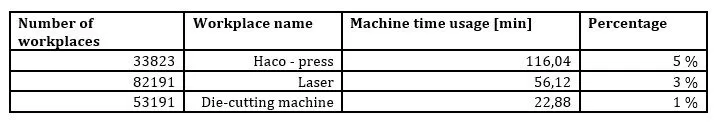
Table 3: Employment of Workplaces
It is already evident from these results that sheet bending, which takes place on the Haco press brake, is considerably more time-consuming compared to the workplaces of the laser and die-cutting press. We will provide a more detailed description of these workplaces in the next part of the work. Subsequently, this overall result was used in the following steps to create and verify the correct functioning of the simulation model of the production process.
Material flow mapping
In addition to analyzing the products themselves, planned production, and bill of materials, an integral part was also a real visit to understand and understand the individual activities, as well as the flow of material and semi-finished products. Lean manufacturing tools such as the Sankey diagram and the Spaghetti diagram were used for this part.
In terms of material flow, most of the numerous groups defined in the previous section pass through the selected workplace, especially groups 3, 4, 5, and 6. The equipment in the room is located according to the order of production operations of the products that pass through this room.
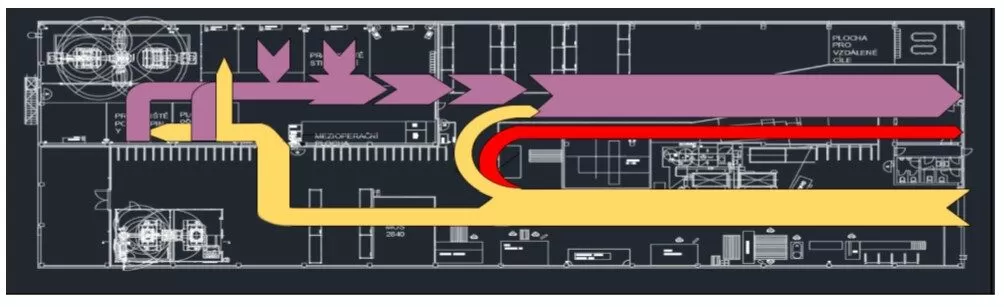
The mass flow in the hall is arranged in a U-shape, see the Sankey diagram that was used to graphically represent this flow. The width of the bar on the diagram represents the amount of material that passes through the hall. The diagram shows the parts that enter welding in yellow, the welded parts in purple, and the waste generated during processing in red.
Fig 2. Sankey material flow diagram
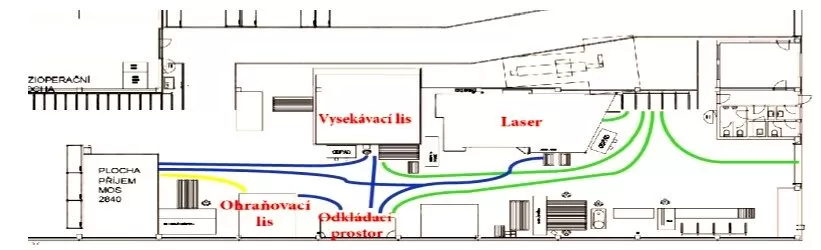
The movement inside the hall is shown on the Spaghetti diagram, where only the part of interest is shown, i.e. from the intermediate warehouse before the laser to the intermediate warehouse of bent and cut sheets, which are further welded.
Fig 3. Spaghetti diagram of material flow
Material is transported to the hall on pallets using handling equipment and placed in an intermediate warehouse. From there, the material is taken to the working chamber of the laser and die-cutting press. Some pallets with material that does not require punching and dividing operations go immediately to the storage area for bending (these material movements are marked with a green curve). Once the operation on the laser and die-cutting press is completed, the work-in-progress parts that do not require bending are moved to the intermediate operation area. If the parts need to be bent, they are moved to the bending storage area, from where they are moved to the press brake workplace (indicated by the blue curve). After the bending is completed, the parts are moved to the intermediate warehouse, where they are subsequently welded at the next workplace (indicated by the yellow curve).
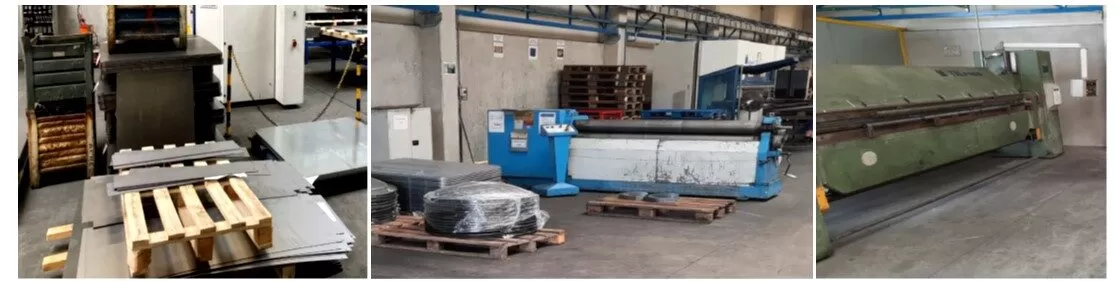
One of the other advantages of visiting and processing the Sankey and Spaghetti diagram was the possibility of real operation, and thus also possible deficiencies occurring at the given workplace. These were mainly pallets with production in progress without any structure of sorting and with several unused machines.
Fig 4. Unused machinery and unorganized material
Modelling
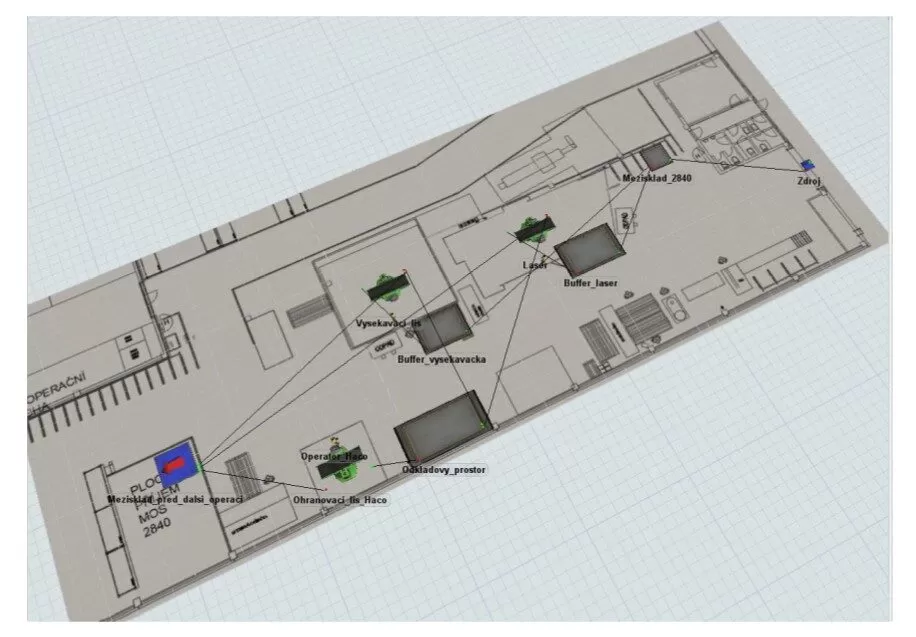
The key part of this step was the creation of a simulation model of the production process, which aimed to provide the functioning of production during the fulfillment of current orders and at the same time serve as a verification of the results of the measurement step. The production process supplied by the company was used to create the simulation model and the layout drawing of the workplaces,
which was supplied by the company together with other data, was used to make the model more realistic. The FlexSim program was used to create the simulation model. Where FlexSim is one of the easy-to-use modeling and simulation software tools that allows users to construct a three-dimensional computer simulation model of a real-life system and run experiments on the model.
Fig 5. Simulation model of the production process
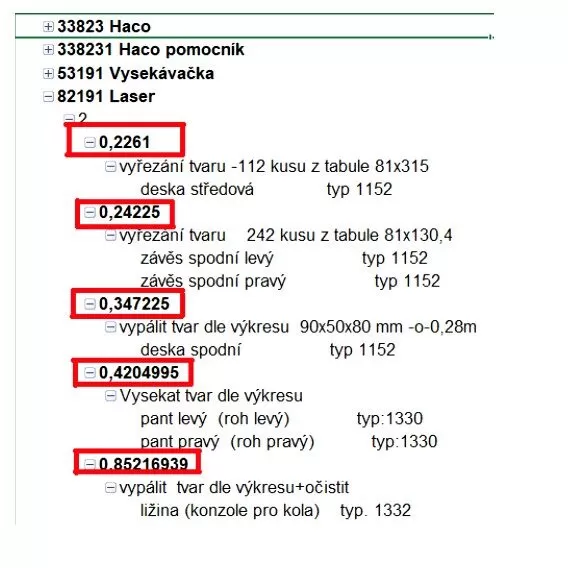
To create the model, it was first necessary to determine the process times of the individual workplaces. These process times were determined using the structured parts’ list of Product 1332. A certain complication was that the structured parts’ list contained a lot of data and information, and, for this reason, it was necessary to modify these data into a suitable contingency table with the help of filters; for the necessary data, it was possible to obtain the times of individual operations from which average times of individual workplaces were created; see the red frames in the image below.
Fig 6. Editing and Filtration of Data to Create a Model
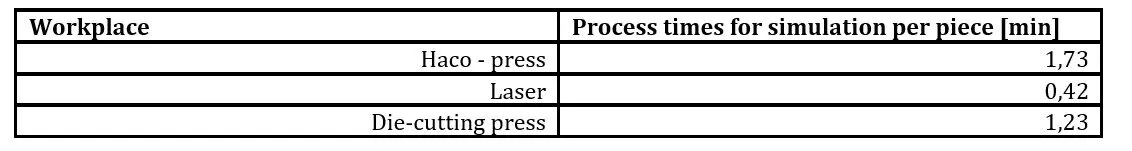
The process times on the material list are given as the average times of operations per piece, in which the transport of the material to the given workplace or intermediate warehouse, the machine settings, and the process time itself are taken into account. Therefore, the model did not take into account the transfer of material using handling equipment to the hall and subsequently to individual workplaces.
Table 4: Average processing times of workplaces
A specific order was selected for the simulation, which had already taken place in the past and which contained 50 pieces of containers marked 1332. It was precisely for this reason that it was chosen as the most suitable because this group of products marked 1332, from group 3, see the measurement step that goes through by a given center 2840, and only a negligible number of operations are performed in other centers.
Model Description
At the beginning of the model, there is a Resource, which represents the delivery of the necessary material for the order to the intermediate warehouse of center 2840. The resource was set to contain four types of material. The first type of material marked V_L (Type = 1, color = yellow) represents the products that travel from intermediate storage 2840 to the Laser workplace and then to the press brake. The second type of material marked V_V (Type = 2, color = blue) represents material intended for the workplace of a die-cutting press and a press brake. Material marked V_L_F (Type = 3, Color = Orange) is material that only requires burning on the laser and then goes straight to the Intermediate Warehouse before the next operation. Material V_V_F (Type = 4, color = green) is intended for die cutting on the Die-cutting Press and then goes to the Intermediate Warehouse before the next operation.
Once the processes at the laser and die-cutting press workstations are complete, they require bending, and then the material is moved to the Storage Area at the Haco Edge Press. After the bending has been completed, the material is moved to intermediate storage, where it awaits the next operation.
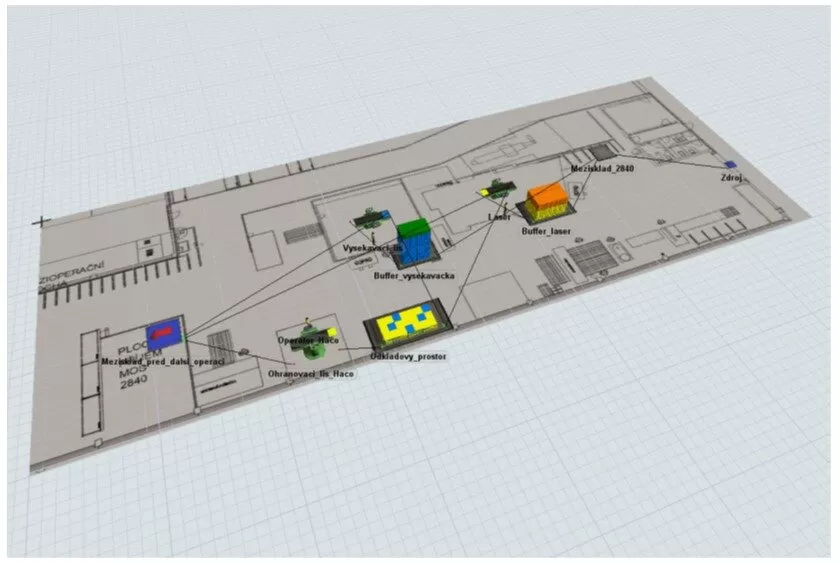
Fig 7. Model during simulation
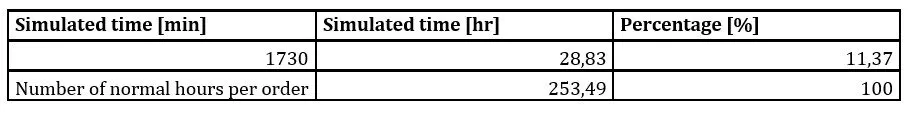
After starting the simulation, it took 1730 minutes to produce all 1250 parts needed for the production of 50 pieces of container 1332. In the material bill, the company has specified the number of standard hours for this order. Specifically, it is 253.49 standard hours.
Table 5: Comparison of simulation time with standard job hours
To verify the accuracy, we can use the load that was calculated in the measurement step. Here, we achieved a workplace utilization of 9%. Therefore, this is a difference of approximately 2%. The result was presented to the company, and, with such a small deviation, the simulation was considered correct. Among the other results of the processed simulation was obtaining the use of the workplaces, when the press brake was used at 100%, the die-cutting press at 39%, and the laser at 17%. The smallest workload of the laser workplace already indicates the fact that this workplace has the most modern machine when compared to the workplaces of the Haco Punching Press and Edge Press.
New Solution Proposal
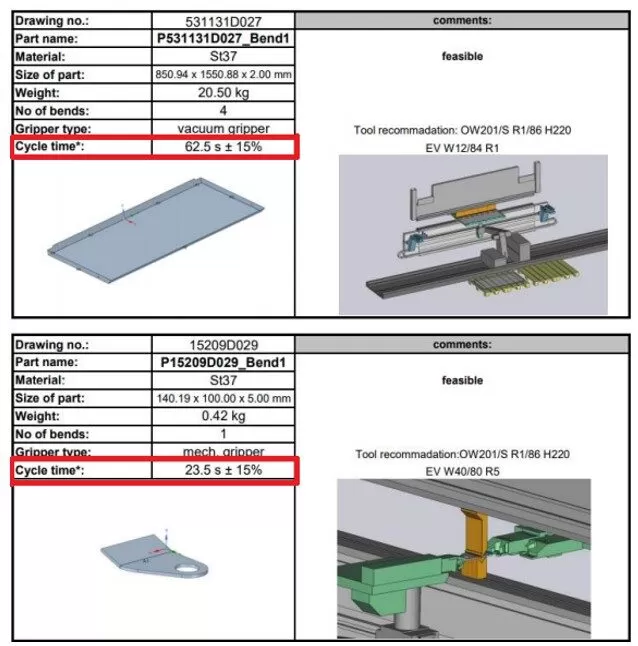
After defining the goals and the specific workplace together with the processing of information and data using measurements and the creation of a simulation model that met the company’s ideas, it was possible to focus on the possibilities of improvement and the design of a new solution. In this step, data from the feasibility study were used, which the company had done in the past with the Trumpf machine manufacturer. Specifically, it was a feasibility study on the TruBend Cell 5000 automatic bending cell, focusing the study on the production of the 13 components most commonly produced on press brakes. Part of this study was the indication of the approximate time of production (indicated in red boxes), see the image below.
Fig.8: Feasibility study sample
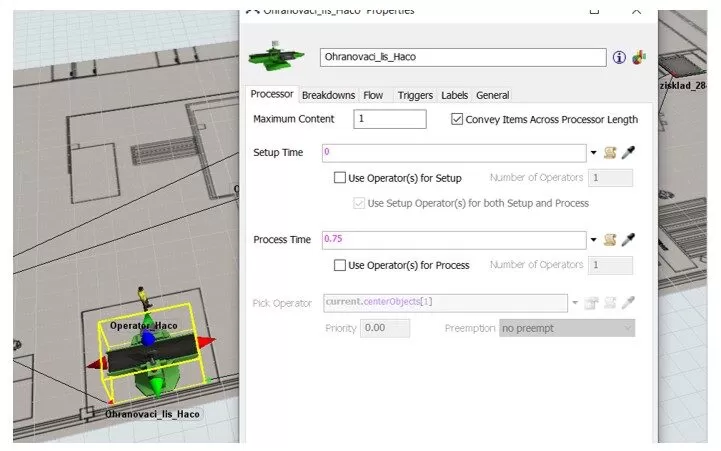
To create a simulation and provide the company with evidence of how much time they would save if the same job were carried out with the help of a fully automated folding cell, average process times were used for automation design, and, since the process times of the manufactured pieces in the automated cell ranged from 0, 5 – 1 min, a new process time was set for the Hacopress workstation at 0.75 and the simulation was run with the new values.
Fig 9. Process time after workplace automation
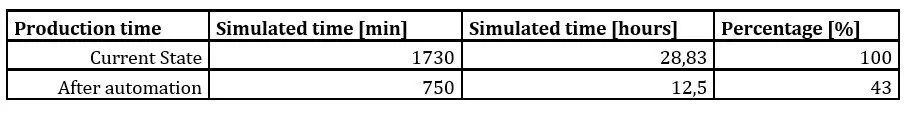
The new simulation showed that after automating the Haco press workplace, the percentage utilization of the Laser workstations would increase to 39% from the previous 17% and the die-cutting press to 90% from the originators of 39%, and the total simulation time to produce all the necessary pieces for the order would take 750 minutes compared to the previous 1730 minutes, and, compared to the current state, there would be a 57% time saving on the order in this section of production.
Table 6: Comparison of Simulation Times
Conclusion
The synergy between lean manufacturing methods and simulation reveals a new transformative path that promises to redefine the modern manufacturing environment. As companies today struggle to navigate the complex challenges of today’s dynamic markets, the collaboration between lean manufacturing principles and simulation methodologies is proving to be an indispensable approach to achieving operational excellence. Based on the principles of reducing waste, nonvalue-added processes, and continuous improvement with customer-centric manufacturing, lean manufacturing provides a holistic framework for reshaping manufacturing processes. It increases efficiency, minimizes waste, and maximizes value creation. However, the pursuit of lean manufacturing excellence is not without obstacles, from cultural shifts within the company to data complexity.
Manufacturing process simulation, on the other hand, offers an invaluable set of tools and techniques to tackle these challenges, and provides a dynamic platform for modeling, experimentation, and analysis. By simulating manufacturing processes, organizations can easily visualize or predict bottlenecks, optimize resource allocation, and validate proposed changes, all without disrupting real-world operations. However, the art of simulation itself is not without problems, from the accuracy of the data to the complexity of interpretation.
This article focused on illuminating the relationship between lean manufacturing and simulation and showed how simulation serves as a suitable tool among other measurement, analysis, or implementation tools in the steps of lean manufacturing implementation. Through the presentation of a case study carried out in a real company, it was possible to see the possible advantages of simulation, from visualization of the process and verification of the current state to use as a decision-making tool for choosing a possible improvement of the workplace of the production process.
In the future, the use of simulation as a new lean manufacturing tool has enormous potential. It seamlessly aligns with the company’s commitment to continuous improvement, fostering a culture of experimentation and optimization. Overall, it can form an overlap with tools such as the digitization of production or the creation of a digital twin. This partnership enables manufacturers to respond quickly to market changes, innovate effortlessly, increase customer satisfaction, and become the cornerstone of manufacturing excellence in an era where adaptability and precision are the hallmarks of success.
This work was supported by a grant from the Student Grant Competition CTU number: SGS23/165/OHK2/3T/12
References
BANKS, J., 1998. Handbook of simulation: principles, methodology, advances, applications, and practice [online]. 1st. Wiley [cit. 2023-09-01]. ISBN 978-0471134032. Dostupné z: https://juancarlosvergaras.files.wordpress.com/2013/09/handbook-of-simulation-principles-methodology-advances-applications-and-practice.pdf
ELMARAGHY, H. A., 2005. Flexible and Reconfigurable Manufacturing Systems Paradigms. International Journal of Flexible Manufacturing Systems [online]. 17(4), 261-276 [cit. 2023-09-01]. ISSN 0920-6299. Dostupné z: doi:10.1007/s10696-006-9028-7
ELSAYED, E. A., 2008. Simulation modeling and analysis [online]. 5th. McGraw-Hill [cit. 2023-09-01]. ISBN 978-1420073093. Dostupné z: https://industri.fatek.unpatti.ac.id/wp-content/uploads/2019/03/108-Simulation-Modeling-and-Analysis-Averill-M.-Law-Edisi-5-2014.pdf
FERDOWS, K. a A. DEMEYER, 1997. Lasting improvements in manufacturing performance: in search of a new theory. Journal of Operations Management [online]. 15(4), 315-335 [cit. 2023-09-01]. ISSN 0272-6963. Dostupné z: https://core.ac.uk/download/pdf/35455324.pdf
GUNASEKARAN, A., T. PAPADOPOULOS, R. DUBEY, S.F. WAMBA, S.J. CHILDE a B HAZEN, 2016. Big data and predictive analytics for supply chain and organizational performance. Journal of Business Research [online]. 70, 308-317 [cit. 2023-09-01]. ISSN 0148-2963. Dostupné z: https://fossowambasamuel.com/wp-content/uploads/2017/04/Big-data-and-predictive-analytics-for-supply-chain-and-organizational-performance-1.pdf
JASTI, N.V. a R. KODALI, 2014. Lean production: Literature review and trends. International Journal of Production Research [online]. 53(3), 867-885 [cit. 2023-09-01]. ISSN 0020-7543. Dostupné z: doi:10.1080/00207543.2014.937508
LIKER, J.K., 2004a. The Toyota Way: 14 Management Principles from the World’s Greatest Manufacturer [online]. 1st. McGraw Hill [cit. 2023-09-01]. ISBN 978-0071392310. Dostupné z: https://vietnamwcm.files.wordpress.com/2008/07/mcgraw-hill-thetoyotaway-14managementprinciples.pdf
LIKER, J.K. a T.Y. CHOI, 2004b. Building Deep Supplier Relationships. Harvard Business Review [online]. 82(12), 104-113 [cit. 2023-09-01]. ISSN 0017-8012. Dostupné z: https://www.researchgate.net/publication/265659662_Building_Deep_Supplier_Relationships
NELSON, Barry L., NELSON a David M. NICOL, 2000. Discrete-event system simulation [online]. 3rd Edition. Prentice Hall [cit. 2023-09-01]. ISBN 978-0130887023. Dostupné z: https://www.academia.edu/9518895/discrete_event_system_simulation_by_jerry_banks
PIDD, Michael, 2004. Computer Simulation in Management Science [online]. 5th. Wiley [cit. 2023-09-01]. ISBN 978-0-470-09230-9. Dostupné z: https://www.wiley.com/en-us/Computer+Simulation+in+Management+Science%2C+5th+Edition-p-9780470092309
ROBINSON, S. a R. D. KLASSEN, 2012. Conceptualizing and enacting supply chain management in complex environments. Journal of Cleaner Production [online]. 20(1), 8-18 [cit. 2023-09-01]. ISSN 0959-6526.
SHAH, R. a P.T. WARD, 2003. Lean Manufacturing: Context, Practice Bundles, and Performance. Journal of Operations Management [online]. 21(2), 129-149 [cit. 2023-09-01]. ISSN 0272-6963. Dostupné z: doi:10.1016/S0272-6963(02)00108-0
STERMAN, J. D., 2000. Business dynamics: systems thinking and modeling for a complex world [online]. 1st. McGraw-Hill Education [cit. 2023-09-01]. ISBN 978-0072389159. Dostupné z: https://industri.fatek.unpatti.ac.id/wp-content/uploads/2019/03/007-Business-Dynamics-Systems-Thinking-and-Modeling-for-a-Complex-World-John-D.-Sterman-Edisi-1-2000.pdf
WOMACK, J.P. a D.T. JONES, 1996. Lean Thinking : Banish Waste and Create Wealth in Your Corporation [online]. 48(11). Journal of the Operational Research Society [cit. 2023-09-01]. ISBN 978-0743249270. Dostupné z: doi:10.1038/sj.jors.2600967