Volume 2020,
Article ID 623545,
Journal of Marketing Research and Case Studies,
19 pages,
DOI: 10.5171/2020.623545
Received date: 1 October 2019; Accepted date: 21 November 2019; Published date: 20 January 2020
Academic Editor: Violeta Sima
Cite this Article as:
Niculae V. MIHAITA and Adrian Nicolae A.M. CAZACU (2020), “Perception of Adults about the Anime Products in Romania", Journal of Marketing Research and Case Studies, Vol. 2020 (2020), Article ID 623545,
DOI: 10.5171/2020.623545
This paper is focused on the adult public of entertainment. The purpose is to find if they keep their interest for the anime products, like before, when they were young. The study proves that adults watch anime, appreciate it and its relative products, for some different reasons, which lead us to some dominant qualities of this kind of art. These qualities could be used eventually for some publicity goals related to the anime products.
Keywords: Information Theory, Anime, Market, Related Products, Consumer Decision.
Research Question
The perception of the young is, in most cases, influenced by the family education. If an entire family is waching a film, the chance for the children to appreciate this kind of art is great. The parents educate their children directly or indirectly, by having some opinion about art, common sense and society. We have to study, as a consequence, what is the opinion of the adult people regarding the anime, how educational the parents think that this kind of animation is for their children. On the other hand, we are interested to know how many of the young keep their interest for the anime, when they grow up, and become adult.
The hypothesis H1 we make, in the following research, is that the adult Romanian audience segment, which represents the buying support for the related anime products, consider and appreciate this form of art, from the cultural or artistic point of view or even from the educational point of view, also the reason for which they would acquire anime products, for themselves or for their children. When speaking of the adult segment, we will separate the male segment from the female one. They could have different opinions upon art, and other subjects.
So, we shall prove that the adult male segment would buy these products for their artistic superiority, and acquire them for being marvelous. A similar conclusion we have obtained in the last similar study, and even more, because the association with the adjective marvelous for men is a new reason. The female audience are influenced by the first order interraction between the surprising and dramatic character of anime, considered by them, in consequence, as educational.
The interraction of the two qualities was of less interest for the male segment, as it was demonstrated in the last study, but, as we see, is important for the adult female segment, another new result. The last study of the anime perception was focused on the opinion of the majority, which are the young segment, but in this study the interest is about the adult segment, even if they are not as many as the young people. Garhering the results of the present and the previous study, regarding the adult segment and their perception upon the anime products, we conclude that, for the entire adult segment of respondents, the anime is labeled as marvelous, the most important interraction of the attributed qualities is between its surprising and dramatic qualities, the main reason also for the young people, who are the majority of fans. Other characteristic of some interest which must be mentioned is the cultural quality, in interraction with the most important adjectives associated to the anime products- the marvelous quality. In adition, the female segment, as well as the young, even for different reasons, also highlights the educational aspect of this complex form of art, suitable for different ages or biological gender, all the same.
Research Design and Methodology
The following study, is based on the same results as was the previous study upon the anime perception (Mihaita, Cazacu, IBIMA, 2018), obtained from the online research, conducted by the author. The total of the respondents was 268, and they were of different ages and gender, also with different preferences for one or other quality to associate to the anime products, but all of them were part of the online entertainment groups. (Cazacu, 2018) Unlike the last study on the same subject, this paper pays attention only to the adult opinion in the matter of anime products perception, analyzing the associated adjectives. This time, we thought to interchange the analysed groups, but we mentained the set of the attributed adjectives approximative identical and refered only to the adult segment of respondents:
cultural, artistic, superior– for the non buyer males
cultural, artistic, marvelous –for the male buyers’ segment
surprising, dramatic, educative –for the female segment
For the purpose of this study, we shall begin with males, who are divided, like the other time, in two groups: those who would buy and those who buy for some reason. Finally, we have associated to the female segment, the set preferred by the young people, in the previous study.
From this study, together with the previous one (Mihaita, Cazacu, IBIMA, 2018), we are looking for a representative set of attributes, from which we shall select the dominant one, also the dominant association of all the variants, all of these to understand better the most determining factors in the consumers decision. We consider this goal, locating the dominant determining factor in the consumers’ decision, like a H1 hypothesis, which we shall prove in the following. This purpose is also useful when choosing the title and the SLOGAN of a publicity campaign, to select three representative qualities, one of them becoming the dominant one, the center of everyone’s attention.
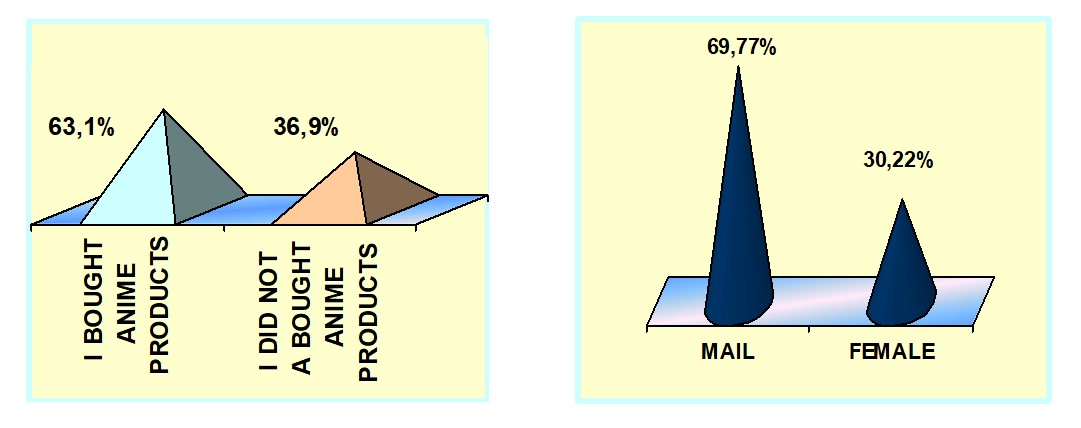
Fig. 1: The respondents to the online survey, by gender and buying options
(Source: author’s research)
The Male Adult Segment
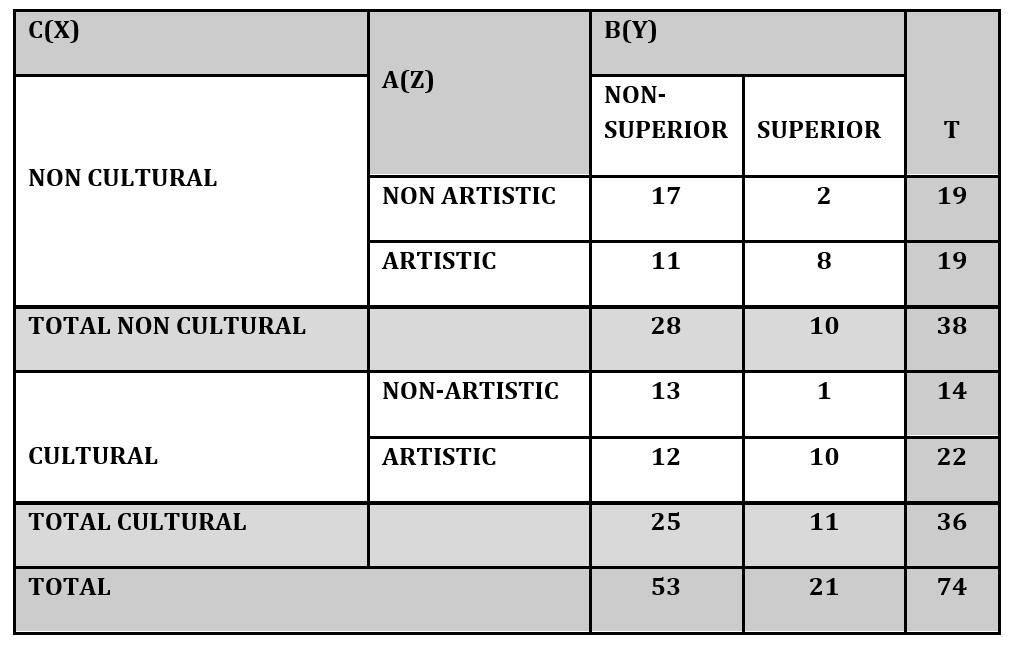
We have denoted the adjectives: A= artistic, B= superior, C= cultural, or as variables in the following calculus: Z= artistic, X= cultural, as independent variables, and Y= superior, as the dependent one. The alternatives of each adjective are indexed: i=1 for the negative alternative, and i=2 for the affirmative one.
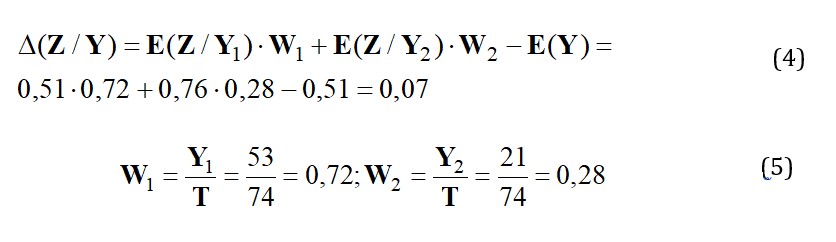
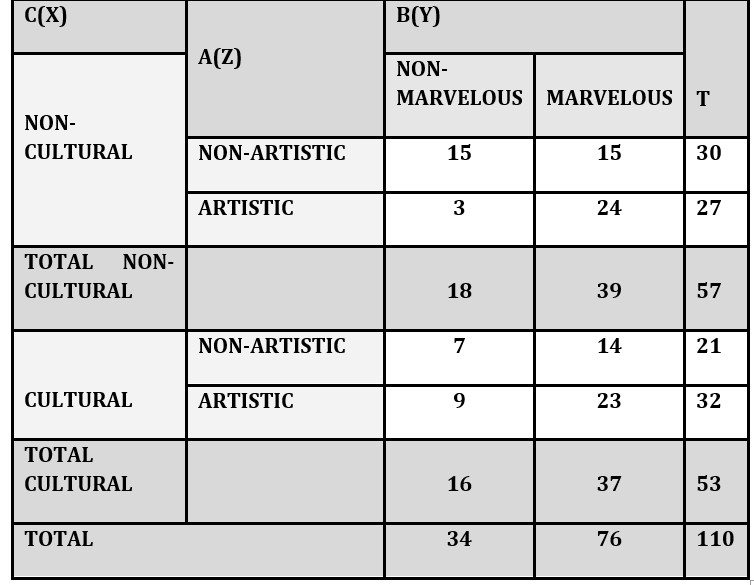
Table 1: The 23contingency table regarding the male non buyers’ segment
The information theory formulas which we have used are detailed as follows:
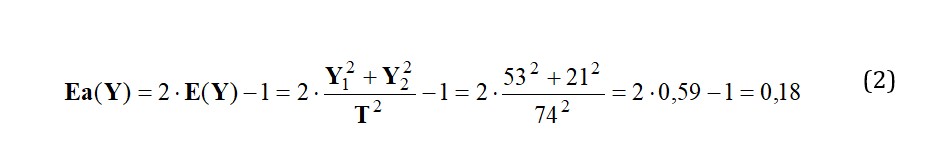
The calculus suggests that the energy (Onicescu informational energy) of the artistic adjective is associated with the artistic positive alternative of anime. When speaking about the influence of the artistic adjective, we calculate the Onicescu adjusted informational energy of this variable:
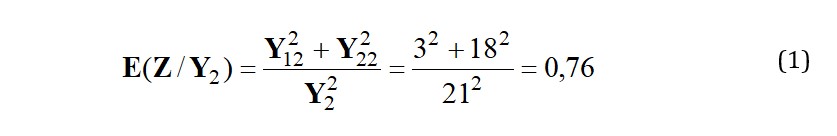
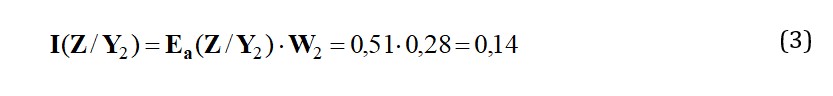
The informational importance of the artistic quality, in the presence of the affirmative alternative of the superior quality of anime, is the most significant:
We also mention the informational gain of the superior quality in the presence of the artistic characteristic, that meaning the second is determining the first, having a great importance in the consumer of anime decision, for the non buyer males.
The informational gain of the superior quality of anime, in the artistic quality presence is moderate, as it results from the calculus given by the following formula:
are the “specific weights”, and E(Y) is the informational energy of the anime artistic quality.
Table 2: Calculus referring to the first order interaction artistic- superior
in the non buyers male segment
As to the relation between these two qualities, revealed by the K coefficient, we can appreciate it like a strong one:
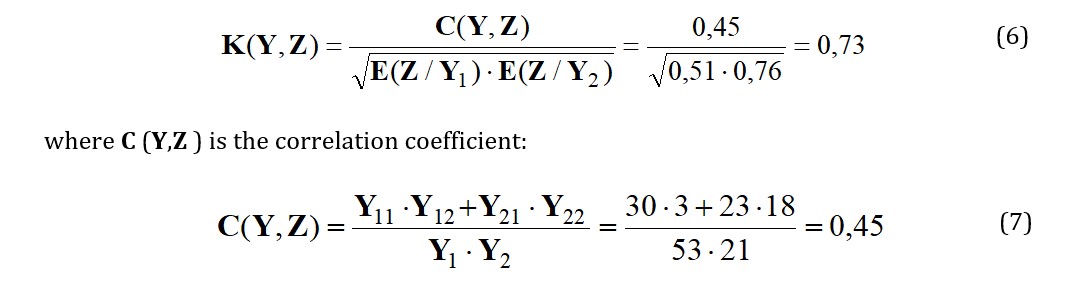
where C(Y,Z ) is the correlation coefficient:
The cultural characteristic of anime does not influence its artistic or superior qualities, the relation between the first two qualities (K=0,98) and the first with the third (K=0,99) being of no significance.
The above considerations, and other more results, are verified using the MONALIS program, by its author, professor MIHAITA, the main conclusions being presented in the first ideogram (Fig. 3)
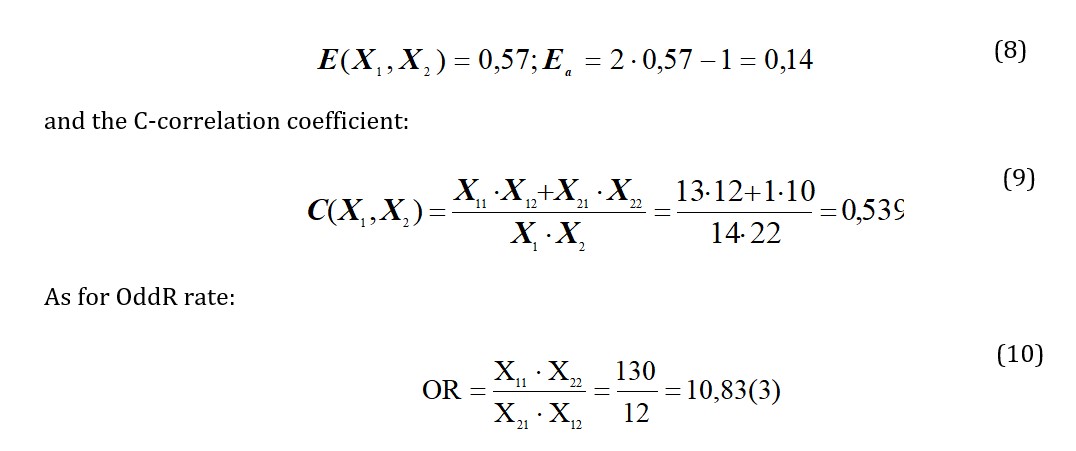
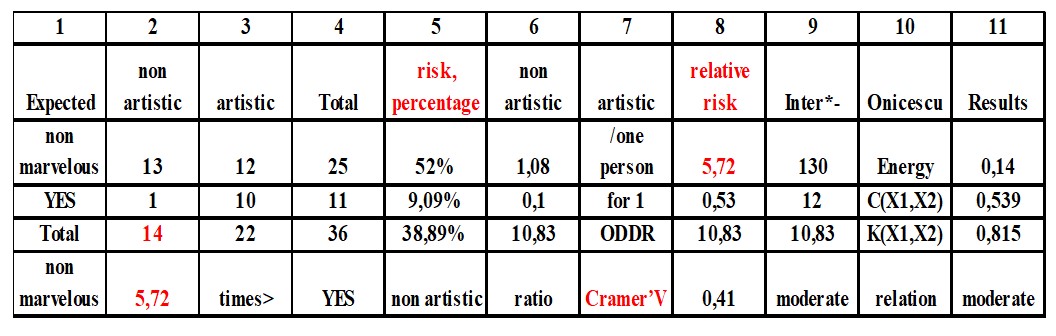
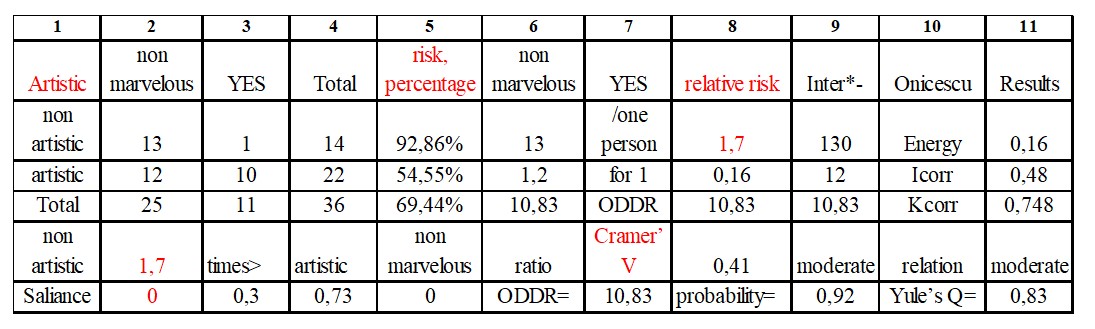
We want to study, in addition, the probability of association between the negative alternatives, “non artistic” and “non marvelous”, for the non-buyers’ male segment, through the “non cultural” alternative. We consider 36 of non buyers corresponding to the negative alternatives of the set, from the total of 74. We denote, this time, the independent variable with Y, horizontal, and the dependent variable with X, vertical, then we will change the variables’ places. In the first table, it is studied the X state in the Y presence. The magnitude of the association between, “non artistic” and “non marvelous”, finding the K- coefficient equal to K=0,815 so the relation results as moderate. (Table 3a) The adjusted Onicescu energy is:
In order to transform the risk rate ODDS(OR coefficient) in the association probability (for the negation of the attributes), we use the formula: P = OR/(1+OR) = 10,83/(1+10,83)=0,92.
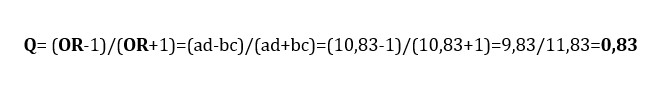
On the other hand, converting the ODDS ratio coefficient from a-1 to 1 scale, we obtain the Q- coefficient (Yule’s Q), which is always between -1 and 1:
Detailing, from the first table, we conclude that when the non buyer males responders had already preferred the “non cultural” option (condition) and we expect to say “non artistic”(expected), after they have had said “non marvelous”, the chance (relative risk) is of 5,72 times greater than for those who have said YES to “marvelous”, followed by the “non artistic” option.
Table 3a: Non buyer male respondents about the interaction between the negative alternatives of the two qualities: non marvelous over non artistic
Table 3b: Non buyer male respondents about the interaction between the negative alternatives of the two qualities: non artistic over non marvelous
In short, with the informational influence of 14% it is realized an informational relation of 81,5%, in which the dominant alternative is “non artistic” (in the “non marvelous” alternative presence). In reverse, in the second table (Table 3b), that when the non buyer males responders had already preferred the “non cultural” option (condition) and we expect to say “non marvelous” (expected), after they have had said “non artistic”, the chance (relative risk) is of 1,7 times greater than for those who have said YES to “artistic”, followed by the “non marvelous” option. So, with the informational influence of 16% it is realized an informational relation of 74,8%, in which the dominant alternative is “non marvelous” (in the “non artistic” alternative presence).
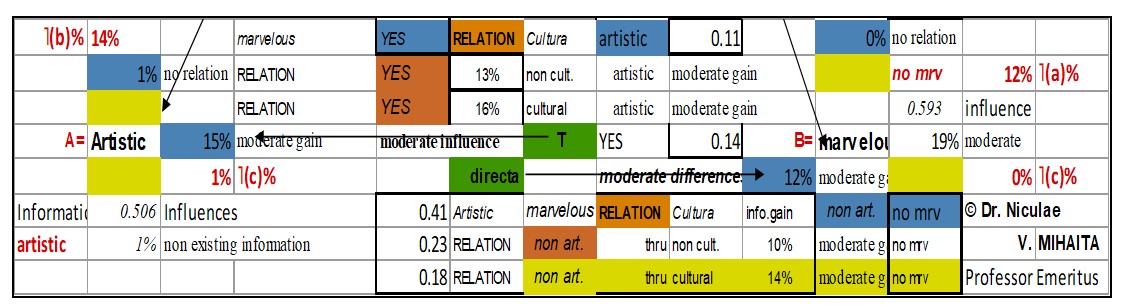
Fig. 2: Partial ideogram with the results of MONALIS’ application for the negative alternatives: noncultural, non artistic, non marvelous in the male non buyers’ segment
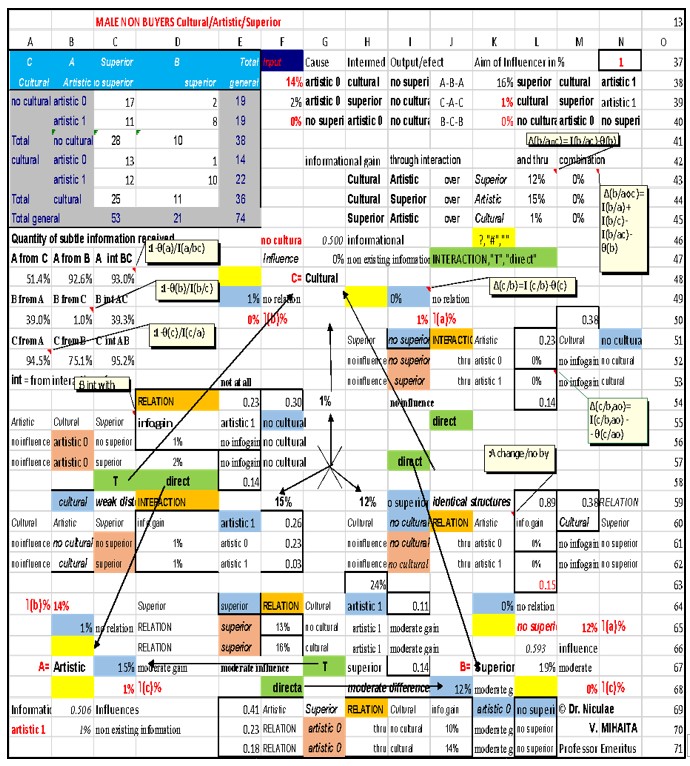
Fig. 3: Ideogram with the results of MONALIS’ application for the influences in the non buyers’ male segment of respondents, refering to the adjectives: cultural, artistic, superior *
* The above calculus follows the algorithm and interpretations of professor Mihăiță N.V. regarding the information theory application and OCTAV ONICESCU Informational Statistics School, in B+ international recognized journals (ECECSR, i.e. Economic Computation and Economic Cybernetics Studies and Research), Economical Publishing Houses volums and Editurii ASE Publishing House of Bucharest, with author’s consent.
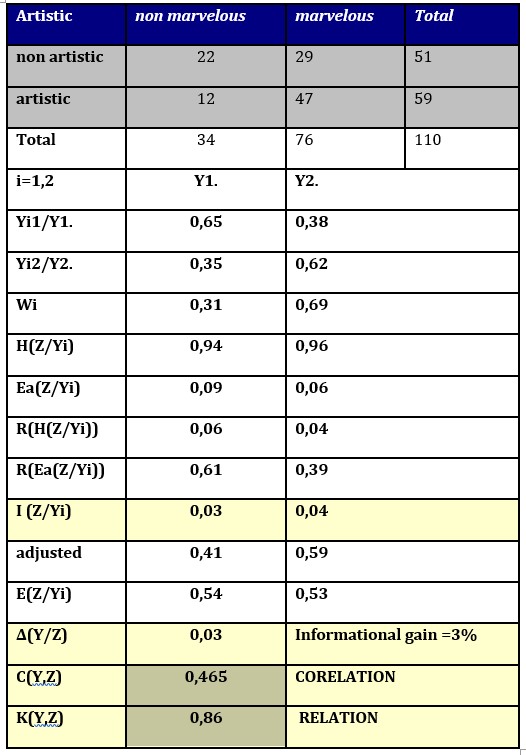
The other male segment refers to the buyers. The associated data are presented as follows. (Table 4) The involved adjectives have been denoted: A= artistic, B= marvelous, C= cultural, and as variables in calculus: Z= artistic, X= cultural, as independent variables, and Y= marvelous, as the dependent variable. The alternatives of each adjective are indexed, as previous: i=1 for the negative alternative, and i=2, for the other.
Table 4: The 23contingency table regarding the male buyers’ segment
Without any calculus, it seams obvious that the artistic quality attributed to anime is strongly determined by the positive alternative of the marvelous quality. Using the same formulas, especially those which refer to the informational energy, gain and correlation, we have listed similar calculus, as for the non buyer males.
The calculus reveals, using the same formulas, that for the buyers’ male segment, the artistic quality is also important, determining, even less than in the previous case, another quality of the anime, the marvelous quality, which is the main reason in the buying decision of these respondents. When analysing the data in table 4, it becomes of no doubt that the affirmative alternative of the marvelous quality is overwhelming: 69% compared to the negative alternative of 31%. Even if the informational gain is smaller than in the previous analysis (3%), the K coefficient reveals the existence of a significant relation (K=0,86) between the two qualities, and the adjusted informational energy of the marvelous quality, Ea(Y) =14%, proves the importance of this first order interaction for the buying decision of the male segment. These results are also verified by professor MIHAITA, using the MONALIS program (Fig.4).
Table 5: Calculus referring to the first order interaction artistic- marvelous in the buyers’ Male Segment
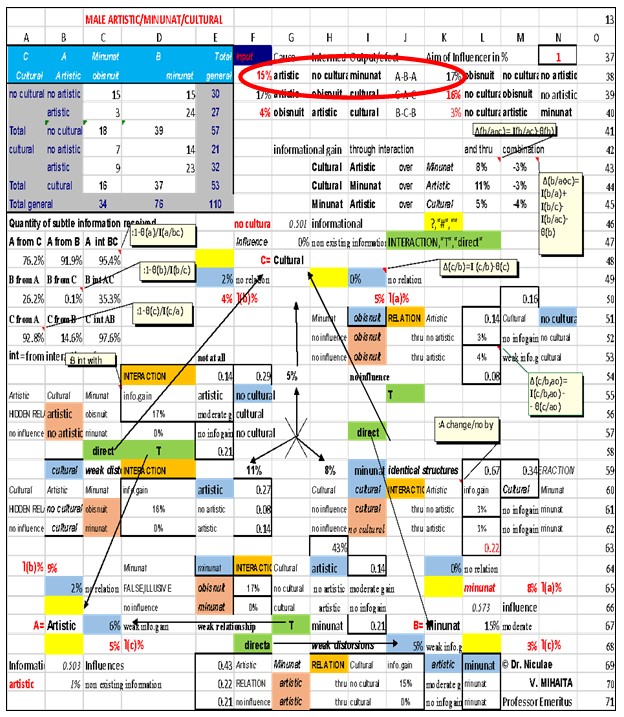
Fig. 4: Ideogram with the results of MONALIS’ application for the influences in the buyers’ male segment of respondents, refering to the adjectives: cultural, artistic, marvelous *
* The above calculus follows the algorithm and interpretations of professor Mihăiță N.V. regarding the information theory application and OCTAV ONICESCU Informational Statistics School, in B+ international recognized journals (ECECSR, i.e. Economic Computation and Economic Cybernetics Studies and Research), Economical Publishing Houses volums and Editurii ASE Publishing House of Bucharest, with author’s consent.
As some partial conclusions from the realised investigations, we can highlight the importance of the artistic quality in the male segment, buyers or non buyers.
This quality influences in different ways the two male groups: for the non buyers, the artistic characteristic of anime determines the superiority of this kind of art, influences the possibility of buying the relative products; for the buyers, the artistic quality leads to the buying decision, determines the impression of a marvelousart, even in a moderate way.
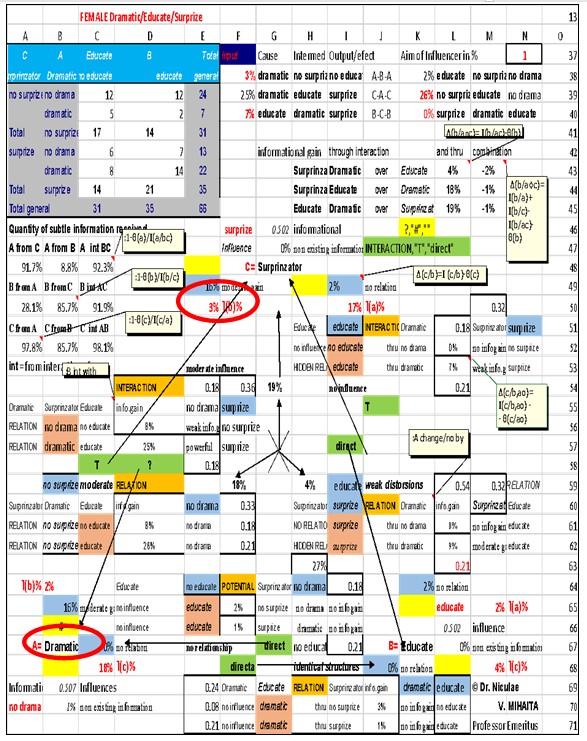
The Female Segment
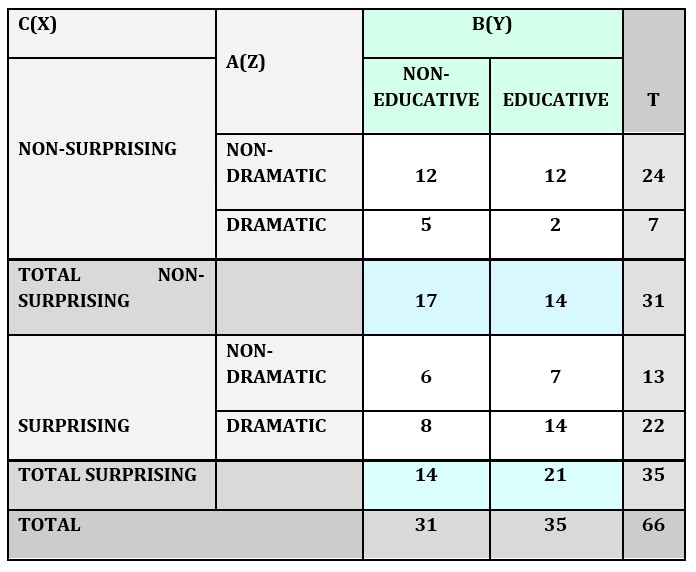
Table 6: The 23contingency table regarding the female segment
The female segment is less represented in the survey conducted by the author. Even so, we are interested in the reason which would determine the decision of buying the anime related products. The data analysis in Table 6 leads to the opinion that both alternatives of the educational studied quality are almost equally represented, so we will pay attention to the other two caracteristics, to see what are the reasons which impress the female segment, and influence the buying reason.
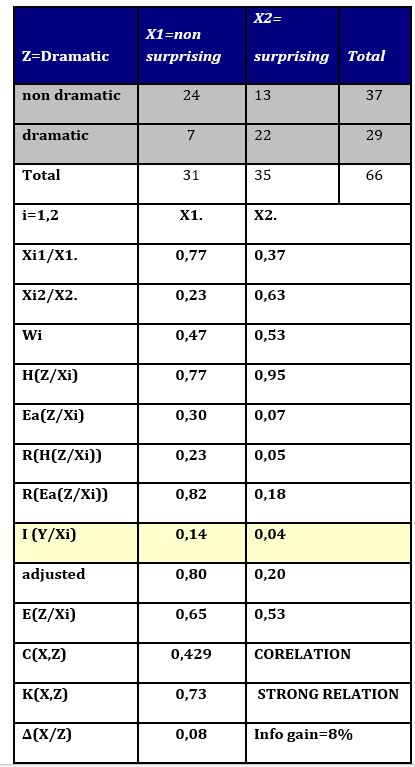
The response to our question is that the female segment is strongly influenced by the interaction between the surprising and dramatic qualities, which determines the decision in this case. K coefficient demonstrates a strong relation (K=0,73) and the informational gain is moderate but significant on both directions: Δ(X/Z)=8% and Δ(Z/X)= 9%.
Table 7: Calculus referring to the first order interaction dramatic- surprising in the female segment
Fig. 5: Ideogram with the results of MONALIS’ application for the influences in the buyers’ female segment of respondents, refering to the adjectives: surprising, dramatic, educative *
* The above calculus follows the algorithm and interpretations of professor Mihăiță N.V. regarding the information theory application and OCTAV ONICESCU Informational Statistics School, in B+ international recognized journals (ECECSR, i.e. Economic Computation and Economic Cybernetics Studies and Research), Economical Publishing Houses volums and Editurii ASE Publishing House of Bucharest, with author’s consent.
The young segment (completion)
In the following, we shall pay attention to the probability of the association between the “surprising” and the “educative” adjectives, very significant for the definition of the mentioned SLOGAN.
The MONALIS program has completed the interpretations about the association of the two adjectives in the previous study (Mihaita, Cazacu, IBIMA, 2018) in the section relative to the young segment of respondents.
The two adjectives’ association can be also analyzed with the aid of the significant coefficients: the chance (ODDS), the risk rate of the association, and the Yule’s Q coefficient, which gives the magnitude of it.
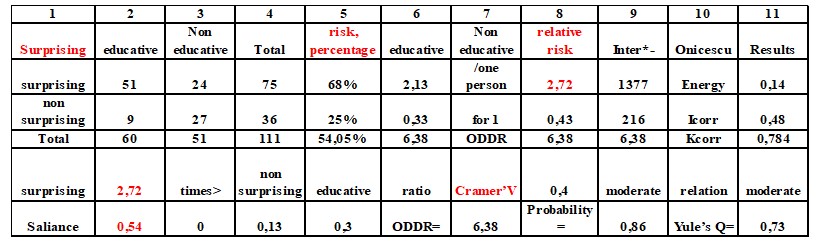
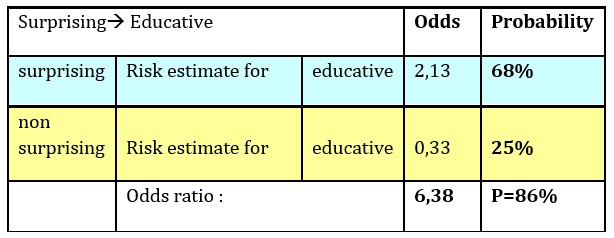
Table 8: The influence of surprising over the educative quality in the young segment of respondents
In Table 8, it is calculated the chance (ODDS) as a respondent who said “surprising” to add also “educative” 51/24 = 2,13 (column 2/column 3 = column 6) which means that for every 2,13 persons who started with “surprising” and then “educative” there is one person who does not choose “educative” (or: for 21 persons who pronounce “surprising” together with “educative”, there are 10 persons who do not continue with “educative”).
The estemated chances for the event that a respondent who did not say “surprising” to say “educative” are of 9/27=0,33 (column 2/column 3 = column 6) meaning to one person who says “educative”(column 7); in other words, if one person does not say “surprising” but says “educative”, there are three other persons who do not say any of the qualities we have studied.
The rate of risk is of 2,13/0,33 = 6,38 meaning that if one person starts with “surprising”, they are of 6,38 times more possibile to continue by selecting “educative”, comparing with the person who did not begin with “surprising”…
For calculating the relative risk, (column 8) SPSS program leads to two different results.
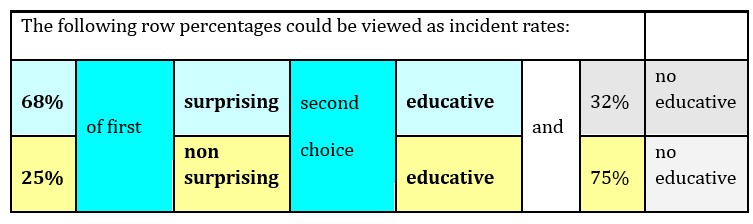
Supposing the data were collected as part of a prospective study, then the next column (column 5- percentages %, compared with column 4-Total) can be identified as the incidence rates:
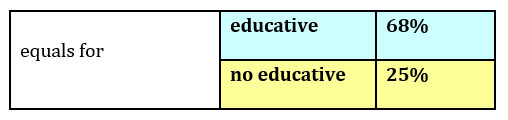
68% say “surprising” followed by “educative” and 32% say other words; 25% do not say “surprising” but continue with “educative” and 75% say any other words.
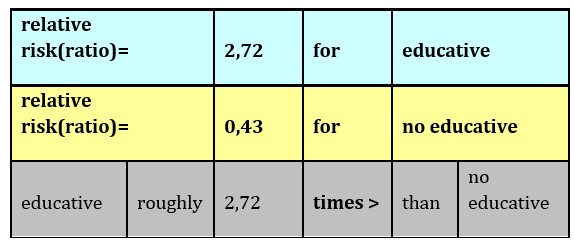
If we consider the selected “educative” appreciation as the event, the estimated relative risk ODDS, is of 68%/25% = 2,72; when other words are pronounced, the relative risk for those who do not say “surprising” is 32%/75%= 0,43.
If we consider the data as the incidence rates, we can conclude that those who begin with the “surprising” appreciation are at least of 2,72 times (column 8, column 2) more tempted to add “educative” than those who did not begin with the same appreciation, but accept “educative”.
For transforming the rate risk into the association probability between “surprising” and ”educative”, the model is: P = OR/(1+OR); OR=P/(1-P); salience 6,38/(1+6,38) = 0,86.
Applications of Information Theory as Shannon’s Entropy and Onicescu’s Informational Energy merged perfect and sustain each other.
For example, in Table 8, (The influence of surprising over the educative quality in the young segment of respondents) where we are looking for answers connected with the influences, the relative risk and odds for better decisions connected with the marketing campaign, the dominant slogan, and so on. For the estimate relative risk, either column 2 or column 3 can be the event, so the MONALIS program and the SPSS program provide two estimates.
The MONALIS application (Methodology of Onicescu Negentropic Analysis in Language of Informational Statistics) gives us the next results:
the influence of the columns (second choice) over the precedent ones shows the energy:
E=0,14 also
the informational correlation: C=0,48 and
the K-correlation coefficient K= 0,784, which measures the magnitude of the association.
If we follow other measurements for 2×2 tables (SPSS registered trademark Base 8.0 Application Guide, Chapter 5, pp. 80), the findings are:
Table 9: SPSS measurements
(source: Table 8)
Table 10: SPSS measurements
(source: Table 8)
Table 11: SPSS measurements
(source: Table 8)
For the Table 11 data, the null hypothesis H0, might be that the answers percents (the proportions) for choosing “educative” or “non educative”, are equal:
Table 12: Probabilities for the two alternatives of the surprising/educative interaction
(source: Table 8)
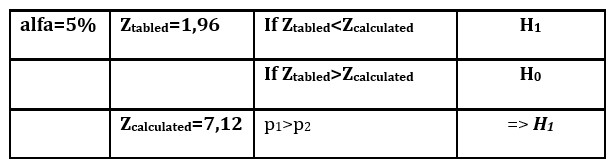
If Ztabled < Zcalculated then we admit H1, else the null hypothesis H0 is admitted:
Table 13: Hypotheses about two proportions with a=5%, Ztabled = 1,96
(source: Table 8)
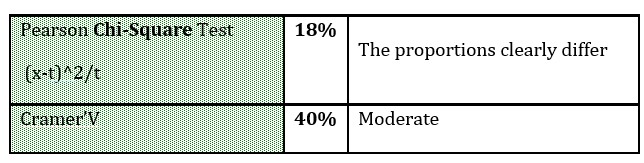
Table 14: Chi-Square Test for the two proportions
Result
The present study highlighted once again the marvelous quality of anime, as a dominant quality. Also, other qualities are highlighted: artistic, which determines superior and marvelous qualities, and the surprising adjective (determined by the dramatic characteristic). All of these determine the educative quality for the majority.
The results of many other tests are also highly significant and do not contradict these results. The H0 hypothesis is null. The H1 hypothesis we have made at the beginning of this study is prouved.
Discussion
By our opinion, as determinants and determined qualities, so as the most important of all, we can select the following three qualities: surprising, artistic, marvelous, which, finally lead to the educative appreciation. In the interaction between artistic and marvelous, the dominant quality is the second one, so we can keep the marvelous quality. Yet, we mention that, when buying the anime products, the adult segment of respondents has a significant artistic interest about this animation more than the young, the artistic opinion influences their decision process.
Conclusion
The adult segment appreciate this form of art and buy the anime products from different reasons, which are determined by some selected qualities. From this study, and many others, we have concluded that the most significant selected qualities attributed to the anime, are the surprising and marvelous qualities, which, finally, lead to the educative influence and determine the consumer decision, qualities which could realize a SLOGAN for an anime publicity campaign to promote the related products on the anime market.
Cazacu,A.,N. (2018), “Statistical Considerations upon the Results of a Survey Regarding the Anime Culture in Romania”, Journal of Romanian Literary Studies, 13, Arhipelag XXI Press, Tîrgu Mureș, ISSN: 2248-3004, http://www.upm.ro/jrls/JRLS-13, 450-463
Cazacu, A.,N. (2019), “Statistical researches regarding the consumer of anime culture products in Romania”, Journal of Romanian Literary Studies, 16, Arhipelag XXI Press, ISSN 978-606-8624-00-6, http://www.upm.ro/jrls/JRLS-16, 1199-1207
Denison, R. (2010), “Transcultural creativity in anime: Hybrid identities in the production, distribution, texts and fandom of Japanese anime”, Creative Industries Journal, 3(3), University of East, Intellect Ltd Major Papers, England, 222-223
MacWilliams, W. M. (2008), Japanese visual culture: explorations in the world of manga and anime, Armonk, M.E. Sharpe(ed.), New York, U.S.
Mihaita, , V.(2016), Proiect complex de modelare econometrică, Statistics and Econometrics Collection, Academy of Economic Studies Publishing House, Bucharest, Romania, ISBN 978-606-34-0111-4
Mihaita, N., V. and Cazacu, A., N. (2018), “The Perception Influences in the Anime Culture World. Implications on the Anime Products Market”, IBIMA Proceedings, 32nd IBIMA International Conference, in Web of Science(IBIMA), Madrid, Spain, ISBN: 978-0-9860419-9-0
Mihaita, V., N. (1985), “Identification of Relations, Interactions and Potential for Informational Change, Mapping for Decisions in the Foreign Trade Field”, Economic Computation and Economic Cybernetics Studies and Research, ECECSR , 1
Mihaita, V., N. (1985),“Illustration of the Interaction Potential in Marketing”, Economic Computation and Economic Cybernetics Studies and Research, ECECSR, 2
Mihaita, V., N. (1996) Metode cantitative in studiul pieței, Identificarea informatiilor in marketing, Vol I, Economical Publishing House, ISBN 973-9198-46-5
Mihaita, V., N. (2001), Metode cantitative in studiul pieței,Statistica si marketingul informational, Vol II, Economical Publishing House, ISBN 973-590-422-5
Mihaita, V., N. (2001), Metode cantitative in studiul pieței, Crearea de scenarii si simularea in marketing, Vol III, Economical Publishing House, ISBN 973-590-591-4
Mihaita, V., N. and Capota, S. R., (2003), Relations statistiques fortes, caches, fausses et illusoires, Aplications of the informational statistics, Academy of Economic Studies Publishing House, ISBN 973-594-339-5
Mihaita, V., N. (2004), Metode cantitative în e-Marketing, I, Academy of Economic Studies Publishing House, Bucharest, ISBN 973-594-477-4
Mihaita, V., N. (2006), Metode cantitative în e-Marketing, II, Academy of Economic Studies Publishing House, Bucharest, ISBN 973-594-478.