Cracow University of Economics, Department of Packaging Science, Kraków, Poland
Volume 2022,
Article ID 656769,
Journal of Marketing Research and Case Studies,
7 pages,
DOI: 10.5171/2022.656769
Received date: 15 November 2021; Accepted date: 3 February 2022; Published date: 20 April 2022
Academic Editor: Ioseb Gabelaia
Cite this Article as:
Bartlomiej Kabaja (2022), “ Application of Eye Tracking to Study Consumer Buying Behavior on the Example of Carbonated Soft Drinks in Cans", Journal of Marketing Research and Case Studies, Vol. 2022 (2022), Article ID 656769, DOI : 10.5171/2022.656769
Despite their relatively low nutritive value, carbonated soft drinks remain widely consumed all over the world and their sales forecasts continue to show an upward trend. There are now several global players dominating the market; however, the segment still boasts a great potential for introducing new products. With that in mind, the aim of the study was to conduct an eye tracking analysis of consumer buying behavior related to carbonated soft drinks. The research material consisted of 5 cola-flavored carbonated drinks sold in cans. The products tested included those of well-known global brands such as Coca-Cola or Pepsi, as well as those sold by producers with a smaller market share, operating more locally e.g., Curiosity Cola, Smarty Cola, PoloCockta. During the study, the following types of metrics of respondents’ visual activity were considered: duration of a fixation, time to the first fixation, and duration of all fixations. The application of the multiple regression method made it possible to determine the areas of the packaging and the types of visual activity of the respondents which could be closely linked to the process of choosing a carbonated drink. The elaborated mathematical model also includes the variables concerning the differences in the frequency of consumption of carbonated soft drinks among respondents.
The results of the study indicate that the perception of a product through the graphic design of its packaging greatly varies, depending on how often the consumer purchases the product.
In almost every area of economic life and on every market, entities now operate under the conditions of constant competition. This simple truth applies to the market of goods as well as services (Kawasaki et al., 2019). The segment of carbonated soft drinks seems particularly interesting from the research point of view. This is partly due to the ongoing changes in consumer preferences, their lifestyle, and income growth, which is why the market of these goods is constantly evolving (Anderson and Wittwer, 2020). Carbonated soft drinks have become the subject of intense marketing activities carried out on various levels (Adeigbe et al., 2015). The research conducted by Brownbill et al. (2018) indicates a large role of social media (Facebook) in the promotion of carbonated beverages. According to the authors, advertising and promotion of carbonated soft drinks were largely related to the themes of “sports & fitness” and “masculinity” (Brownbill et al., 2018). In turn, a study by Brady et al. (2008) suggests that multi-channel promotional marketing messages also widely reach and affect children (Brady et al., 2008). What is more, research by Stoltze et al. (2018), based on the Front-of-Package (FOP) analysis of 1005 carbonated beverage packages, showed that products containing graphics targeted at children had a higher sugar content (Stoltze et al., 2018). Similar conclusions can be drawn from the results of the study by Gómez et al. (2021), revealing that as many as 30% of the websites promoting carbonated soft drinks targeted children and adolescents (Gómez et al., 2021).
A particularly high activity of enterprises introducing carbonated beverages to the market prompts the need for research in the scope of evaluation of the design of beverage packaging and the promotional message it is meant to convey. Neuromarketing techniques may prove helpful in this regard.
Innovative research methods of today allow for deeper understanding of the consumers’ mental processes involved in, for instance, decision-making. Advances in neuroscience have resulted in the development of new research methods and specialized apparatus. A good example here would be eye tracking – the very essence of which is a very accurate measurement of the movements of human eye. In the development and practical use of eye tracking, a significant role is played by technological advances related to the precision of measurement as well as the use of dedicated computer software (Milic-Czerniak, 2019).
Considering the above, the primary research goal of this study was an attempt to determine the impact of the frequency of consumption of carbonated soft drinks on the manner of the respondent’s visual interaction with the products’ packaging while making purchase decisions. What is more, the use of the eye tracking method in this study made it possible to obtain precise eye tracking data from subjects participating in the experiment.
Eye tracking in food and beverage consumer research
Despite its decades-long presence in science, eye tracking is not a very wide-spread or popular research method. The main barriers here are the high costs of conducting tests and the low availability of measuring devices. Nevertheless, in the literature on the subject, there are several studies in which this method was applied, including some papers on carbonated soft drinks.
Moya et al. (2020) positively assess neuromarketing methods, including eye tracking. The authors claim that such way of measuring consumer reality is accurate and credible. Moreover, it decreases or even eliminates distrust and provides brands with valuable information on the design of food packaging (Moya et al., 2020). Ploom et al. (2020) used eye tracking to study several items of biscuit packaging and, as a result, managed to identify differences in the perception and preference-based choices between two culturally diverse groups (Northern Europeans and Northeast Asians). The applied neuromarketing methods, including eye tracking, made it possible to detect and define the subjects’ subconscious mental processes and emotions. Such knowledge allows for a better adjustment of marketing strategies to different target groups of customers (Ploom et al., 2020).
A slightly different direction of research with the use of eye tracking was presented by Mansfield et al. (2020). The authors analyzed the effectiveness of labels found on the packaging of various food products, including carbonated soft drinks. The main aim of the study was to evaluate the effectiveness of labels in terms of increasing consumer awareness of the content of sugar, sodium, and saturated fat in different products. By improving this aspect of marketing communication, consumers may be able to make healthier food choices (Mansfield et al., 2020).
In turn, a study that concerned carbonated soft drinks to a greater extent was conducted by Neuhofer et al. in 2020. The aim was to determine whether a change in the design of the nutritional label would have an impact on more health-promoting consumer choices. The application of eye tracking revealed that the updated label designs providing information regarding the sugar and caloric content of beverages attracted more consumer attention than the previously used label designs. In the study, the specific areas of interest (AOIs) were determined for careful analysis and visual attention indicators were recorded by the eye tracker, e.g.: the total visit duration before and after the updated Nutrition Facts Label (Neuhofer et al., 2020).
Another study that focused on carbonated soft drinks was conducted by Popova et. al in 2019. Also in that study, the main focus was on the warning characteristics of products’ labels. More specifically, it concerned the perception of the information regarding the content of sugar. The findings suggest that the presence of a warning on the label reduces consumer attention to the elements of the marketing message (Popova et al., 2019). This is, of course, very advantageous from the perspective of consumer health. In the research, eye tracking data presentation methods such as heat maps were applied, whereas the dwell time and fixation count statistics were used for the designated areas of interest (AOIs).
The presented review of already published studies confirms the successful use of the eye tracking method and its being a highly promising tool. However, apart from the two discussed studies focusing on carbonated soft drinks, no new study has appeared in recent years on the analysis of the marketing features of carbonated soft beverages using the eye tracking method. Therefore, the adopted aim of the study seems to be fully justified and particularly interesting.
Research Method
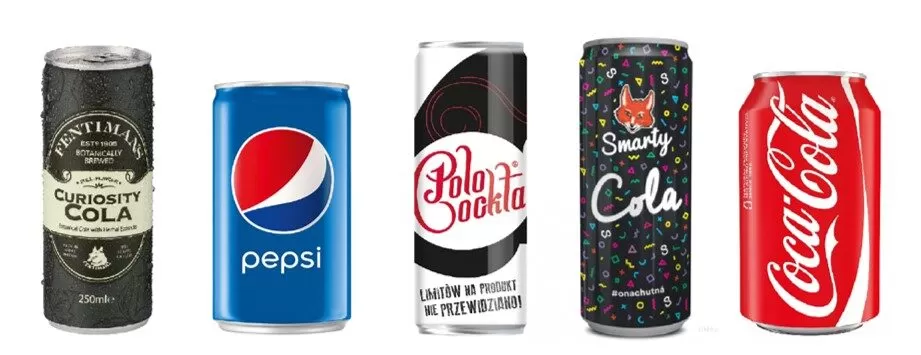
The eyeball movements of the respondents were registered using the eye tracker manufactured by Tobii (Tobii X2-30) attached to an 18.4-inch monitor, with 1920 x 1080 resolution, and compatible with dedicated Tobii Studio version 3.2 software. The adopted research procedure assumed, in the first place, the calibration of the eye tracking device. Then, the respondents completed a short questionnaire that examined their preferences in terms of the carbonated drinks they consumed and the frequency of consumption. Finally, respondents were presented with 5 cola-flavored carbonated soft drinks from which they were to choose one, according to their preferences. The products tested were: Curiosity Cola, Pepsi, PoloCockta, Smarty Cola and Coca-Cola (Fig. 1). During this stage, the respondents’ eye movements were registered, and the data thus obtained were then subjected to statistical analysis, as discussed below.
Fig 1. The cola-flavored carbonated soft drinks used in the study
Source: Author’s own elaboration
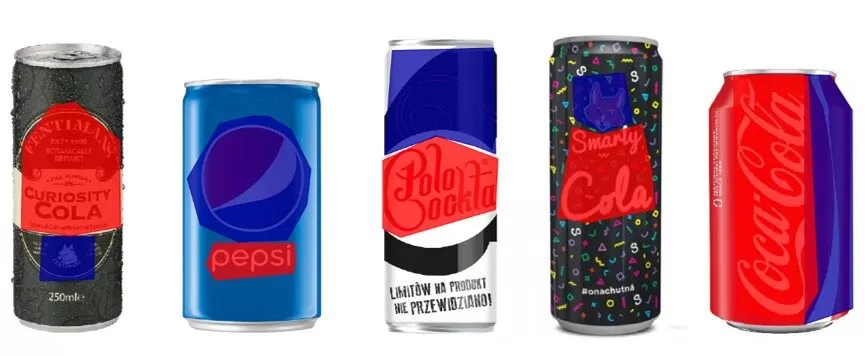
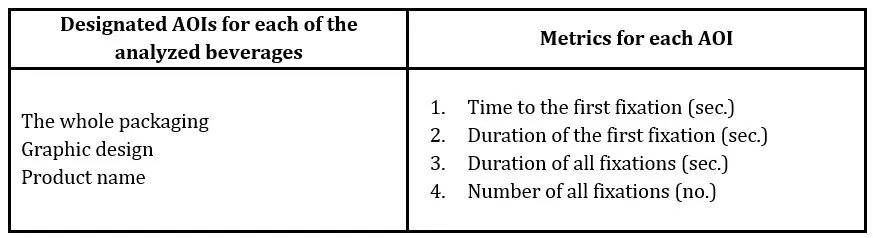
The analyzed products were assigned two areas of interest (AOIs) (fig. 2). All AOIs were defined and mapped onto the product image. Thanks to this approach, it was possible to collect metrics and conduct analyzes at the designated AOIs. Therefore, it was possible to define separate stimuli and isolate visual attention to specific attributes (Neuhofer et al., 2020). For the purposes of the study, the following AOIs were distinguished for each product: the whole packaging, graphic design, product name (Fig. 2).
Fig 2. The products tested with the AOIs mapped on them. The red AOI – product name,
the blue AOI – graphic design
Source: Author’s own elaboration
The group of respondents comprised 60 subjects – 45% female and 55% male. The study participants were mostly aged 20-40 (92%) and under 19 (7%).
Research Results
The results of the study were subjected to multiple regression analysis (Hayes, 2013) (Kim et al., 2020). The purpose of the process was to determine the strength of dependence of the metrics obtained during the eye tracking recording on the declared frequency of consumption of carbonated soft drinks. The adopted multiple regression model allows studying the influence of many independent variables (X1, X2,….Xk) on one dependent variable (Y). In the calculations, the procedure of progressive stepwise regression was used, the essence of which is the successive stepwise addition to the list of explanatory variables of those variables that have a significant impact on the dependent variable – until the best model is obtained, i.e., when the model includes only those explanatory variables that have a statistically significant impact on the variable Y. The regression analysis also included:
calculating the value of the multidimensional determination coefficient; this coefficient informs about the share of the total variability of results with the variability caused by the determined model;
calculation of the value of the standardized estimation error, which is a general measure of the accuracy of explaining the real relationship with the adopted model (in other words: it is a measure of the accuracy of the prediction based on the regression equation);
testing the significance of the regression coefficients with the Student’s t-test; the verification of the null hypothesis H0: b = 0 was performed at the significance level of p = 0.05.
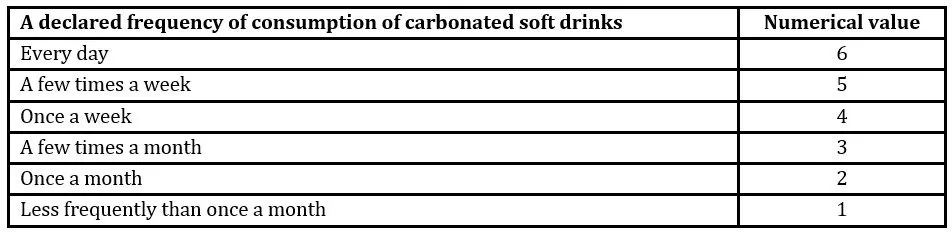
The dependent variable Y was the frequency of consumption of carbonated soft drinks as declared by the respondents. These data were obtained in the initial part of the study when the respondents completed the questionnaire. For this purpose, a 6-point verbal scale was used, which was then converted into a numerical scale as follows – tab. 1.:
Table 1: The conversion of the verbal scale to the numerical one
Source: Author’s own elaboration
For the first phase of model construction, 4 types of metrics characterizing the functioning of human visual apparatus were considered. These were: time to the first fixation, duration of the first fixation, duration of all fixations and the number of all fixations. The data were collected for all 5 analyzed cola-flavored carbonated soft drinks with the assigned AOIs (fig. 2).
Table 2: The areas of interest and designated metrics
Source: Author’s own elaboration
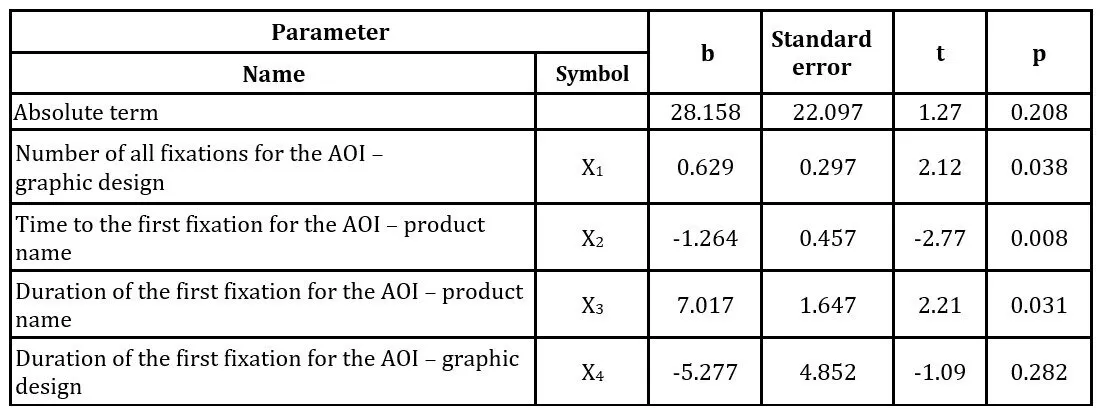
Thus, the model initially contained 12 variables, describing the eye movement behavior of the subjects. As a result of the adopted procedure, the number of variables was limited to 4 that had the greatest influence (Table 3).
Table 3: The model of dependence of consumption frequency on all 12 variables for cola-flavored carbonated soft drinks – the results of multiple regression analysis
Source: Author’s own elaboration
The results of the analysis presented in the table above show that the model with the best fit was obtained after including four parameters. Moreover, three regression coefficients are significantly different from 0 (p<0.05).
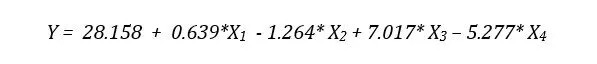
The dependence of the variable Y on explanatory variables: time to the first fixation for the AOI – product name and the number of all fixations for the AOI – graphic design is directly proportional (positive values of coefficient “b”). This means that the frequency of consumption of the beverages increases as the value of these variables goes up. The dependence of the variable Y on explanatory variables: duration of the first fixation for the AOI – graphic design and time to the first fixation for the AOI – product name is inversely proportional (negative value of the regression coefficient). This, in turn, means that with the increase in the value of these variables, the frequency of consumption of beverages goes down. The share of the model in the overall variability of the Y variable is 45% (R2 = 0.45). The accuracy with which the adopted model explains the relationship under study is 0.85 points (on a 6-point scale of frequency of consumption of beverages). Thus, the determined equation takes the following form:
The presented theoretical model allows drawing a conclusion that people who most often consume carbonated drinks look and focus their eyes on the name of the drink, with longer fixations on this area. On the other hand, the characteristics of getting acquainted with the graphic design of the product’s packaging indicate a large number of fixations, i.e., a greater number of shorter glances. In turn, the subjects who indicated a low frequency of consumption of carbonated soft drinks are characterized by the presence of longer-lasting fixations on the graphic design of the packaging and by a longer time before their eyes focus on the name of the beverage.
Conclusions
The study findings have revealed the existing differences in the visual attention of consumers during the act of choosing a carbonated soft drink, depending on the declared frequency of consumption of these beverages. As can be seen in the presented model, the visual activity of the subjects who consume such drinks frequently is different than those who rarely consume them. The use of the eye tracking method to obtain the data, as well as establishing AOIs and carrying out regression analysis, allowed for the identification of specific metrics, characterizing the method of selecting a carbonated soft drink. Although this analysis is highly theoretical, it is based on objective data since the visual attention of consumers and the resulting gazes that are involuntary and happen on the neurological level should be considered as such. The results of the study may serve as a guideline for companies that wish to gain a competitive edge on the carbonated soft drinks market. One of the conclusions that can be applied in business practice is that the subjects who rarely consume carbonated soft drinks pay more attention to the graphic design of the product. This can be valuable information for the companies that are planning to introduce new products to the market. The study findings suggest that the development of eye tracking methodology will allow the introduction of optimal designs of new packaging, well-adapted to the specific strategies of the enterprises in the ever-changing market. Apart from the examples of the use of eye tracking for the promotion of healthy behaviors already found in the literature, this study focuses on and presents the possibility of using eye tracking for the marketing purposes as well.
Acknowledgement
This project has been financed by the Minister of Education and Science within the “Regional Initiative of Excellence” Programme for 2019-2022. Project no.: 021/RID/2018/19. Total financing: 11 897 131,40 PLN.
References
Adeigbe, R T., Baldwin, S., Gallion, K., Grier, S. and Ramirez, A G. (2015), ‘Food and Beverage Marketing to Latinos: A Systematic Literature Review,’ Health Education and Behavior, 42(5), 569–582. https://doi.org/10.1177/1090198114557122
Anderson, K. and Wittwer, G. (2020), ‘A Model of Global Beverage Markets. Working papers in trade and development. – Canberra,’ Arndt-Corden Department of Economics, Crawford School of Public Policy, ANU College of Asia and the Pacific. ZDB-ID 2364347-X. – Vol. no. 05. [Online], [Retrieved February 02, 2022], https://www.econbiz.de/Record/amodel-of-global-beverage-markets-wittwer-glyn/10012431444
Brady, J., Farrell, A., Wong, S. and Mendelson, R. (2008), ‘Beyond Television: Children’s Engagement with Online Food and Beverage Marketing,’ Clinical Medicine. Pediatrics, 2, CMPed.S915. https://doi.org/10.4137/cmped.s915
Brownbill, A L., Miller, C L. and Braunack-Mayer, A J. (2018), ‘The marketing of sugar-sweetened beverages to young people on Facebook,’ Australian and New Zealand Journal of Public Health, 42(4), 354–360. https://doi.org/10.1111/1753-6405.12801
Gómez, P., Tamburini, C., Rodríguez García, V., Chamorro, V. and Carmuega, E. (2021), ‘Brand website marketing strategies for foods and beverages consumed by children and adolescents in Argentina,’ Arch Argent Pediatr. Feb;119(1):51-55. English, Spanish. doi: 10.5546/aap.2021.eng.51. PMID: 33458981.
Hayes, A F. (2013) Introduction to mediation, moderation, and conditional process analysis: A regression-based approach, New York: Guilford Press.
Kawasaki, A., Ohkawa, T. and Okamura, M. (2019), ‘Inter-group competition through joint marketing efforts and intra-group Cournot competition,’ J Econ 128, 203–224. https://doi.org/10.1007/s00712-019-00654-y
Kim, M A., Yoo, H J., Ares, G. and Lee, H S. (2020), ‘Effect of thinking style and consumption purpose on food choice: A case study with yogurt using a discrete choice experiment and eye-tracking,’ Food Quality and Preference, 86 (April), 104025. https://doi.org/10.1016/j.foodqual.2020.104025
Mansfield, E D., Ibanez, D., Chen, F., Chen, E. and de Grandpré, E. (2020), ‘Efficacy of “high in” nutrient specific front of package labels—a retail experiment with canadians of varying health literacy levels,’ Nutrients, 12(10), 1–17. https://doi.org/10.3390/nu12103199
Milic-Czerniak R. (2019) Badania marketigowe. Nowe metody badań i zastosowania, Difin, Warszawa.
Moya, I., García-Madariaga, J. and Blasco, M-F. (2020), ‘What Can Neuromarketing Tell Us about Food Packaging?,’ Foods, 9(12), 1856. https://doi.org/10.3390/foods9121856
Neuhofer, Z., McFadden, B R., Rihn, A., Wei, X., Khachatryan, H. and House, L. (2020), ‘Can the updated nutrition facts label decrease sugar-sweetened beverage consumption?,’ Economics and Human Biology, 37, 100867. https://doi.org/10.1016/j.ehb.2020.100867
Ploom, K., Pentus, K., Kuusik, A. and Varblane, U. (2020), ‘The Effect of Culture on the Perception of Product Packaging: A Multimethod Cross-Cultural Study,’ Journal of International Consumer Marketing, 32(3), 163–177. https://doi.org/10.1080/08961530.2019.1660752
Popova, L, Nonnemaker, J, Taylor, N, Bradfield, B. and Kim, A. (2019), ‘Warning Labels on Sugar-sweetened Beverages: An Eye Tracking Approach,’ Am J Health Behav. Mar 1;43(2):406-419. doi: 10.5993/AJHB.43.2.16. PMID: 30808479; PMCID: PMC6639808
Stoltze, F M., Barker, J O., Kanter, R., Corvalán, C., Reyes, M., Taillie, L S. and Carpentier, F R D. (2018), ‘Prevalence of child-directed and general audience marketing strategies on the front of beverage packaging: The case of Chile,’ Public Health Nutrition, 21(3), 454–464. https://doi.org/10.1017/S1368980017002671