Dinalestari PURBAWATI, Widiartanto WIDIARTANTO and Robetmi Jumpakita PINEM
Department of Business Administration, Universitas Diponegoro, Semarang, Indonesia
Volume 2023,
Article ID 516052,
Journal of Marketing Research and Case Studies,
8 pages,
DOI: 10.5171/2023.516052
Received date: 16 November 2022; Accepted date: 5 January 2023; Published date: 16 February 2023
Academic Editor: Tan Booi Chen
Cite this Article as:
Dinalestari PURBAWATI, Widiartanto WIDIARTANTO and Robetmi Jumpakita PINEM (2023), “Green Business Sustainability: SMES Strategy to Increase Business Performance and Save the Environment ", Journal of Marketing Research and Case Studies, Vol. 2023 (2023), Article ID 516052, DOI: 10.5171/2023.516052
This study aims to test the variables of green marketing, innovation, and ethics towards business performance. This study employs a quantitative approach with a survey method, with the population of the study consisting of all visitors who had visited ecotourism in Indonesia prior to the COVID-19 pandemic. This study’s sampling technique used is purposive sampling. The sample consisted of 24 samples, which were determined using the Machin formula with 30 sample details. The Likert scale is used in the measurement scale, with the options being strongly agree (5), agree (4), neutral (3), disagree (2), and strongly disagree (1). This study’s analysis consisted of descriptive analysis and verification analysis using SEM PLS. Path analysis is used to calculate the influence of strategies like green marketing, innovation, and ethics on business performance. The total respondents who became the sample in this study were 25 people. The results showed that the research model developed in this study was proven to strengthen theoretical concepts in the field of management after being tested using the Structural Equation Model (SEM). The concept can be used as a reference by other scholars. It is hoped that, as a result of these findings, management research will be realized that is mutually sustainable and synergistic for the company in supporting the improvement of business performance, enabling the accomplishment of all of the organization’s goals.
Keywords: Green Marketing, Sustainability, Business Performance
Introduction
Indonesia is one of the nations with the greatest number of micro and small enterprises. In 2018, according to data from the Ministry of Cooperatives and Micro, Small, and Medium Enterprises, the number of microenterprises increased to 63,350,222 from 62,106,900 in 2017. Total growth is approximately 2%, or 1,243,322 people. This is a positive development because it demonstrates that the number of microbusinesses in Indonesia continues to expand and is pretty substantial. This increase continues to exhibit an upward tendency. In addition, micro- and small enterprises based on 2018 data indicated that the number of small businesses was as high as 783,132, an increase of around 3.44%, or 26,043 compared to 2017 data, which indicates that the number of small businesses is approximately 757,090. Micro- and small-business expansion suggests a continuing positive trend, indicating that more people are beginning their own firms, particularly micro-enterprises. In comparison to micro-enterprises, small- and medium-sized firms, the overall number of micro- and small-sized businesses is relatively high.
Compared to micro and small firms, the total number of micro, small, and medium-sized businesses is quite low. If the overall number of micro- and small-sized businesses is equal to the total number of micro, small, and medium-sized businesses, then the percentage of micro, small, and medium-sized firms is roughly 99.90%. One of the developed countries will be marked with a high number of entrepreneurs or business actors for example the United States but Indonesia continues to make improvements and experience positive growth (Women, 2015). MSMEs in Indonesia are still experiencing a lot of constraints both in production, marketing, processing, information technology and human resources who are considered less competent in this field. Responding to the obstacles that are still being faced by the MSME world in Indonesian government is at the forefront of the Indonesian economy and also ASEAN by building a climate for SMEs and fostering communities in developing MSMEs. The government continues to stimulate to increase the number of Micro and Small businesses while keeping afloat.
The objective of environmentally friendly product innovation is to generate new or improved goods with a reduced environmental impact. “green product innovation” refers to ecologically friendly products that utilize recyclable or renewable resources. This also includes product enhancements aimed at minimizing energy consumption and preventing pollution during product use, since it can reduce the environmental impact of production inputs. (Horbach, Rammer, and Rennings, 2012) Reduced air pollution and other pollutants are among the environmental benefits of utilizing eco-friendly items.
Green product packaging is environmentally friendly and recyclable, which helps to reduce garbage around us. Additionally, green products can cut energy usage during production (Deuze, Mark., 2008; Okada, 2010). According to Porter (1985), if an organization can cut production costs and increase economic efficiency by implementing environmental measures, focusing on products that have a considerably lower environmental effect throughout their life cycles can increase sales of green products. Murar (2012) shown that green product innovation enhances a company’s competitiveness and performance substantially. In addition, Ardyan et al. (2017) revealed evidence of green innovation’s capacity to considerably raise sustainable competitive advantage and enhance the performance of SMEs. According to Reguia (2014), the ability of a company to develop a competitive advantage through product innovation is connected with its sustainability. Triguero et al. (2013) indicate that SME firm owners who prioritize collaborating with research institutions, organizations, and universities to create customer demand for eco-friendly products are more effective in implementing all sorts of eco-innovation. In addition, their research indicates that, while cost reductions are essential for eco-process innovations, market share has a significant positive effect solely on eco-product and eco-organizational innovations.
Conceptually, eco-innovation remains conceptually fragmented; new research is required to address eco-innovation from a complete perspective. It is challenging to comprehend how it pertains to small and medium-sized enterprises. We use ICT (information and communication technology) in conjunction with local knowledge to fill the void left by previous academic research. As a type of community outreach for the batik manufacturing industry, this study contributes to the overall body of knowledge.
Although not all products have a significant environmental impact at each stage of their life cycles, green product innovation is a multi-phase process in which the three main environmental focuses of materials, energy, and pollution are highlighted based on the product’s environmental impact at each stage of its life cycle. Consequently, regardless of the origins of their materials, energy, or pollutants, the vast majority of physical items have a significant impact on the environment during at least one phase of their life cycle (Dangelico et al., 2010). To meet the demands of customers and society, companies that care about the environment engage in “green marketing,” which comprises providing ecologically friendly products and services (Soonthonsmai, 2007). Currently, green marketing is a huge corporate trend (Kassaye, 2001).
Consumption that is green or ethical can aid in achieving sustainability. Many businesses acknowledge that they are a part of the larger community. They must act in an environmentally responsible manner (Mainiieri et al., 1997). Marketers are emphasizing green markets and incorporating environmental concerns into their marketing strategies. Successful green products are based on prior studies and assessments of the marketing and tactics of green products.
Method
This study adopts a quantitative approach and survey methodology, with the population consisting of all tourists that visited Indonesia’s ecotourism sites prior to the COVID-19 pandemic. The sample method utilized in this study is purposive sampling. The total number of respondents who comprised the sample for this study was 25. The measurement scale uses the Likert scale, with the following options: strongly agree (5), agree (4), neutral (3), disagree (2), and severely disagree (2). (1). The analysis for this study consists of descriptive analysis and verification analysis utilizing SEM PLS. Path analysis is used to determine the impact of green marketing, innovation, and ethics practices on corporate performance.
Result and Discussion
A descriptive analysis was undertaken to obtain a picture of how respondents perceived the study variables. This study’s factors are green marketing, innovation, and the impact of ethics on corporate performance.
Validity Convergent
Validity Convergent refers to the idea that a construct’s manifest variables should have a strong correlation. Using the loading factor for each construct indicator within the PLS program, convergent validity can be determined. In order to assess convergent validity, the loading factor value must be more than 0.60, as well as the average extracted (AVE) and communality values. The following are the results:
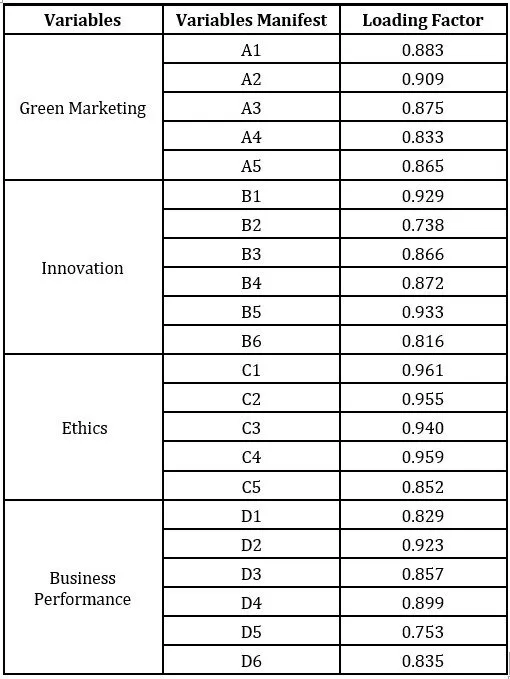
Table 1. Validity Convergent
According to the data in the table above, each manifest variable’s loading factor value is more than 0.7 for all indicators, which means that all indicators are considered valid and capable of measuring variables correctly.
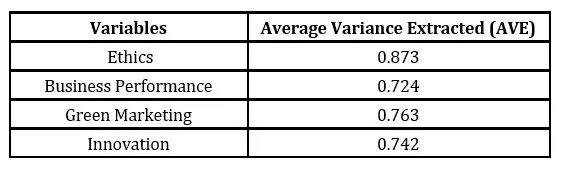
Table 2. Average Variance Extracted (AVE)
As can be seen in the table above, all four latent variables have AVE values greater than the intended value of 0.5. Consequently, all variables are acknowledged as valid when used to explain the latent variable, demonstrating that the usage of the manifest variable satisfies the AVE requirements. Consequently, it is asserted that all manifest variables satisfy the convergence validity criteria. If the scores from the idea-testing instrument or other methods of measuring the idea demonstrate a substantial association, convergent validity is demonstrated to be true.
Discriminant Validity
Discriminant validity refers to the idea that manifest variables for various constructs shouldn’t have a lot of correlation. Cross Loading testing is a method that can be used to test discriminant validity, as shown in the accompanying table.
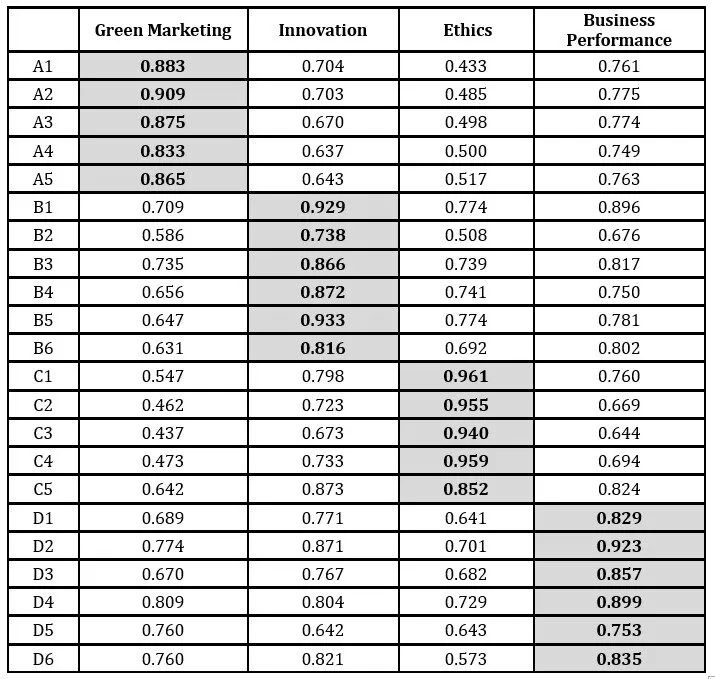
Table 3. Cross Loading Factor Test Results
As observed in the results table of the PLS software, the indicators used to measure the latent variables meet the requirements, as the correlation cross-loading factor for each latent construct is greater for the proper indicator than for the other constructs. In addition to the cross-loading test, the Fornell-Larcker criterion test can be employed to validate discriminant validity. This test compares the square root of the AVE for each construct to the correlation value between the model’s constructs. The results of the Fornell-Larcker Criterion test are listed below.
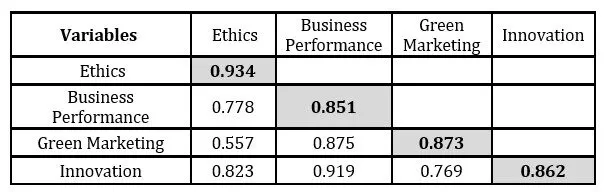
Table 4. Discriminant Validity Test (Fornell-Larcker Criterion)
According to the results in the table above, the model has good discriminant validity because all of the root values obtained for each variable are higher than the correlation. Cronbach’s Alpha, Composite Reliability, and excellent Rho A all have a desired value of 0.7. The results of reliability testing for each construct are listed below.
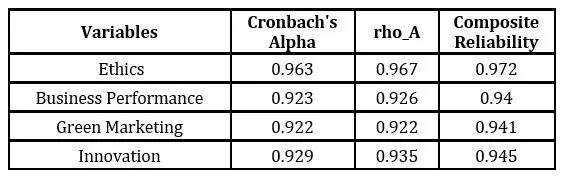
Table 5 Reliability Test
The acquisition of Composite Reliability for each latent variable is larger than 0.7, as well as the acquisition of Cronbach’s Alpha and Rho-A values greater than 0.7, as a result it can be concluded that the questionnaire items match the reliability criteria. These output results are shown in table 4.13. This demonstrates that every indicator consistently measures every variable. The following figure displays the results of the bootstrapping method’s entire structural model testing.
Path Coefficient and T-Statistics
The following are the results of the calculation of the path coefficient and t-Value in the research shown in table 4.14 below:
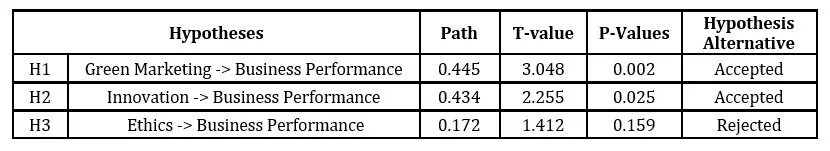
Table 6 Path Coefficient and T-Statistics
The obtained t-count is 1.412, and the value of the t-table is 1.65 (t-count t table) based on the provisions indicated earlier. This means that H01 is approved and H1 is rejected, indicating that ethics and business performance have no meaningful relationship. The premise that there is a significant relationship between ethics and corporate performance is therefore rejected.
R square
The effect of the dependent variable can be displayed by the R-square value. The following is the acquisition of the R-square value.
Table 7. R Square test
Source : Processed data
The coefficient of determination (R-square) provided in the table above reveals that the business performance variable has an R-square value of 0.923, indicating that the green marketing, innovation, and ethics variables explain 92.3% of the variance in business performance. According to the route coefficient, Green Marketing has the greatest influence on Ambidexterity Innovation, with a path value of 0.44, while the Ethics variable has the least influence, with a path coefficient of 0.172. The results of this study on the link between research variables are explicable based on the results of the data analysis.
The following is an explanation of this study’s findings: The results of the calculation yielded a t-count of 3,048 and a t-table value of 1.65 (t count > t table). This indicates that if H01 is rejected and H1 is accepted, green marketing has a major impact on corporate performance. Thus, the notion that green marketing has a major impact on corporate success can be accepted. The calculation yielded a t-count of 2.225 and a t-table value of 1.65 (t-count is more than t-table). This indicates that if H01 is rejected and H1 is accepted, innovation has a substantial impact on corporate performance. Thus, it is possible to accept the claim that innovation has a considerable impact on corporate performance. The calculation yielded a t-count value of 1.412 and a t-table value of 1.65 (t-count t-table). This indicates that H01 is accepted and H1 is rejected, demonstrating that ethics has no substantial impact on corporate success. Thus, the notion that there is a significant relationship between ethics and business performance is refuted.
Conclusion
This study’s conclusions based on its finding, are as follows:
The first hypothesis demonstrates that green marketing has a significant impact on the success of a business and that this is acceptable. The second plausible hypothesis demonstrates that innovations have a significant impact on the success of a corporation. The third hypothesis does not demonstrate that ethics have a significant impact on the success of a firm, hence it can be rejected. After testing with the Structural Equation Model, it was determined that the research model established in this study bolsters theoretical concepts in the field of management (SEM). The concept might serve as a reference for other academics.
As a result of these findings, it is envisaged that management research would be conducted that is mutually sustainable and synergistic for the company, contributing to the enhancement of business performance and facilitating the achievement of all organizational objectives. This research is expected to contribute to the advancement of science in the form of extra research and the development of science, particularly in the field of management. Applying new methods to spread this research into other disciplines of study is one method of advancing science.
References
Ardyan, E., Nurtantiono, A., Istiyanto,B dan Rahmawan , G. 2017. Green Innovation Capability As Driver Of Sustainable Competitive Advantages And Smes Marketing Performance. International Journal of Civil Engineering and Technology. volume 8, issue 8, August 2017, pages 1114–1122
Asian Development Bank. 2001.“Entrepreneurship and SMEs in Souheast Asia, The long term Strategic Framework of the Asian Development Bank
Barney, J. B. 1991. Firm Resources and Sustained Competitive Advantage. Journal of Management, volume 17.
Barney, J. B. 2001. Gaining and Sustaining Competitive Advantage. Addison Westley Reading. Mass
Chang, C. H. 2011. The influence of corporate environmental ethics on competitive advantage: the mediation role of green innovation. Department of Business Administration, volume 104, issue 3, pages 362-
Day, G. S., & Wensley, R. 1988. Assesing Advantage: A Framework for Diagnosing Competitive Superiority. Journal of Marketing, pages 1-20.
Deuze, Mark. 2008. “Convergence Culture in the Creative Industries”. International Journal of Cultural Studies, Los Angeles, London, New Delhi and Singapore, www.sagepublications.com, volume 10, issue 2, pages 243- 263.
Eneizan, B.M and Wahab. K.H. 2016. Effects of Green Marketing Strategy on the Financial and Non-Financial Performance of Firms: A Conceptual Paper. Arabian Journal of Business and Management Review. Volume 6, Issue 5.
Grant, R.M. 1991. The Resource-Based Theory of Competitive Advantage: Implications for Strategy Formulation. California Management Review, volume 33, issue 3, pages 114-135.
Hariadi, 2002 Haryadi Rudi. 2009. Pengaruh Strategi Green Marketing Terhadap Pilihan Konsumen Melalui Pendekatan Marketing Mix.Journal of Economic and Business.Vol.4, No.7. Hal:52-72
Karel, S., Adam, P dan Piszczur Radomír. 2013. Strategic Planning and Business Performance of Micro, Small and Medium-Sized Enterprises. Journal of Competitiveness, volume 5, issue 4, pages 57-72.