College of Engineering and Computing, Al Ghurair university, Academic city, Dubai
Volume 2021,
Article ID 750757,
Journal of Mobile Technologies, Knowledge and Society,
7 pages,
DOI: 10.5171/2021.750757
Received date: 3 November 2020; Accepted date: 22 February 2021; Published date: 14 September 2021
Cite this Article as:
M.Anwar. and Rashmi Rani (2021)," A Machine Learning Approach to Identify Impact of Mathematical Courses Performance in Engineering Degree Program", Journal of Mobile Technologies, Knowledge and Society, Vol. 2021 (2021), Article ID 750757, DOI: 10.5171/2021.750757
The educational research has been continuously and effectively benefitting from the Machine Learning techniques since its emergence. Among others it included the multiple regression which is a multivariate technique used to determine the correlation that may exist between a dependent variable and a combination of multiple predictor variables. This paper presents a multiple linear regression model to analyze students’ final grades in four mathematics courses and their correlation with the response variable, the CGPA. The outcome shows that students’ performance in mathematics courses may affect their overall performance in a university degree program. Finally, the study recommends that higher education institutions and faculties are required to work collaboratively and hard towards adopting learner-centered teaching methodologies for improving students’ performance in mathematics.
Keywords: Multiple regression, CGPA, R-Square.
Introduction
Mathematics and Basic Science are an integral part of any engineering degree program. Mathematical technique models and reasoning are integral to most areas of engineering and the discipline depends on mathematics for many of its fundamental underpinnings [ACM (IEEE) CE. 2016]. Science provides us with the laws of the natural world and Mathematics helps us establish relationships among different components [1]. Mathematics is comprehensively used in Physics, structurally in graphics and practically in engineering. Mathematical courses play a key role in the understanding and application of engineering programs. Enhancing student’s academic enactment via Mathematical courses is one of the prime services of the academic community of higher education. Mathematical courses can develop intellectual maturity. Engineers use Mathematics as a tool for solving numerous boundary value problems and optimization problems. According to the information by United States National Research Council (1989), simple skills of Mathematics and geometry are essential for almost all occupations. Tobias (1978) emphasized the importance of basic high school mathematics knowledge in the examinations required for recruitment in the public and private sectors.
Mathematics provides a language for working with ideas relevant to computer engineering, specific tools for analysis and verification, and a theoretical framework for understanding important ideas [ACM (IEEE) CE2016]. Mathematics and science courses are considered for creating an overall style or ethos for a specific computer engineering degree program. [ACM (IEEE) CE. 2016]
The article presents a multiple linear regression model to analyze the student’s final grade (CGPA) based on his/her grade in four Mathematical courses, namely Calculus I, Calculus II, Linear algebra and Differential equations, in an Engineering degree program. In the first level of Calculus, students get knowledge about limits, continuity, derivative and integration with application. In the second level of Calculus, the concept of Improper integral, functions of several variables, Multiple Integral, Polar curves, Sequence and Series are introduced to the students. In the Linear Algebra course students learn Matrices and Determinant with applications, Eigenvalues and Eigen vectors, Analytic functions etc. The calculus and differential equations are required to support engineering materials such as communications theory, signals and systems, and analog electronics. The analysis of continuous functions is fundamental to all engineering programs [ACM IEEE CE. 2016]. Linear algebra is required for solving networks of equations describing voltage/current relationships in basic circuits and is used in engineering application areas such as computer graphics and robotics [ACM IEEE CE. 2016].
In this paper, multiple regression analysis has been used as a technique to visualize the influence of Mathematical courses on the final grade of an engineering student. Multiple Regression is a set of techniques used to analyze the relationship between two or more independent variables and a dependent variable. Multiple linear regression is defined as a multivariate technique for determining the correlation between a response variable Y and a combination of two or more predictor variables, X, Montgomery and Peck, 1982; Draper and Smith, 1998; Tamhane and Dunlop, 2000; and McClave and Sincich, 2006. It can be used to analyze data from causal-comparative, correlational, or experimental research.
Multiple linear regression is one of the most widely used statistical techniques in the educational research. It is regarded as the “Mother of All Statistical Techniques”. Many colleges and universities develop regression models for predicting the GPA of incoming freshmen. The predicted GPA can then be used to make admission decisions. In addition, many researchers have studied the use of multiple linear regression in the field of educational research. The use of multiple linear regression has been studied by Shepard (1979) to determine the predictive validity of the California Entry Level Test (ELT). In a research by Draper and Smith 1998, the use of multiple linear regression is illustrated in a prediction study of the candidate’s aggregate performance in the G. C. E. examination.
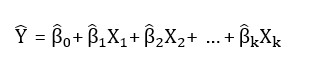
A multiple linear regression model based on a number of independent (or predictor) variables X, X1, …, Xk can be obtained by the method of least squares, and is presented by the following equation
where Y = response variable, X =predictor variables, βk = the population regression coefficients, and ε = a random error, (Mendenhall et al., 1993; and Draper and Smith, 1998). Multiple linear regression allows for the simultaneous use of several independent (or predictor) variables, X, to explain the variation in the response variable Y. The fitted equation is presented as follows:
where = predicted or fitted value and = estimates of the population regression coefficients.
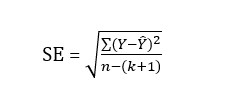
Multiple standard error of estimate measures the error in the predicted value of the dependent variable.
Where:
Y is the observation.
Y is the value estimated from the regression equation.
n is the number of observations in the sample.
k is the number of independent variables.
SE is the standard error of estimate.
Methodology
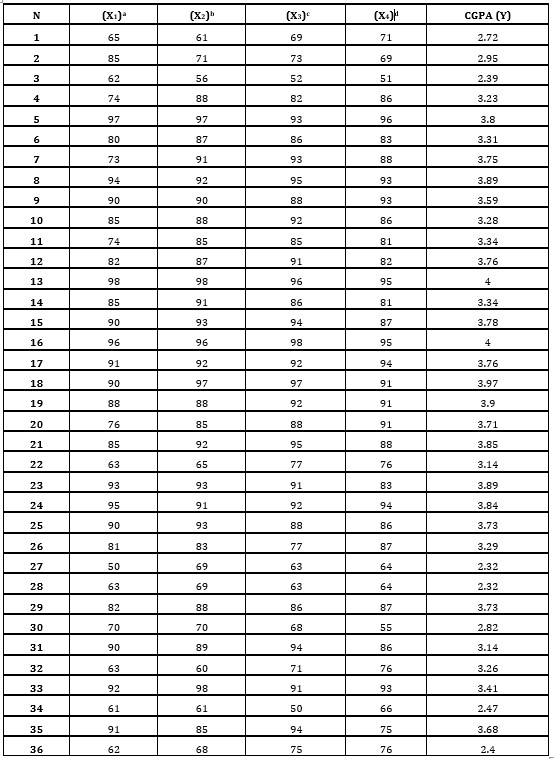
In this resourceful experimental study, the inference of Mathematical courses over the CGPA of a student in an engineering degree program was observed. In this study, marks obtained by 36 students in four different mathematical courses and their CGPA have been analyzed via multiple regression method. , as shown in Table 1.
Table 1: Marks and CGPA of students
a: Calculus I
b: Calculus II
c: Linear Algebra
d: Differential Equations
The objective of this study is to develop an appropriate multiple linear regression model to relate the student’s CGPA (considered as the dependent or response variable Y) to the student’s scores in four Mathematical courses (considered as the independent or predictor variables X). It examines how well the scores in mathematical courses could be used to predict the student’s GPA.
This study investigates the feasibility of the use of the four constraints, namely X1, X2, X3 and X4 for 36
undergraduate students enrolled in an engineering degree program in 4 mathematical courses. The multiple regression method is used to analyze the result. The following model was developed to find the expected CGPA.
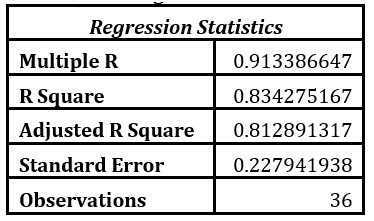
Table 2 shows the Regression statistics obtained from the data, and Table 3 shows the standard error (SE) and regression coefficients.
Table 2: Regression Statistics
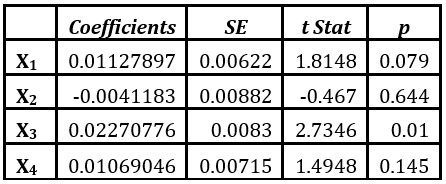
Table 3: Statistical Data
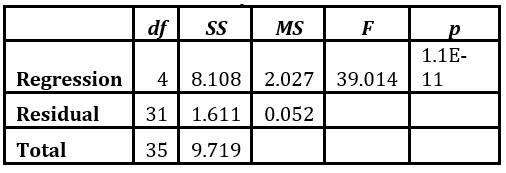
Table 4: Analysis of Variance
Interpretation of the Results
From the analysis of the variance table, it is observed that the p-value is very small 1E-11. This implies that the model estimated by the regression procedure is significant at an α -level of 0.05. Thus at least one of the regression coefficients is different from zero.
The p-values for the estimated coefficients of X1 and X3 are 079 and 0.01, respectively, indicating that they are significantly related to Y. The p-value for X2 is 0.644, indicating that it is probably not related to Y and the p-value for X4 is 0.0145, indicating that it is less related to Y at an α -level of 0.05.
The R2 value in the regression output indicates that only 4 % of the total variation of the Y values in terms of their mean can be explained by the predictor variables used in the model. The adjusted R2 value indicates that 81.3% of the total variation of the Y values in terms of their mean can be explained by the predictor variables used in the model. As the values of R2 and adjusted R2 are not very different, at least one of the predictor variables contributes to the prediction of Y.
The variance of the regression of the dependent variables for any given set of the independent variables is estimated by the residual mean square (s2) which is equal to ss(residual) divided by an appropriate number of degrees of For this problem, s2 = 0.051968 and s = 0.22796.
Since the ‘s’ value is very small, it indicates that the prediction is meticulous.
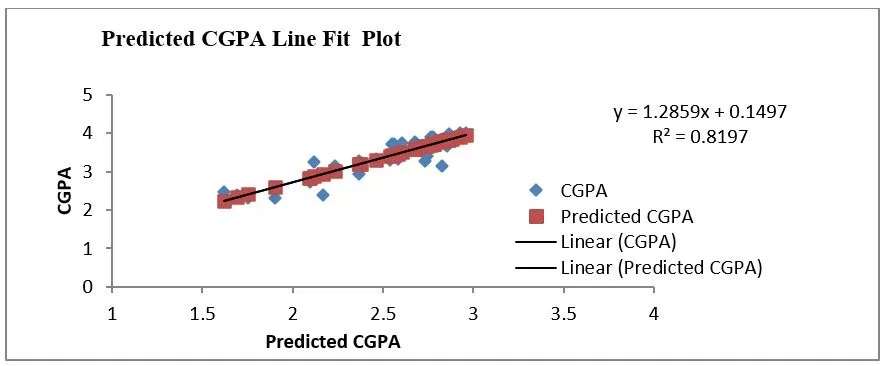
Figure 1
Figure 1 shows the regression plot of CGPA versus predicted CGPA. The R value for this plot is 0.905387 which indicates that the CGPA and the Predicted CGPA are strongly related. The R2 value in this plot is 0.8197 which shows that the regression predictions fit decisively.
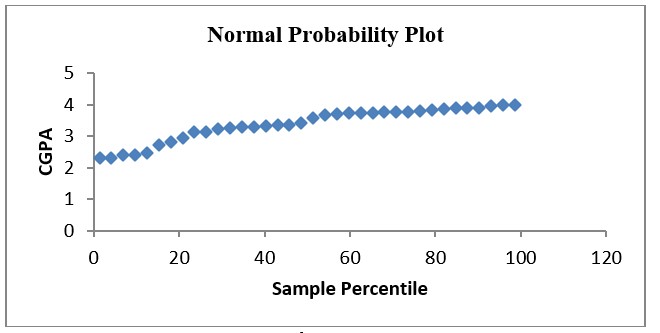
Figure 2
Figure 2 shows the Normal probability plot. From the plot, it is observed that there exists an approximately linear pattern. This indicates the consistency of the data with a normal distribution.
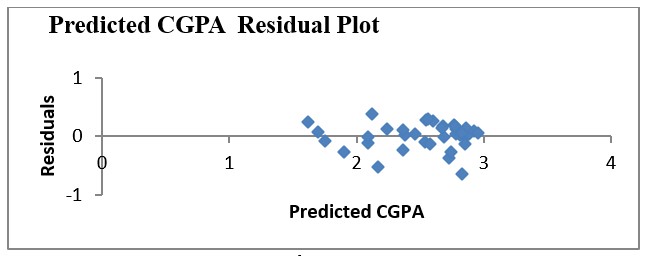
Figure 3
Figure 3 provides the predicted CGPA residual plot.
A residual plotis a graph that shows the residuals on the vertical axis and the independent variable on the horizontal axis. If the points in a residual plot are randomly dispersed around the horizontal axis, a linear regression model is appropriate for the data; otherwise, a non-linear model is more suitable [2]. This plot shows a random pattern which is a good fit for the linear model.
Conclusion
From the above analysis, it appears that the multiple regression model for predicting the student’s CGPA is useful and adequate. The ‘s’ value in the given study is very small which implies that at least one of the predictor variables contributes to the prediction of CGPA.
Bianchi F, Stobbe K, Eva K (2008), Comparing academic performance of medical students in distributed learning sites. The McMaster experience. Medical Teacher (30), 67-71
Borg, R., and Gall M. D. (1983). Educational Research – An Introduction (4th edition). New York & London: Longman.
Draper, R., and Harry S. (1998). Applied Regression Analysis (3rd edition).
New York: John Wiley & Sons,
Mendenhall, , James E. R., and Robert J. B. (1993). Statistics for Management and Economics (7th edition). Belmont, CA: Duxbury Press.
Montgomery D.C. (1997) Design and Analysis of Experiments, 4th ed. Wi1ey, New York
Montgomery, C., and Peck, E. A. (1982). Introduction to Linear Regression Analysis. New York: John Wiley & Sons, INC.
Senfeld, (1995). “Math anxiety and its relationship to selected student attitudes and beliefs,” Ph. D. Thesis. Coral Gables, Florida: University of Miami.
Shakil, (2001). “Fitting of a linear model to predict the college GPA of matriculating freshmen based on their college entrance verbal and mathematics test scores,” A Data Analysis I Computer Project. University Park, Florida: Department of Statistics, Florida International University.
Tamhane, C., and Dunlop, D. D. (2000). Statistics and Data Analysis: From Elementary to Intermediate (1st edition). Upper Saddle River, NJ: Pearson Prentice Hall.