Military University of Technology in Warsaw, Warsaw, Poland
Volume 2019,
Article ID 240550,
Journal of Organizational Management Studies,
17 pages,
DOI: 10.5171/2019.240550
Received date: 21 February 2019; Accepted date: 14 May 2019; Published date: 27 August 2019
Academic Editor: Mihai Caramihai
Cite this Article as:
Bogdan ĆWIK and Katarzyna ŚWIERSZCZ (2019)," Efficiency of Weak Signals’ Detection: Interpretive Aspects of Threat Signal Perceiving ", The Journal of Organizational Management Studies, Vol. 2019 (2019), Article ID 240550, DOI: 10.5171/2019.240550
The problem of many warning systems is the phenomenon of so-called “surprise”, involving a failure to spot the symptoms of upcoming undesirable events in time. This often happens despite the presence of technologically advanced detection and monitoring systems. It is believed that the solution to this problem has been solved by the concept of weak signals. However, in many situations, it is noted that methods based on this concept have limited effectiveness, especially in relation to threat signals. The aim of the paper is to propose a modified theoretical as well as methodological approach to the problem of monitoring weak signals, especially for those that contain information about an impending threat. The scientific methods used in the paper include: a questionnaire survey, the observation of cases and their ex-post evaluation, analysis and criticism of source materials, logical analysis and logical construction. Additionally, heuristic methods – the “fresh look” and analogical transfer methods – were used. Deductive reasoning and enumerative induction were incorporated into the above methods. The result of the work is a presentation of the conception of warning signal strength, as well as models related to this problem.
Keywords: weak signal, weak signal detection, warning signal, weak signal visibility.
Introduction to the Problem
Contemporary reality is characterized by turbulence, complexity, increasing dynamics of change, dissipation and impermanence. As a result, modern organizations are forced to function in conditions of increasingly complex, variable, dispersed and unstable external and internal influences. One result of the processes taking place is the growing number of detrimental events and phenomena that increasingly affect these organizations and their environment. They take various forms and occur in different areas. Phenomena incurring the greatest threat (dangerous) are sudden, violent and disastrous, often taking the form of catastrophes. In this article they will be referred to as “surprises”. There are more and more examples of such phenomena and they occur despite the presence of technologically and organizationally advanced monitoring, early warning or risk management systems. At the same time, after the fact, information and opinions arise on how the symptoms of upcoming events could have been spotted earlier, avoided or at least reduced in terms of range and scale (Bieńkowska, 2015; Ćwik, 2017a; Radosiński & Tomczak, 2015).
The problem of interpreting “surprises”, including increasing the effectiveness of their detection, is addressed in Igor H. Ansoff’s concept of weak signals. However, it seems that despite the veracity of this concept, in practice there are problems with identifying and detecting the right weak signals. This is also indicated by the results of our own research, which were carried out in 87 Polish enterprises, while examining the symptoms of a “sick company”.
The aim of this article is to present and propose a modified theoretical as well as methodological approach to the problem of monitoring weak signals, especially those containing information about impending threats.
The fruit of this study includes a presentation of the results of the research on identifying and detecting the symptoms of a “sick company”, along with conclusions on the possibility of using them as weak signals to predict bankruptcy. Along with the model of threat development trajectory, models for the dimensions of consequential threat perception, warning signal visibility, warning signal detection and unstable equilibrium will be presented. All the above should facilitate a better understanding and improve the methodologies of threat signal recognition.
State of knowledge in the studied area
The interest in the subject of “weak signals” is connected with the problems of strategic management in contemporary organizations. These organizations function in circumstances of growing and multidimensional dynamics of changes in the external and internal environment (Corral-Quintana et al, 2016; Legna Verna, 2010). The pace of these changes, their scope and their diversity are growing. The result of the processes taking place is growing uncertainty (Rossel, 2011; Świerszcz & Ćwik, 2017). This uncertainty significantly limits the possibility to effectively predict the consequences of currently occurring phenomena or recent developments in the environment of contemporary organizations (Coenen et al, 2018; Magruk, 2018). At the same time, there is a growing need in organizations to respond effectively to changes taking place and to anticipate them (Koivisto et al, 2016; Rossel, 2011; Ćwik, 2017b; Włodarczyk, 2018). The environment (both external and internal) of the contemporary organization contains infinite amounts of information that are free and easily accessible, yet increasingly difficult to interpret. It is believed that one answer to the aforementioned problems may be the concept of “weak signals.”
The concept of “weak signals” was introduced by Igor H. Ansoff (Ansoff, 1975; Antoniou, 2006). Elaborating this concept, Ansoff pointed that contemporary strategic planning should be conducted in the context of a turbulent environment in which surprises and discontinuities are normal. The basic assumption of this concept is that all these surprises and discontinuities are preceded by weak signals that, with increasing information noise, are not always noticed. In recent years, the interest in weak signals has increased (Day & Schoemaker, 2005; Heinonen & Hiltunen, 2012; Hiltunen, 2008; Ilmola & Kuusi, 2006; Lesca & Lesca, 2011, 2014; Saul, 2006; Thorleuchter & Van den Poel, 2013, 2015; Uskali, 2005). This concept is a response to intensifying problems in the area of strategic management, with the growing number of errors in strategic decisions, with a lack of proper detection of the trajectory of future developments, and a lack of management skills and ability to predict uncertain changes that are often treated as accidental phenomena.
Besides, a group of authors has emerged, looking for weak signals in the Internet space, treating this space as the primary source of weak signals. As a result, methods of scanning the Internet space are being tested and developed, including ones for the automatic searching and monitoring of weak signals as well as for social media research (Thorleuchter & Van den Poel, 2013, 2015).
Another area of research is the weak signals relating to surprises due to the occurrence of highly unlikely events, which are referred to as “black swans”(Aven, 2013; Flage & Aven, 2015; Hajikazemi et al, 2016; Makridakis & Taleb, 2009; Taleb, 2007).
The need to look for methods of detecting weak signals, as well as of limiting surprises, is related to the results of research carried out by the authors among members of the public services: police, army, border guards, fire brigades, emergency services. These results indicate the inconvenience of “surprises” during their operational activities – reported by more than 75% of respondents.
Examination of the symptoms of a “sick company”
While looking at the “weak signals” of the bankruptcy symptoms of enterprises, a decision was made to examine the utility of using the symptoms of a sick company as early signals of bankruptcy. Research in this area was carried out in 2008-2009, which was a period of severely negative phenomena related to the outbreak of the global financial crisis. At that time, many companies in Poland were in the need for information on possible variants of the development of the situation in the global economic system, as well as in the need to assess the current situation in their company. Taking advantage of the fact that several dozen Polish companies asked for an analysis to be conducted, and in March 2009 they made the financial statements for 2008 available, while also agreeing for the management and employees to participate in the research, several studies were carried out in parallel (Ćwik, 2017a), including a questionnaire survey examining the symptoms of a “sick company” combined in tandem with an indicator analysis and the launch of several early warning models for bankruptcy. The study included 87 SME companies and checked 46 symptoms of a “sick company”. In March 2009, the financial markets were in a precarious situation. Many companies faced financial problems, and their employees worked under severe stress, many of whom assessed that their company was in crisis and that they did not rule out the possibility that their company might go under. The research involved asking employees at various levels (senior manager, accountant, financial department employee, operative) survey questions, with the first point being whether or not they perceived a crisis in the company, plus 46 questions about the intensity of a “sick company’s” symptoms. In total, 341 surveys were received. Each of the respondents gave answers, subjectively determining the intensity of the occurrence of a given symptom according to the following scale: does not occur, slight, small, distinct, quite strong, strong, very strong, critical condition.
At the same time, based on financial reports received from the audited companies, the values of indicators for the DuPont method were determined (Zeff, 2003) as well as the values of early warning models obtained on the basis of a discriminant analysis, the so-called Z-score models (Radosiński & Tomczak, 2017), where for each of the surveyed companies the values for the 12 models used in Poland were determined, including the Altman model (Altman et al, 1977). Next, it was ensured that the models do not approach or exceed the limit values, indicating that the given company is or will be in danger of bankruptcy. In addition, each of the surveyed companies was monitored over the course of one year, checking whether the company declared bankruptcy.
The aim of the research was to check which of the symptoms of a “sick company” could be considered to be a “weak signal” giving advanced warning about a company’s impending bankruptcy.
The analysis of the research results did show significant discrepancies in the assessment of the company’s bankruptcy risk level, obtained using the DuPont analysis and Z-score models, as well as discrepancies in the employees’ assessments regarding the company’s financial state. It should also be noted that individual Z-score models often showed varying bankruptcy risk assessments. Therefore, it was assumed that the “bankruptcy risk” assessment would be issued when 9 out of 12 Z-score indicators exceeded the limit values. In total, both methods (DuPont and Z-score) indicated a risk of bankruptcy for 69 (79.3%) of the surveyed companies. In addition, 89% of the surveyed employees indicated subjectively that there was a crisis in their companies and that they might be facing bankruptcy. But further observations showed that only 5 (5.7%) of the surveyed companies actually ended up going bankrupt during the year.
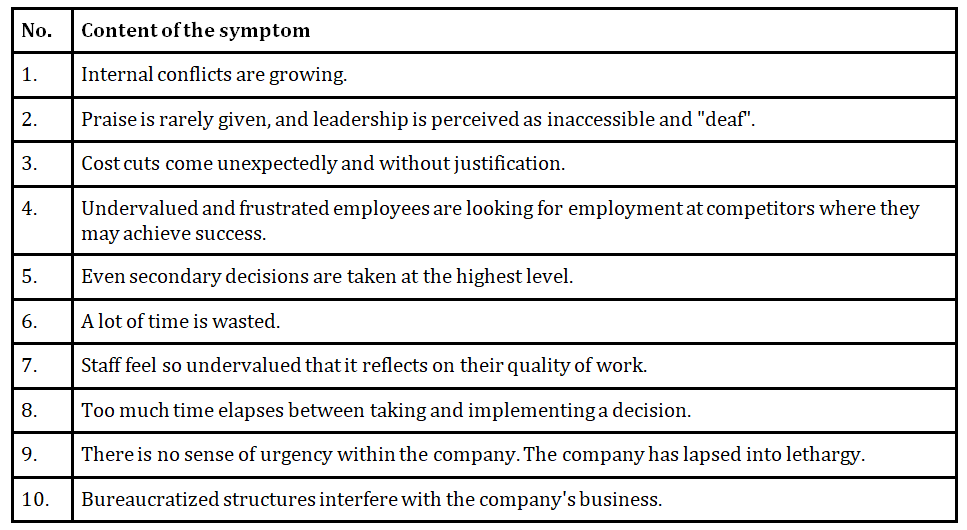
Among the companies in which the DuPont and Z-score models indicated the risk of bankruptcy and in the 5 companies that did go bankrupt during the year, the following (Tab. 1) symptoms of a “sick company” were most often indicated and the intensity of their occurrence was more noticeable than in the others.
Table 1: Ranking of the “symptoms of a sick company” in companies in
which the indicators showed a risk of bankruptcy
Source: own work
The general conclusion from the study is that among the “symptoms of a sick company” examined, universal and statistically significant warning signs for the company’s collapse were not found. This indicated their limited usefulness. Therefore, the “symptoms” presented in Table 1 may be treated only as a proposal for more in-depth studies.
A different methodological approach to threat monitoring
It seems that from the point of view of monitoring, a certain dissonance arises in the interpretation of the concept of a threat, in cases that concern monitoring the threat of a flood, gas explosion in a mine, or company collapse. This dissonance results from the fact that the monitoring of each of these dangers requires the observation of certain values related to a given threat – the water level in a river, the gas concentration in a mine, or the financial flows in a company. Therefore, it is proposed that two categories of threat should be considered in warning systems – namely, causes and consequences (effects). The former shall include all the measurable quantities related to the possibility of something negative happening. These quantities may be called causal threats and they are related to so-called impacts (interactions), thus including all physical, chemical, mechanical, biological, psychological, economic, social and other forces that exert or can possibly exert a negative influence on the monitored system. What distinguishes causal threats (impacts) are quantitative features whose occurrence is recorded (read) directly or indirectly by correlating their presence with the intensity of their magnitude (symptoms). Appropriate instrumentation and diagnostic methods such as technical, medical, social, economic, geological, meteorological or ecological, environmental and others are helpful in recognizing the presence and measuring causative threats (Brito-Morales et al., 2018; Ratajczak et al., 2018; Trofimov & Averkina, 2007; Wang & Zhao, 2018). At the same time, reading the values of these threats is usually of an objective nature, i.e. if repeated by other people, the same results will be obtained, and possible discrepancies may be the result of measurement error. The second category of threats is related to the consequences of negative impacts, expressed either in the form of characteristics illustrating the system’s ability to perform specific actions, or the occurrence of scenarios for undesirable events or phenomena (outbreak of war, transportation disaster, gas explosion in a mine, breakage of flood embankment, etc.). These effects can be called consequential threats, which are manifested in the form of qualitative changes – the disintegration of the system, bankruptcy, catastrophe, explosion, devastation of the terrain.
In connection with the above, it is proposed that when monitoring warning signals, they should be divided into causal and consequential threats. The causal threat will concern specific impacts and will be defined as the potentiality, possibility or threat of exceeding the maximum limits of these impacts, which can trigger significant qualitative changes in the structure of the system or in its functioning (occurrence of consequential threats). However, consequential threat will signify the potentiality, possibility or threat of a specific negative effect – for example, a forest fire, the poisoning of a river, the collapse of a company, a stock market drop, a methane explosion in a mine, a transportation or industrial disaster, an outbreak of a conflict and others.
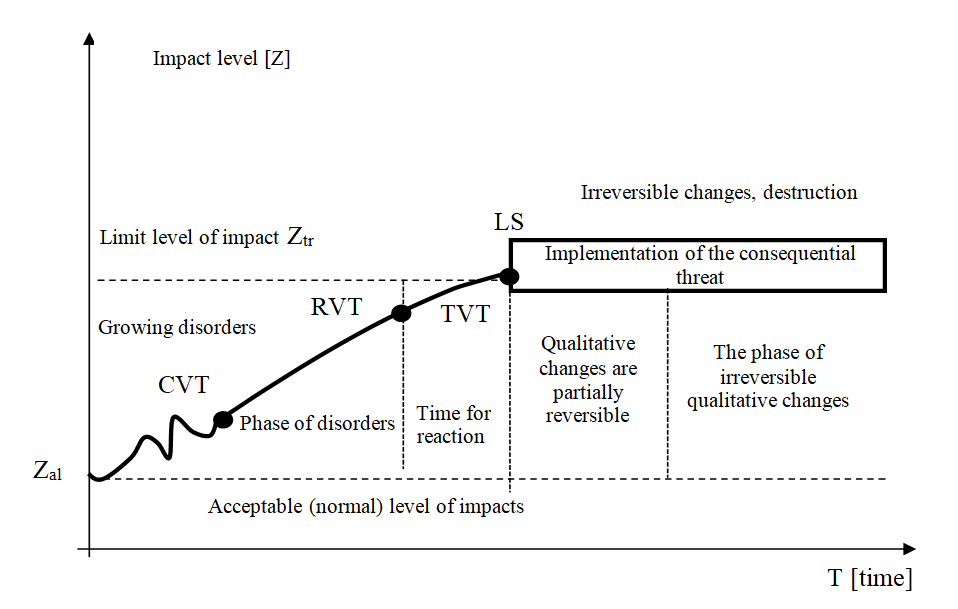
With this approach, the monitoring of threats will include the observation of causes (including sources of origin, mechanisms of formation or transfer as well as mechanisms of their development), and also the consequences that these threats may have. This approach combines causal and consequential threats and its model is presented in Fig. 1. The model shows the growth pattern of a certain negative impact (causal threat), presented in Fig. 1 as the bold line created by a set of CVT points indicating the current value of the causal threat. This line can be called the threat development trajectory. Over time, the CVT values change, and an example of these changes is depicted in Fig. 1, where the letter Z on the vertical axis denotes the size of the observed impact on a given system, with the duration of this impact on the horizontal axis. Under normal circumstances, the system almost always operates at a certain acceptable level of negative impact, i.e. falling within the existing standards (according to some, the concept of weak signals should look for opportunities in this area). After the CVT point has exceeded the permissible Zal amount, the level of observed influence becomes so significant that the first changes in the system’s ability to perform tasks start to be visible (system characteristics deteriorate), but in the first phase, these are mainly quantitative changes, which the system is able to correct – the concept of weak signals refers to this area. At this stage, one can talk about disturbances that occur when conditions, forces and possibilities exist to stop or change the unfavourable course of events. However, when the level of this impact exceeds the threshold value of Ztr, permanent quantitative and qualitative changes in the system begin, and the visible effects become irreversible. This moment in Fig. 1 is denoted as LS (limit state) and this is a result of exceeding the threshold value of the causative threat monitored (TVT). As seen in Fig. 1, there are two breakthrough points in considering threats – on the side of causal threats this is the threshold value of threat (TVT), whereas on the consequential side it is the system’s limit state (LS). After they are exceeded, a monitored threat occurs – a forest fire begins, the water begins to overflow the flood embankment, a company’s employees are laid off or its assets. The time for reaction at a given moment depends on the distance between the RVT and TVT. The set of possible CVT values in a given time interval represents the threat development trajectory.
Fig. 1: Model of threat development trajectory
Source: own elaboration
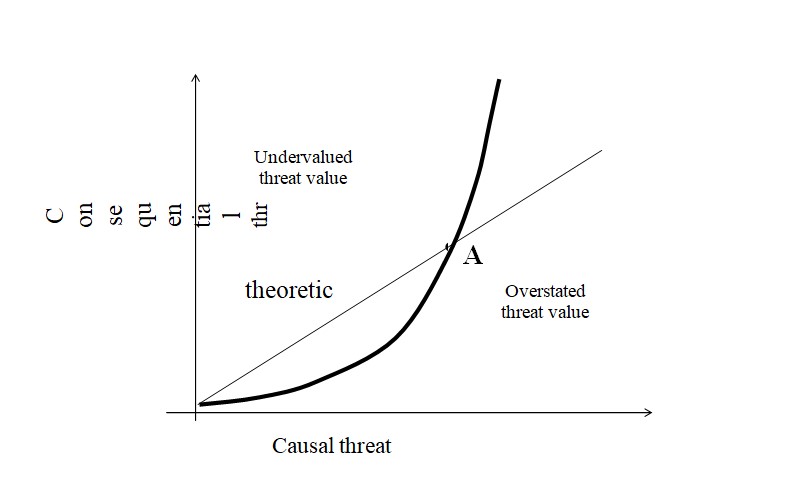
In the area of early warning against threats, it is important to determine the moment of the beginning when preventive measures should be implemented. This moment in Fig. 1 was marked as the recognition of the threshold value of the impact (consequential threat) – RTV. The time for response, i.e. the time to generate a warning signal and take preventive measures, is equal to TVT – RTV. The theory of weak signals focuses on the fastest possible recognition of RTV. The situation is unambiguous, when TVT = LS, because then, after the causal value of the threshold value has been reached, the consequential threat occurs, for example when the water level in the river is exceeded (causal threat), as a result, the areas start to be flooded (occurrence of the consequential threat) – permanent qualitative changes begin. However, in many natural or social systems, it is not always possible to put an equal sign between TVT and LS. Differences are mainly the result of the fact that the perception of a causal threat results, in general, from direct readings of quantitative values, using a simple or complex measuring apparatus, and is generally objective in nature. However, the perception of the consequential threat is usually the result of interpretation processes carried out in the mind of the perceiver and is generally of a subjective nature. For this reason, this type of perception will be referred to as detection. Many researchers and experts probably do not take this into account. An important factor of which we are not fully aware is, therefore, the differences in the perception of the magnitude of causal and in the perception of the magnitude of consequential threats. These differences are presented in Fig. 2. Theoretically, there should be a linear relationship between the size of the causal threat registered and the perceived consequential threat, but in practice the perceived magnitude of the consequential threat against the background of the observed causal threat is sometimes undervalued or overstated.
Figure 2: Perceiving of consequential and causal threats
Source: own elaboration
The perception of a causal threat is generally carried out with the help of specialized measuring equipment, and it also proceeds according to standard methodologies. In contrast, the perception of the consequential threat is realized on the basis of thought processes and occurs in the mind – as a result, it can be subject to various biases, disruptions or distortions. Therefore, it may be useful to take into account the “conception of dimensions of consequential threat perception” in terms of improving the effectiveness of the detection of threats. The conception of such a model is presented below. Preliminary studies on a sample of 72 students indicate that it is possible to consider the magnitude of the perceived consequential threat Wz in nine basic dimensions:
Wz = < P, L, D, Ds, S, F,C, V, I >,
Where:
P = probability, the higher the probability of a given threat occurring, the greater the perceived threat seems to be.
L = amount of losses, the greater the loss resulting from the occurrence of a given consequential threat, the greater the size of the threat perceived.
D = distance, the practical presence of this dimension results from a sense of awareness of whether the consequences of the occurrence of a given consequential threat may appear immediately or be postponed.
Ds = disastrousness; the greater the catastrophic nature of a given threat, the greater the magnitude of the perceived threat.
S = size; the greater the territorial range or the larger the number of victims, the greater the size of the perceived threat.
F = frequency; where the frequency of undesirable events, such as accidents, is high, the persons on whom the research was carried out attributed a higher level of threat to them.
C = controllability, the possibility of affecting the course of events, awareness of control over the course of the situation reduces the level of perceived threat.
V = voluntariness, people are willing to accept much more dangerous activities voluntarily than those imposed on them.
I = imaginability; the ability to imagine the consequences of a given consequential threat increases or decreases the perceived threat.
Distortions and cognitive interferences occur in the aforementioned dimensions, having a negative impact on the effectiveness of the recognition of warning signals.
It is also suggested that in the presented above model, only three values of each dimension should be considered, which would correspond to three levels of significance for each of the dimensions:
1 − insignificant (irrelevant);
2 − partially significant (significant);
3 − very significant.
This division results from the fact that a similar automatic categorization of significance is processed mentally and the readiness to activate cognitive and energy resources of the organism is connected therewith (Ćwik, 2017b).
The presented dimensions of consequential threat perception can have a significant impact on perception effectiveness and the related consequences. These dimensions will locate the vector of perceived threat in three basic areas of possible levels of consequential threats: insignificant, significant and strong. These areas should be correlated as much as possible with the actual levels of causal threats.
The analyses conducted indicate the subjectivity of the perception of consequential threats, as they are the result of internal processes in the human mind, related to the interpretation of the causal threats being monitored. From a psychological point of view, the magnitude of the perceived effect threat can be described as a “sense of threat”. The awareness of the dimensions of consequential threat perception and the related possibilities of creating disruptions or distortions in perception should be taken into account in the applied risk monitoring methodologies.
The concept of threat presented is a preliminary proposal of approach to an issue that can be further developed. It seems that it sorts out the issues, and allows the problem to be recognized from a systemic perspective, generalizing the approach to understanding the concept of threat, and also creates conditions for the development of methodology, measurement and assessment of threats. It attempts to explain the causes of disruptions, distortions and biases in the perception of threats (Ćwik & Świerszcz, 2018).
It should also be emphasised that the magnitude of perceived consequential threats also depends on so-called individual differences, i.e. differences in intelligence, abilities, personality and temperament (Friedman & Miyake, 2017; Mishra & Lalumière, 2011; Morss, Cuite, Demuth, Hallman, & Shwom, 2018; Reeder, 2017).
Assuming the above-mentioned models are correct, it may be noted here that the symptoms of a “sick company” studied in the previous point had the characteristics of a consequential threat; therefore, it was difficult to use them as volumes that can be monitored for early warning against bankruptcy.
Visibility of the warning signal
When addressing the problem of using weak signals in early warning systems, the problem of the visibility of these signals should also be taken into account. It should first of all be considered whether the observed signal is weak because the perceived causal threat is small or the magnitude of the perceived effect threat is negligible (in the 9 individual dimensions).
The visibility of the warning signal may be illustrated using the visibility model of a warning signal. This model is based on the assumption that the warning signal is a sign. Such a sign may take the form of graphic symbols, sounds, light waves, scents and others (Sant’Anna, 2018). The whole idea is based on the concept of a sign developed by Charles S. Peirce, who treated a sign as a connection of three things: the sign itself, the content of the sign and the actually existing object connected with the sign (Barnouw, 1987; Hausman, 1993; Hausman & Anderson, 2012; Hiltunen, 2008; Kilstrup, 2015). By modifying Charles S. Peirce’s concept of a sign and treating a specific impact (Ćwik, 2017b; Świerszcz, 2017) as directly related to the content of the sign, the model of the warning signal visibility is presented in the form of a structure containing the following components: interpretation – I, representation – R and impact – O. The impact occurring in this structure as a specific force (physical, psychological, economic, social) is in fact a monitored causal threat which, after exceeding the limit values, will trigger the occurrence of a specific consequential threat. An observer monitoring the threat reads the “representation” (R) of this impact. For example, lines read directly on a thermometer will be a representation, and the impact correlated with this representation will be the temperature. Nevertheless, this still requires interpretation, for example, the read value of 40 degrees Celsius may indicate a significant threat in the case of human body temperature or ambient temperature, but in the cooling system of an internal combustion engine or in a home heating system it denotes normal operation. Reading other representations will be similar, for example: pressure, frequency, voltage or current intensity.
As a result, a model should be adopted in which the character Z will be represented as the following vector:
Z = ,
where each of the components of this vector will be characterized by a specific level of visibility (Fig. 3). The visibility of individual components may be expressed on an ordinal scale and this visibility should be considered on three levels:
− non-significant;
− partially (medium) significant;
− very significant.
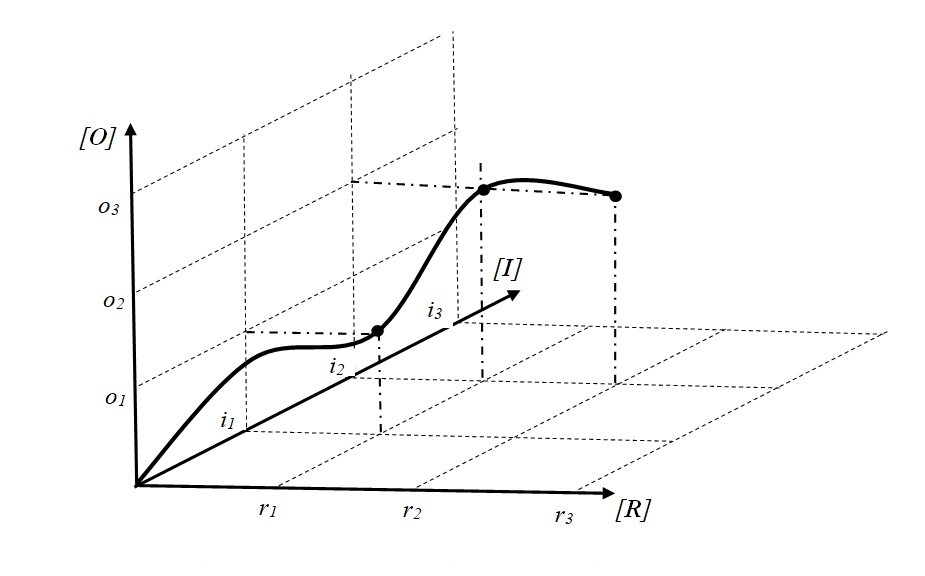
The bold line visible in Fig. 1 is the trajectory of visibility of a warning signal, which also shows the trajectory of the signal strength.
Fig. 3. Model of the weak signal’s visibility
Source: own work
The bold line, visible in Fig. 3, shows the trajectory of signal development, which can be treated as a weak signal or a strong signal. In the model in Fig. 3 it was conventionally assumed that individual components present the so-called “generalised visibility”, where the (O) component actually expresses the objective size (force) of the impact O < o1, o2, o3>. The “representation” (R) component expresses the visibility of the representation as the level of its perception by the senses R <r1, r2, r3>, while the “interpretation” (I) component expresses the level of recognition of the elements of this component by the mind I <i1, i2 , i3>.
The model of the warning signal visibility presented in Fig. 3 is connected with the actual magnitude of the impact and is correlated with its objective visibility (“representation” component) and subjective visibility (“interpretation” component). As a result, 27 signal visibility areas or 27 signal strength areas can be distinguished. With this approach, the signal will be more visible (stronger), the greater the size of the impact or the more visible its representation, or the more advanced its interpretation. Along the trajectory of signal development (Fig. 3), it is possible to identify areas where the size of the impact is very significant, and its objective and subjective visibility is insignificant or partially significant. In this situation, the signal may be treated as weak while in fact it is strong. One can also indicate areas where the signal is in fact weak while the visibility of representation and interpretation is highly significant. It should also be noted that in practice most of the risk monitoring methodologies are based on an assumption that the visibility of all three components of Z < i3, r3, o3 > is highly significant.
Most observers believe that by monitoring threats, they monitor the impact directly, i.e. by reading the current value of the CVT threat (Fig. 1). In fact, it runs according to the model of Fig. 3, where the co-ordinates of the CVT point are located along the component of the “impact” (O), except that the magnitude of this impact is not directly read, but only its “representation” (R). The value of the causal threat is read here, and the reading itself is objective. The measurement methods and measuring apparatus, including diagnostic methods on one hand, and neurobiological processes on the other, mainly implemented by the senses and related areas of the nervous system, are responsible for the visibility of the “representation” component (Barth, Giampieri-Deutsch, & Klein, 2012; Nathan Kutz, 2018; Norwich, 2014; Takeda, 2018; VanRullen, 2016).
The third component of the perceived sign is the “interpretation” (I), which is connected with the occurrence of complex cognitive processes in the mind of the perceiver, while the visibility level of this component expresses the degree of recognizing necessary (temporal, spatial and functional) relations concerning the CVT and the possibility of its impact on the LS. This is connected with the occurrence of more sophisticated mental processes: thinking, reasoning or imagining (Ackerman & Thompson, 2017; Bunge & Souza, 2009; Reichert & Quinn, 2017). At the same time, three main trends can be distinguished where interpretation processes are generally considered: philosophical, psychological and cognitive. It should be noted, however, that this is not a clear division and there is a certain amount of overlap. Thus, the philosophical trend is mainly the so-called philosophy of perception (McDowell, 2013; Merleau-Ponty, 2014; Sant’Anna, 2018; Schellenberg, 2010, 2014, 2016; Siegel, 2012; Takeuchi, Hirabayashi, Tamura, & Miyashita, 2011). Secondly, the psychological trend is cognitive psychology (Aly & Turk-Browne, 2016; Eichenbaum, 2004; Menary, 2007; Miyashita, 2004; Shipstead, Lindsey, Marshall, & Engle, 2014). Lastly, the cognitive trend involves the issue of knowledge representation (Patel & Jain, 2018), cognitive schemes (Oblak, Ličen, & Slapničar, 2018; Rosch, 1975; Schank & Abelson, 1988), mental models (Johnson-Laird, 1983) and cognitive categorization processes (Deng & Sloutsky, 2016; Oakes, 2008; Solomon, Medin, & Lynch, 1999; von Rosing, Kemp, Hove, & Ross, 2015; Yager, 2018; Zhu, Cai, Sun, & Yang-yang, 2015). The basic structure in which the basic stages of cognitive processes take place, including the processes of perceiving the sign, is the observer’s mind, which makes perceptions based on specific patterns or cognitive schemes (scenarios, prototypes, frames, scripts) that occur in every perceiving entity as the so-called “personal model of the world”. Each person monitoring threats has an individual model of the world, constituted by the individual cognitive experience of the observer, expressed by a multiplicity of situational models and appropriate simulations in which he or she participated either directly or indirectly.
The warning signal model presented in this subsection develops the issue regarding the visibility of the signal being detected, creating the theoretical basis for introducing additional elements to the applied risk monitoring methodologies and enabling improvement in the effectiveness of the detection of threats.
Universal model of detecting a warning signal
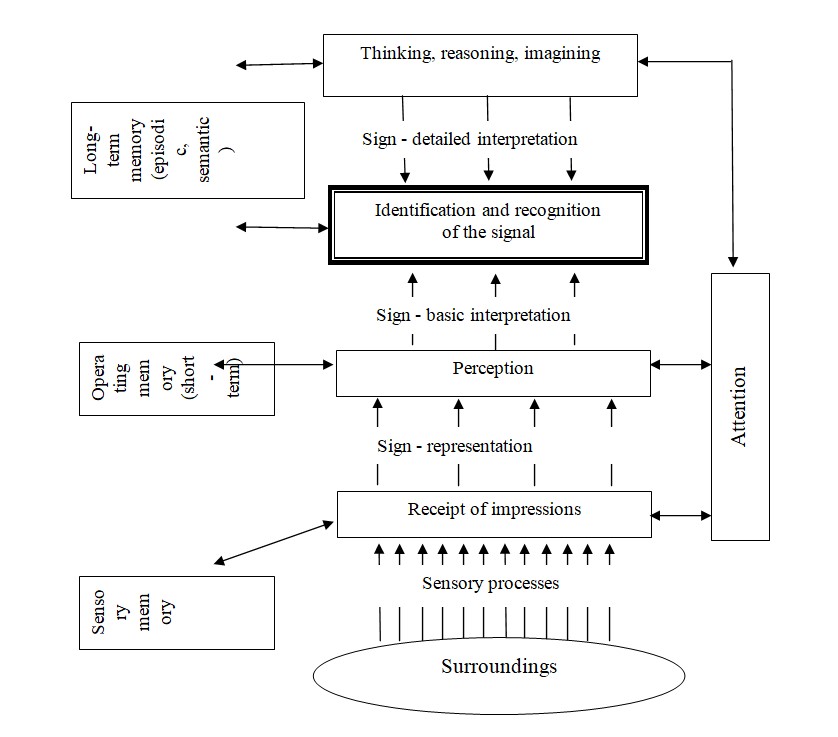
Warning signals, including weak signals, are detected whereby the detection is the result of perception and related processes associated with the reading and recording of signals by the senses and their processing by the mind. Full signal reading, including the interpretation of the read representations, results in detection. A universal model of detecting warning is presented in Fig. 4.
Fig. 4: Model of integrated detection of a warning signal
Source: own work
The universal model of weak signal detection should be taken into account in the analysis, as well as in the methodologies of monitoring weak signals (Fig. 4). In this model both sensory processes implemented by the senses as well as cognitive processes implemented by the mind – i.e. attention, memory, thinking, reasoning and imagination – were integrated. This model presents two streams of information transfer processes with opposite directions, i.e. bottom-up processes (upward arrows) from the external environment and top-down processes (arrows pointing downwards) from the mind (Fig. 2). The result of detecting the signal is due to “bottom-up” and “top-down” processes, and depends on time, emotional state, personality, temperament, mood, health, motivation, intelligence, as well as on the cognitive resources of the detector.
During the detection process, there is a multistage selection and gradual interpretation of the stimuli read from the environment, which are recorded in the bottom-up processes, and then coded as representations of signs and subjected to a basic interpretation. At the same time, as part of top-down processes (higher mental processes), categorisation and assigning meaning to the representations received occurs (thinking, reasoning, imagining), that is, a detailed interpretation occurs, culminating in the final identification and recognition of the signal. In the case of detecting weak signals, the attention system of the detector plays a particularly important role. Evolutionary, this is a system that protects the mind of the detector from information overload from the environment (Neisser, 1976; Treisman, 1964, 1982). Attention can be imagined as a state of readiness of the mind’s structures to perceive and, consequently, to identify and detect a specific object or phenomenon. In the weak signal monitoring methodologies, this system should be particularly taken into account.
Limit States
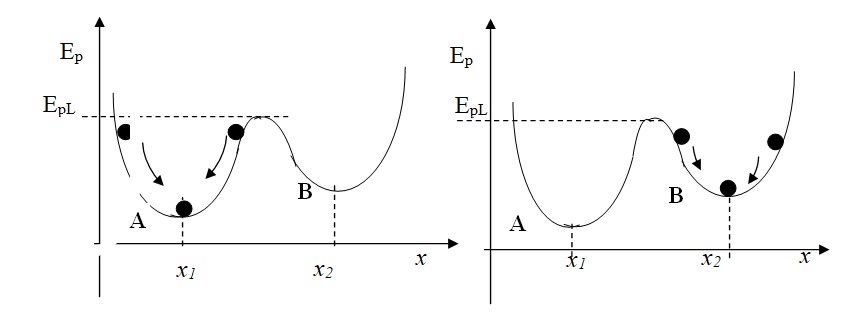
When addressing the problem of detecting weak signals, it is necessary to take into account limit states or unsteady equilibrium states both in the external environment and in the internal environment of the organisation (enterprise). A characteristic of these states is that even a small amount of exposure can lead to sudden and extensive qualitative changes. One general example of an object in a state of limit stress is a ball (Fig. 5), which, while undergoing energy interactions, moves up and down in recess A. Ep is the potential energy of the ball. When Ep<Epg the ball is inside recess A in a stable equilibrium state and after the energetic interactions have ceased, it returns to its initial state at the point x1. If Ep = EpL the ball is in a limit state, which is an unsteady equilibrium between recess A and recess B and in this state, a very small stimulus, such as a small increase or a slight decrease in energy input, will either cause it to remain in recess A, or move to the new B. The ball’s movement to recess B can be treated as a qualitative change in the system in which the ball operates.
Fig. 5: Model of an object in the limit state
Source: own work
In a stable equilibrium, the system is not sensitive to initial conditions, including disturbances, and the momentary release from the state of equilibrium ends with the return to the state of equilibrium, which is the state with the smallest energy. However, in a state of unstable equilibrium, even a small change in the initial conditions, even a small disturbance, can cause loss of balance as well as qualitative changes in the conditions of the system’s functioning. Loss of equilibrium by one system may result in the transfer of impacts to other systems, which, going into unstable equilibrium, will trigger this state in the remaining ones – causing a cascade (domino) effect. In environments where an unbalanced equilibrium prevails, a chain of reactions can occur, reminiscent of the “butterfly effect” known from chaos theory. An example of exceeding and not taking into account limit states is probably the avalanche blockade of financial resources in banks in September 2008. In 2007-2008, most banks in the US functioned in a limit state due to strong tensions in the financial markets caused by subprime loans. In addition, according to the publication of the International Monetary Fund (Cihak, 2007), in the years 2006-2008, banks introduced (in their structures) a new system of automatic bank securities, the so-called Stress-tester 2. As indicated by the results of observations of interviews with analysts in the media about the situation of financial markets, among others in the USA, it was found that a few days before 14 September 2008, these media began to provide information that in some US banks there is a shortage of funds due to automatic blockades of security systems. The cause of these shortages could have been the automatically activated Stress-tester 2, and when these automatic blockages of loans occurred in subsequent banks, the situation got out of hand. At one point, the Lehman Brothers bank went bankrupt, and the financial crisis spilled into the global financial markets, affecting not only banks, but also financial institutions and the economy of most countries. It should be noted that this is, however, only our own speculative analysis, as no detailed research has been carried out on this problem.
Systems functioning under limit stress or tension conditions also include risk-taking enterprises and other organisations functioning “on the edge”, (Waldrop, 1993) as well as systems that apply modern logistics solutions, such as just in time, quick response, lean manufacturing, lean management and similar systems. At the same time, it may appear that the natural inclination of systems such as an enterprise is to direct the trajectory of their development towards the so-called “edge”, which is an intermediate state between order and chaos – in the case of enterprises this is expressed by searching for opportunities, innovations, investing, which is connected with undertaking more and more risky ventures (Raynor, 2007). The systems encounter the most effective development strategies “on the edge” (Cohen, 2002; Ćwik, 2018; Hopej Kamiński, 2010; Lewin, 2000; Waldrop, 1993). For this reason, a contemporary enterprise is a system whose most effective development trajectories are “on the edge”. Hence the growing number of risk-taking companies, which at the same time contributes to creating conditions for unstable equilibrium, and thus increasing tensions and stress in the systems and their environment, resulting in more danger of launching crisis cascades. Under such conditions, even small impacts can cause significant and surprising qualitative changes, which in ex post analysis are indicated as weak signals. Therefore, monitoring methodologies of weak signals should also include the monitoring of limit states and unsteady equilibrium.
Conclusion
The article presents a proposal of a different approach to the issue of warning against risk, as well as to reading warning signals. As a recipe for increasing uncertainty and growing problems with effective strategic management, Igor H. Ansoff’s concept of weak signals is beginning to lose its usefulness in some areas. The methodology of monitoring these signals should be enhanced to improve the effectiveness of weak signals. From the point of view of monitoring weak signals, it is important to divide the monitored threats into causal threats that are related to specific impacts, and consequential threats that are associated with specific outcomes. Another factor involves taking into account the visibility of the weak signal, which can sometimes appear as weak due to insufficient objective or subjective visibility. The monitoring party should be aware that in total, 27 areas of warning signal visibility can be distinguished. Another aspect of monitoring weak signals should be limit states and conditions of unstable equilibrium in the external and internal environment of the organisation. Under these conditions, a small change of seemingly insignificant impact may in fact lead to significant and extensive changes in quality. We should also emphasise the role of the mind’s attention system formed by the evolutionally developed need to eliminate information overload of the senses from the environment.
Altman, E. I., Haldeman, R. G., and Narayanan, P. (1977), ‘ZETATM analysis A new model to identify bankruptcy risk of corporations,’ Journal of Banking & Finance, 1(1), 29-54, doi.org/10.1016/0378-4266(77)90017-6.
Ansoff, H. I. (1975), ‘Managing, Strategie Surprise by Response to Weak Signals,’ California Management Review, 18(2), doi.org/10.2307/41164635.
Antoniou, P. H. (2006), The Igor Ansoff Anthology, P. E. Sullivan Ed.
Aven, T. (2013), ‘On the meaning of a black swan in a risk context,’ Safety Science, 57, 44-51, doi.org/10.1016/j.ssci.2013.01.016.
Barnouw, J. (1987), ‘Peirce, Semeiotic, and Pragmatism,’ New Vico Studies, 5, 187-191, doi:10.5840/newvico1987520.
Bieńkowska, A. (2015), ‘Analiza rozwiązań i wzorce controllingu w organizacji,’ Oficyna Wydawnicza Politechniki Wrocławskiej, Wrocław.
Cihak, M. (2007), ‘Introduction to Applied Stress Testing, IMF Working Paper, 07.
Coenen, J., van der Heijden, R. E. C. M., and van Riel, A. C. R. (2018), ‘Understanding approaches to complexity and uncertainty in closed-loop supply chain management: Past findings and future directions,’ Journal of Cleaner Production, 201, 1-13, doi.org/10.1016/j.jclepro.2018.07.216.
Cohen, B. (2002), ‘The Edge of Chaos: Financial Booms,’ Bubbles and Chaos: Wiley.
Corral-Quintana, S., Legna-de la Nuez, D., Legna Verna, C., Hernández, J. H., and Romero-Manrique de Lara, D. (2016), ‘How to improve strategic decision-making in complex systems when only qualitative information is available,’ Land Use Policy, 50, 83-101, doi.org/10.1016/j.landusepol.2015.09.004.
Ćwik, B. (2017a), A Survey on Willingness to Provide Warning Information within A Company during Crisis. Proceedings of the 2017 International Conference on Management Science and Management Innovation (MSMI 2017), 31, 170-174, doi:10.2991/msmi-17.2017.38.
Ćwik, B. (2017b), ‘Multidisciplinary approach to the analysis of the process of perceiving warning signals’ Security and Defence Quarterly, 2 (15), 21-37.
Ćwik, B. and Świerszcz, K. (2018), Conception of Warning Signals in Organizational Monitoring Systems, Proceedings of the 31th International Business Information Management Association Conference (IBIMA 2018), ISBN: 978-0-9998551-0-2, 25-26 April 2018, Milan, Italy, Innovation Management and Education Excellence through Vision 2020, Vols I -XI, 6151-6162.
Ćwik, B. (2018), ‘Universal model of perception of contemporary environmental organisations,’ Zeszyty Naukowe Politechniki Poznańskiej, 76, 69-86.
Day, G. S. and Schoemaker, P. J. H. (2005), ‘Scanning the Periphery, Harvard Business Review,(November).
Flage, R. and Aven, T. (2015), ‘Emerging risk – Conceptual definition and a relation to black swan type of events,’ Reliability Engineering & System Safety, 144, 61-67, doi.org/10.1016/j.ress.2015.07.008.
Hajikazemi, S., Ekambaram, A., Andersen, B. and Zidane, Y. J. T. (2016), ‘The Black Swan – Knowing the Unknown in Projects,’ Procedia – Social and Behavioral Sciences, 226, 184-192, doi.org/10.1016/j.sbspro.2016.06.178.
Hausman, C. R. (1993), ‘Pragmaticism and semiotic. In C. R. Hausman (Ed.), Charles S. Peirce’s Evolutionary Philosophy (pp. 57-93), Cambridge: Cambridge University Press.
Hausman, C. R. and Anderson, D. R. (2012), Peirce on Interpretation Conversations on Peirce: Reals and Ideals, Fordham University Press, New York, doi:10.5422/fordham/9780823234677.003.0007.
Heinonen, S., & Hiltunen, E. (2012), ‘Creative Foresight Space and the Futures Window: Using visual weak signals to enhance anticipation and innovation,’ Futures, 44(3), 248-256, doi.org/10.1016/j.futures.2011.10.007.
Hiltunen, E. (2008), ‘The future sign and its three dimensions, Futures, 40(3), 247-260, doi:org/10.1016/j.futures.2007.08.021.
Hopej, M. and Kamiński, R. (2010), Struktury organizacyjne wspólczesnych organizacji, Oficyna Wydawnicza Politechniki Wrocławskiej, Wrocław.
Ilmola, L. and Kuusi, O. (2006), Filters of Weak Signal Foresight: Monitoring Weak Signal Efficiently in Corporate Decision-Making,’ Futures, 38.
Kaczmarek, T. T. (2008), Ryzyko i zarządzanie ryzykiem: ujęcie interdyscyplinarne, Wydawnictwo Difin, Warszawa.
Kahneman, D., Slovic P., and Tversky, A. (1982), Judgment Under Uncertainty: Heuristics and Biases, Cambridge University Press, New York.
Kahneman, D. (2011), Thinking, Fast and Slow, Straus and Giroux, New York, Farrar.
Kilstrup, M. (2015), ‘Naturalizing semiotics: The triadic sign of Charles Sanders Peirce as a systems property,’ Progress in Biophysics and Molecular Biology, 119, 563-575.
Koivisto, R., Kulmala, I. and Gotcheva, N. (2016), ‘Weak signals and damage scenarios – Systematics to identify weak signals and their sources related to mass transport attacks,’ Technological Forecasting and Social Change, 104, 180-190, doi.org/10.1016/j.techfore.2015.12.010.
Legna Verna, C. (2010), ‘A methodology for Improving Strategic Decisions in Social Systems with a lack of Information,’ Organizacija (Journal of Management, Informatics and Human Resources), 43(3), 102-113.
Lesca, H. and Lesca, N. (2011), Weak signals for strategic intelligence: anticipation tool for managers, John Wiley & Sons, Inc, London.
Lesca, H., & Lesca, N. (2014). State of the Art: Systems Suggested by Previous Authors. In Strategic Decisions and Weak Signals (pp. 47-72), John Wiley & Sons, Ltd.
Lewin, R. (2000), Complexity: Life at the Edge of Chaos. Chicago, University of Chicago.
Magruk, A. (2018), ‘Weak signals in logistics in the context of the uncertainty phenomenon,’ LogForum, 14(3), 305-314, doi:dx.doi.org/10.17270/J.LOG.2018.258.
Makridakis, S. and Taleb, N. (2009), ‘Living in a world of low levels of predictability,’ International Journal of Forecasting, 25(4), 840-844, doi.org/10.1016/j.ijforecast.2009.05.008.
Neisser, U. (1976), Cognition and reality, Freeman, San Francisco.
Radosiński, E. and Tomczak, S. (2017), ‘The effectiveness of discriminant models based on the example of the manufacturing sector,’ Operations Research and Decisions, 27(3), 81-97.
Raynor, M. E. (2007), Strategy Paradox: Why Committing to Success Leads to Failure, Doubleday.
Rossel, P. (2011), ‘Beyond the obvious: Examining ways of consolidating early detection schemes,’ Technological Forecasting and Social Change, 78(3), 375-385, doi.org/10.1016/j.techfore.2010.06.016.
Sant’Anna, A. (2018). ‘Perception Pragmatized: a Pragmatic Reconciliation of Representationalism and Relationalism,’ Philosophia, 46(2), 411-432, doi:10.1007/s11406-017-9919-8.
Saul, P. (2006), ‘Seeing the Future in Weak Signal,’ Journal of Future Studies, 10(3).
Świerszcz, K. and Ćwik, B. (2017), ‘Intermodal transport strategy for logistics center on the example of “Euroterminal Sławków Sp. z o.o.”’ Proceedings of the 30th Iernational Business Information Management Association (IBIMA), ISBN: 978-0-9860419-9-0, 8-9 November 2017, Madrid, Spain, 917-926, doi: 10.5171/2018.554344.
Świerszcz, K. (2017), ‘The Impact of Energy Poverty on the Level of Social Security’ Proceedings of the 4th International Conference on Management Science and Management Innovation (MSMI), ISBN: 978-94-6252-369-2, 23-24 June 2017, Suzhou, China, 175-178, doi: https://doi.org/10.2991/msmi-17.2017.39
Taleb, N. (2007), The Black Swan: The impact of the highly improbable, Random House Publishing, New York.
Thorleuchter, D. and Van den Poel, D. (2013), ‘Weak signal identification with semantic web mining,’ Expert Systems with Applications, 40(12), 4978-4985, doi.org/10.1016/j.eswa.2013.03.002.
Thorleuchter, D. and Van den Poel, D. (2015), ‘Idea mining for web-based weak signal detection,’ Futures, 66, 25-34, doi.org/10.1016/j.futures.2014.12.007.
Treisman, A. (1964), ‘Monitoring and storage of irrelevant messages in selective attention,’ Journal of Verbal Learning and Verbal Behavior, 3(6), 449-459, doi:10.1016/s0022-5371(64)80015-3.
Treisman, A. (1982), ‘Perceptual Grouping and Attention in Visual Search for Features and for Objects,’ Journal of Experimental Psychology: Human Perception and Performance, 8(2), 194-214.
Uskali, T. (2005), ‘Paying Attention to Weak Signal – the Key Concept for Innovation Journalist,’ Innovation Journalist, 2(4).
Waldrop, M. M. (1993), Complexity: The Emerging Science at the Edge of Order and Chaos, Simon & Schuster Paperbacks, New York.
Włodarczyk, E. (2018), Edukacja dla bezpieczeństwa, In O. Wasiuta, R. Klepka, & R. Kopeć (Eds.), Vademecum bezpieczeństwa (pp. 778). Libron, Kraków.
Zeff, S. A. (2003), ,Du Pont’s early policy on the rotation of audit firms,’ Journal of Accounting and Public Policy, 22(1), 1-18, /doi.org/10.1016/S0278-4254(02)00083-2.