Ghassan BEYROUTHY, Mira THOUMY and Elissa BOU ARBID
Notre Dame University – Louaize, Zouk Mosbeh, Lebanon
Volume 2019,
Article ID 749711,
Journal of Organizational Management Studies,
15 pages,
DOI: 10.5171/2019.749711
Received date: 29 August 2018; Accepted date: 22 January 2019; Published date: 19 April 2019
Academic Editor: Sawssen Garbouj Chaouachi
Cite this Article as:
Ghassan BEYROUTHY, Mira THOUMY and Elissa BOU ARBID (2019)," Trends in Loyalty Points Redemption in a Lebanese Commercial Bank",The Journal of Organizational Management Studies, Vol. 2019 (2019), Article ID 749711, DOI: 10.5171/2019.749711
This research investigates the impact of demographical factors and cardholders’ attributes on their credit card spending and accumulation of loyalty points; after the introduction of a loyalty program.This study consists of a sample of 507 active bank clients over a period of 2 years (since the inception of the program), using a deductive quantitative reasoning. The results show that the frequency of redemption; the total of points redeemed in various categories of rewards and income; are predictive of the total spending on cards whereas no variation with respect to gender, marital status, profession, average income and country of residence was statistically significant. The Miles redemption category remarkably exhibits increasing coefficients in 2017 compared to 2016 (+10.2%); while the Cashback and Gifts categories coefficients significantly decreased (-58.75% and 82% respectively). Thus clients perceived the value of redeeming their points through Miles and not Cashback. Moreover, an increase in the frequency of redemption and the number of new active clients in 2017 were observed, all indicating the increase of clients’ loyalty to the bank through increased spending on their cards.The findings provide a valuable insight to the studied bank’s management and equip them with information on the attributes relevant to their clients, especially those who are active on the bank’s loyalty program and are continuously redeeming their collected points. It also gives a new perspective for policy makers in the financial institutions on the factors that affect the spending behavior of clients on their cards and the patterns behind the accumulation of loyalty points.
The Lebanese banking industry includes 142 banks in total, divided into small, medium and large-size, privately owned commercial banks; investment banks; Islamic banks; Some of these are 100% Lebanese and they are a total of 32 banks, while the remaining ones are foreign and mixed banks. (Banking control commission of Lebanon, n.d.). This industry is regionally renowned for its openness and endorsement of the country’s liberal economy, especially with the expansion of the Lebanese banks in diverse countries around the world through their branches, affiliated companies, subsidiaries and representative offices, not to mention their profound ongoing relationships with corresponding banks worldwide (Association of banks in Lebanon, 2018).
To enhance customers’ loyalty, banks implement rewards programs for their existing clientele, and intensively market these programs in order to penetrate new markets. Almost four out of five bank clients admit that they choose their primary bank based on its’ proposed rewards program (Spradlin, 2016).
With respect to international practices, the types of loyalty programs in the banking sector differ from one institution to another. Some banks offer a points-based system where the enrolled members collect points and then exchange their balance for discounted items from a catalogue, or redeem their points for free flights, electrical equipment, vouchers and others (Liu, 2009). Other financial institutions reward their loyal customers with discount rates on some products they specify. The clients are selected based on the number of products they have obtained from the bank or the actual value of their ongoing business with the bank.
Among the 32 purely Lebanese owned commercial banks, twelve banks are known to be publically advertising and promoting their respective loyalty programs to their clients. Reward programs in Lebanon vary in offered redemption types such as cashback, whereas, loyalty program members are immediately credited with a certain amount of money in return for their collected points over time, travel miles, gifts, vouchers, donations, merchant discounts to free bank products or services, or even sometimes a combination of some or all of these categories.
The chances of the consumers to remain in relationship with the firms that offer points-based loyalty programs increase with the expectancy of future rewarding occasions given that the cardholders will be able to redeem their points with free rewards at a later stage (Lemon, White, and Winer, 2002).
In this paper, we study the case of a Lebanese Commercial Alpha Bank, operating in the Lebanese market for more than 50 years. For confidentiality reasons, this bank will be referred to as Bank X. Bank X offers both retail and business banking services, ranging from debit and credit cards, personal and housing loans to business and corporate loans. The management of this bank has decided to join the trend of loyalty programs in Lebanon in 2016 to promote the retention of its existing clientele, boost their spending on their credit cards, and attract new potential clients through interesting offers available exclusively on their loyalty program.
Bank X’s loyalty program offers the cashback, miles, gifts, vouchers and donations categories. This program is constructed on a points-based system whereas it only counts the collected points by credit cardholders obtained from the amount of money spent on their credit cards or used at merchants POS (point of sale) transactions: ATM cash withdrawal transactions on debit cards are not taken into consideration in this particular system. Specifically, in this loyalty program, for each one dollar spent on any POS machine, 1 loyalty point is collected, equivalent to 1.5 miles, as arranged and regulated by the bank’s management.
Consequently, this research will provide the bank’s marketing and customer service departments with insightful findings to build a proper customer journey map that would eventually take the loyalty of the bank’s clients into consideration, and carry it forward for effective implementation. Not to dismiss the research findings stating that low points redemption rates among banks were due to lack of communication from the banks that offer these programs as well as complicated redemption procedures, leading to the idea that clients sometimes face information asymmetry when dealing with different banks (Liu, 2009).
This analysis will show whether the success of the loyalty program at this bank, measured by the changes in the expenditures of the existing clients on their credit cards, is based on a set of pre-defined demographical and other banking related variables that will be discussed in a different section.
Previous research has shown that demographical characteristics are related to a customers’ loyalty; consequently, this paper will analyze the demographical factors of the clients who are enrolled in the current loyalty program and have redeemed their points in any of the mentioned categories at least once through this program.
Review of Literature
As a result of the increasing use of credit cards as an electronic payment method among customers, the financial industry is witnessing a huge competition among financial institutions (Subramaniam and Marimuthu 2010); encouraging the banks to advance in their services as well as to attempt to comprehend their customers’ preferences (Ming-Yen Teoh, Chong and Mid Yong, 2013). Banks are finding new ways to make their operations more lucrative by encouraging their clients to obtain new credit cards offering additional customer benefits and rewards in order to gain access to new intact markets. Commercial banks around the world have adopted the Loyalty Programs trend and created different versions of reward offerings to further engage their clients in financial transactions and encourage them to increase their credit cards expenditures. (Chakravorti, 2003). In 2006, Breitkopf concluded that card holders are using less ATM machines for cash withdrawal transactions due to the hefty charges the banks impose and are progressively using their cards for POS transactions: in fact, clients are becoming increasingly aware of the benefits of collecting loyalty points and benefiting from cashback rewards due to their POS transactions. One of the main ways to enhance customers’ loyalty is the implementation of rewards program at the bank for their existing clientele, and intensively marketing these programs in order to penetrate new markets. Almost four out of five bank clients admit that they choose their primary bank based on its’ proposed rewards program (Spradlin, 2016). It was found that the main objectives of these rewards systems were to acquire new customers first at 66%, retain existing customers at 56% and improve customer experience at 41%. Other objectives came in at later ranks such as increase customer satisfaction, boost customer profitability and engage clients (Forrester, 2015). Bolton, Kannan and Bramlett, in the mentioned study conducted in the year 2000, found that the clients, who were members of the credit card loyalty programs at financial firms, gave less attention to their previous bad experiences with these firms once making new business decisions versus those who were non-members. Yet, their study did not prove that the loyalty programs of these firms increased the retention of their members, nevertheless they detected that there was an increase in the consumption on credit cards among members rather than non-members of these programs. Likewise, according to Carbo-Valverde and Linares-Zegarra (2011), the average spending on credit cards versus cash is larger for the clients who possess cards with loyalty programs.
Dorotic, Verhoef, Fok and Bijmolt’s (2014) findings stated that clients’ decision to redeem their collected points through a loyalty program reinforces their behavior to collect more points by spending more. They also concluded in the same study that loyalty program members who redeemed their points for a reward at least once are more likely to increase their expenditures in amounts and frequency. The characteristics of members in a loyalty program might affect the relationship between their redemption behavior and their purchasing. (Dorotic, Verhoef, Fok and Bijmolt’s, 2014): clients who are active members of loyalty programs may react in different ways to the programs depending on their usage or expenditure, their own previous involvement in the program or even their demographical factors (Kim et al., 2001; Liu, 2007; Bolton, Kannan, & Bramlett, 2000; Leenheer et al., 2007; Lemon & von Wangenheim, 2009; Magi, 2003).
The listed literature guided the researcher of this study to investigate the effect of the adopted independent variables on the total spending of the clients noting that increased credit card usage indicates advanced levels of client loyalty at the bank, whereas the cardholder is collecting more loyalty points with every purchase on his/her card.
Liu (2009) specified that: “most of the studies related to credit card point-reward programs have been conducted in developed countries, where they are well-established” (p.405); therefore, this statement points toward the need to further research this topic in under-developed countries like Lebanon.
The main research questions intended for this analysis are as follows:
Is there a correlation among client characteristics such as frequency of redemption of points, total points redeemed on certain reward category and the amount spent on credit cards after the inception of a loyalty program?
Does the credit card spending, vary significantly with respect to demographical factors like gender, marital status, job occupation and income range?
There is an important aspect into this research with a growing need to dissect these research questions to expose the factors behind the increasing spending on credit cards by a client at a commercial bank in Lebanon, all while looking closely at demographical factors and other client characteristics that will be of necessary use to bankers to tailor their customer retention programs effectively.
Procedures and Methodology
At Bank X the clients have the ability to redeem their collected loyalty balance at any point in time through any reward category they choose. Thus, the total spending on credit cards by clients is perfectly equivalent to the number of loyalty points collected per each loyalty program member. The demographical variables to be studied at the cardholders’ level have been deduced from different studies, mainly from Seiler, Rudolf and Krume 2013, studying a set of demographical variables such as: gender, age, education type and level and income range, and their influence on loyalty will be all observed in relevance to the value of growth and achievement in one’s life. In this study, the authors found that, generally, women who pursue growth and achievement in their lives tend to become less loyal to one institution than men. Supporting studies also observed that females, generally, seek variety more than males (Mitchell and Walsh, 2004). However, females made transactions on their credit cards in numbers that outperformed those made by males (Lenormand et al., 2015), reconfirmed in a study that concluded similarly: women are expected to spend more on their cards than men do (Sobolevsky et al., 2016), signifying that women are more loyal than men to the bank they deal with: From the bank’s perspective, increased card usage means the clients have accumulated further loyalty points, since effective loyalty programs offered on credit cards are more likely to encourage clients on using these cards as their payment method (Ching and Hayashi, 2008), therefore, leading to this research’s first hypothesis:
H1: Cardholder’s accumulated loyalty points vary with subject’s gender.
Similarly, the same study of Seiler et al. (2013) have found that advanced age leads people to become less loyal to their respective bank, especially when they give more importance to growth and achievement in their lives as they age. On the contrary, studies by Homburg and Giering (2001) and Evanschitzky and Wunderlich (2006) stated that people show more loyalty as they grow older. Similarly, adolescents were found to favor credit cards over carrying cash money to settle their payments since this modern digital method grants them more payment flexibility (Kim and DeVaney, 2001), only meaning that an increased usage of credit cards will lead to further collection of loyalty points for this age group. Bank X should then take into consideration the age of cardholders to check whether the program members are adolescents or adults. This reflection leads to this paper’s second hypothesis:
H2: Cardholder’s accumulated loyalty points vary with subject’s age.
As for the customer’s education level, the direct relationship between the total credit card spending of customers in relation to their education background type and level was not conclusive, only indicating that this criterion needs to be further researched to examine the effect of education on customers’ loyalty. Consequently, this paper will try to extract relevant information to this factor, setting grounds for the third hypothesis:
H3: Cardholder’s accumulated loyalty points vary with respect to subject’s income.
Khare (2013) recognized the marital status as a demographical element affecting spending behavior of individuals with differences among single and married people; confirming Limbu and Xu’s study (2012) about the credit cards expenditure differences among married and non-married people (namely single, widowed and divorced): Married people showed higher usage on their credit cards than those belonging to the second category. That being so, a cardholder’s marital status and total credit card spending investigation lead to the next formulated hypothesis:
H4: Cardholder’s accumulated loyalty points vary with respect to subject’s marital status.
For the reasons stated above, this paper will study these factors specifically in relevance to the Lebanese market while including some additional elements that the authors of this paper find significant to add depth to other findings, such as: category in which client’s points were redeemed each year (2016 and 2017), redemption frequency of client each year (2016 and 2017), customer’s job position (as of 2017) and country of residence (as of 2017); consequently leading to the remaining hypothesis to be tested in this paper:
H5: Cardholder’s accumulated loyalty points vary with respect to subject’s choice of points redemption category in 2016.
H6: Cardholder’s accumulated loyalty points vary with respect to subject’s choice of points redemption category in 2017.
H7: There is a significant linear relationship between the frequency of points redemption by client in 2016 and the client’s accumulated loyalty points.
H8: There is a significant linear relationship between the frequency of points redemption by client in 2017 and the client’s accumulated loyalty points.
H9: Cardholder’s accumulated loyalty points vary with respect to subject’s profession.
H10: Cardholder’s accumulated loyalty points vary with respect to country of residence.
The study of the mentioned factors will be insightful in detecting the changes occurring on cardholders’ expenditure rates on their credit cards during the period in which the loyalty program at the bank has been introduced (early 2016) and ongoing, therein, hopefully, indicating trends and key aspects of the trends behind such a program.
Research Strategy and Methodology
The strategy approach to make this research is a longitudinal case study, where the total spending of the bank’s clients was taken into consideration for two consecutive years after the inception of the bank’s loyalty program.
The research methodology selected for this paper comprises of the use of secondary archival data concerning the cardholders’ spending on their credit cards since loyalty program inception (early 2016) and demographical factors in a regression model. SQL database was the main tool to collect the raw data, backed by Microsoft Excel software used to load the collected information and deploy it in an overall worksheet. The filtered information was processed through SPSS (Statistical Package for Social Scientists). The data used in this research was collected from Bank X after obtaining the consent of the bank’s management, under full confidentiality agreement to ensure clients’ privacy due to the banking secrecy regulations that forbid access and publishing of similar delicate information. The obtained data is categorized as archival, considered to be one of the most convenient types for studies similar to this one, and known to increase, objectivity, reliability, validity and robustness of the findings versus other known research methodologies like questionnaires or observations. Nonetheless, the gathering of the archival data can reveal itself uneasy due to the probabilities of receiving blank spots in the huge amounts of data entries leading to possible inaccuracies, overlaps or inaccessible elements.
Population and Sampling Procedures
The loyalty program in this study has been introduced by Bank X early on in 2016. The gathered data starts from early 2016 (since program inception) until end of 2017. Therefore, the extracted information covers all cardholders active in the bank’s loyalty program whether they are resident in Lebanon or anywhere abroad. Active reward program members acquired after the end of 2017 were omitted since the retrieval and analysis of relevant data started by the end of 2017 and was only finalized by March 2018. The selected sample, which is the same as the population is considered to be highly illustrative for the purpose of this research due to the large and diversified categories of data collected for each client. The total population size is 2,960 enrolled clients in bank X’s loyalty program, leading to an exact sample size of 507 clients who redeemed some or all their points using this program, for at least once.
Findings and Analysis
The investigation on the average spending on credit cards by the individuals distributed according to the country of residence determined that 93.6% of the cardholders actively enrolled in the loyalty program are currently living in Lebanon, while the rest are scattered around 10 other countries around the world. Even though the majority of active members of this program are in Lebanon, two other countries showed an average spending higher than the one observed for Lebanon. After reverting to the original data input, the researchers determined that the average credit card spending observed for Saudi Arabia and the UAE, belong to 6 customers in Saudi Arabia and 7 in the UAE. This result demonstrates that cardholders, even when abroad, spend increased amounts on their cards and accumulate more loyalty points. It was actually determined that 2 out of 7 clients from UAE joined the program by mid of 2016 whereas the other 5 joined early on in 2017 and redeemed their points more than once. As for the clients living in Saudi Arabia, all 6 of them joined the program in 2017 and redeemed their collected points more than once. The observed results thus lead to the non-rejection of the following hypothesis:
H10: Cardholder’s accumulated loyalty points vary with respect to country of residence.
Metric Variables
The four moments of a distribution for the remaining metric variables will be described and interpreted in this section to test the normality of the chosen sample. To name the metric variables: Frequency of redemption in 2016 and 2017, total number of points redeemed in Miles in 2016 and 2017, total number of points redeemed in Cashback in 2016 and 2017, total number of points redeemed in Gifts/Vouchers in 2016 and 2017, Gender, Average Annual income, Age, Marital status, Education level and Segmented profession and finally, the dependent variable of this study: the total spending on cards of active loyalty program members until 2017. The majority of the tested variables proved to be not normally distributed, the remaining variables were kept, even though they were not normally distributed since the program at Bank X has been introduced early 2016, and the data gathered reached until the end of 2017. In two years, the observations have not yet had enough time to become normally distributed, in order to display accepted ranges of skewness and kurtosis. Moreover, heteroscedasticity tests are used to check if there is a systematic variation in the error residuals across the set of measured values in a multivariate distribution. All tested variables proved to be homoscedastic as their p-values scored more than 5% on the Glejser test, except four variables with p-values lower than 5%: Cashback points redeemed in 2016 and Miles points redeemed in 2017, income range, considered heteroscedastic. Since the loyalty program at Bank X was introduced in early 2016, it was expected that the clients display different redemption behaviors across rewards categories due to lack of information about this program. In fact, before 2016, the Bank rewarded its clients only with Cashback paid by the end of each year. Thus, clients joining the program from its inception were only familiar with the cashback category, and therefore frequently redeemed their collected points through it. In 2017, the clients grew more knowledgeable of the program’s features and offers and hence executed further redemptions through the Miles category, explaining the heteroscedasticity of the points redemption 2017 variable. Not to mention that the clients also come from varied educational backgrounds and income levels, while it was noticed that the frequency of redemptions in 2017 scored six times higher than 2016, meaning that a lot of new clients joined the program in 2017, explaining the heteroscedasticity of these two demographical variables.
Non Parametric Tests
A variation analysis conducted on demographical variables studied such as: gender, marital status, and segmented profession showed variations in the number of observations within each variable as follows: Man = 317 vs. Woman = 137; Single = 112 vs. Married = 312 vs. Divorced/Widowed = 30; Up to Baccalaureate 2 = 132 vs. Bachelor = 236 vs. Masters/PhD = 83; ADEJL = 48 vs. BEPP = 124 vs. CCOTR = 158 vs. DM = 92 vs. UN = 32. For the reader’s reference, ADEJL consists of Architects, doctors, Engineers, Judges and Lawyers, all grouped under one segment of professionals. The second segment, BEPP is made of Bankers, miscellaneous employees, painters and professors, while the third one CCOTR groups the Consultants, Contractors, Owners, Traders and Real estate brokers under one profession segment. Last but not least, the DM segment consisting of Directors and Managers and the UN is for Unemployed or Retired clients.
Since gender consists of 2 main components, the Mann-Whitney non-parametric test was used for this variable. The three remaining variables were tested using the Kruskal-Wallis H-test since they are formed with more than 2 components. The discussion of the tests’ results follows:
Gender: The obtained Z score (-2.161) indicates that there is a variation in the total spending on credit cards among men and women, with significance of 0.031 (p<5%) to reject the null hypothesis of the U-test: the distribution of Y (16-17) is the same across categories of Gender. Likewise, the t-test designates that the total spending of men ($106,885) exceeds the total spending of women ($64,595). These findings do not match with those of Sobolevsky et al. (2016) who concluded that women are likely to spend more on their cards than men do. However, as mentioned in the literature review, increased card usage leads to increased accumulation loyalty points, meaning that men tend to accumulate more loyalty points than women do, leading to retain this research’s first hypothesis:
H1: Cardholder’s accumulated loyalty points vary with subject’s gender
Marital Status: Concerning the marital status, the results of the Kruskal-Wallis H-test resulted in a p-value less than 5%; clearly implying that the total spending on credit cards is not the same across the different categories: single, married and widowed/divorced, thus rejecting the null hypothesis.
With the aim of depicting the differences among the single, married and divorced/widowed clients in terms of their spending on their credit cards, a Mann-Whitney U-test was conducted on each pair of categories.
The collected outcomes show that the highest Z score was observed when difference was computed between Single and Married clients (-5.102), followed by the Z score of difference between the Single and Divorced/Widowed clients (-2.789), and lastly between Married and Divorced/Widowed clients (-0.251) all at 5% significance level. The conducted t-tests indicate that married clients spent the most on their credit cards during 2016 and 2017 ($113,757), followed by Divorced/Widowed cardholders, with an average spending of $89,880 on their cards, leaving the single clients at the end with an average of $40,566 spent. The discussed above indicate that Married cardholders spend the most on their credit cards, confirming Limbu et al. ‘s study in 2012 that observes a higher spending on credit cards from married people, which designates that married clients accumulate more loyalty points than other marital status categories, leading to retain hypothesis 4.
H4: Cardholder’s accumulated loyalty points vary with subject’s marital status.
Age: Age p-value > 5%, the variable is insignificant. There is no linear relationship between amount spent on cards and age of cardholder.
Segmented Profession: Reference to the variable regarding the segmented professions of clients, the Kruskal-Wallis H-test returned with a p-value less than 5%, meaning that the null hypothesis is to be rejected and indicating that there is a difference in the credit cards spending across the different segments of professions in the sample, therefore the Mann-Whitney U-test was conducted on each pair of profession segments: The non-parametric test conducted on profession segments 1 and 2, BEPP and CCOTR resulted in the highest Z-Score, indicating that there is a significant variation between both segments, confirmed by the p-value less than 5%. The average total spending on credit cards for the BEPP (banker, employee, painter, professor) segment indicated $54,114 during 2016 and 2017 and revealed itself to be the lowest spending segment in this research. On another hand, the segment CCOTR, mainly including business owners, contractors, traders etc… exhibited the highest mean of total spending on their cards, at a mean of $132,449 during 2016 and 2017. Surprisingly, the second highest scoring among profession segments was the UN segment which is mainly formed out of unemployed and retired clients. This result underlines the necessity of further research to be conducted regarding this matter. In light of the above, it is then assumed that the total spending of clients on their credit cards varies with the type of their related profession. Self-employed professionals like contractors, traders, real estate brokers…etc. tend to show increased levels of expenditure on their cards, therefore leading to augmented amounts of loyalty points accumulated through this bank’s reward program. Subsequently, H9: Cardholder’s accumulated loyalty points vary with respect to subject’s profession is then retained.
Regression Analysis: Testing the Constructed Model
The linear regression model used for this research comprised of metric variables, where some of them were originally of nominal nature and then turned into metric variables in order to integrate them in the equation.
The frequency of redemption 2016 and 2017, the total number of points redeemed in 2016 and 2017 in their respective categories and age are all metric variables and presented no issue in integrating them in the regression model. As for the variable related to gender, all men were denominated as 0 and women as 1 in the individuals’ category, while in the companies’ category, every observation showed N/A (not applicable) since companies have no indication on the gender and this variable was therefore omitted in the companies’ category of observations. Similarly, the marital status variable was turned into a metric variable after assigning 0 to single clients, 1 to married and 2 to the widowed and divorced together. Relevant to the education level of the client, observations showing levels equal to or below Baccalaureate 2 (consistent with the Lebanese education system) were grouped under the denomination 0, bachelor levels grouped under the denomination 1 and Masters and PhD levels under 2. Last but not least, the gathered information about the professions resulted in the grouping of observations under 4 different segments: ADEJL were denominated as 0, BEPP, are denominated as 1, CCOTR are denominated as 2, DM denominated as 3 and UN, denominated as 4. Lastly, the income range of each observation has been individually clustered under one average income range group, described as below: Clients with an annual income range slightly lower or equal to $25,000 have been grouped under the first average income group: $25,000. Clients earning annually between $25,000 and $50,000 were all assembled under the second average income group of $40,000 (almost average of both extremes has been taken for each created range); clients making between $50,000 and $100,000, assembled under income range of $75,000, and earners between $100,000 and $200,000 under the range of $150,000. Similarly, clients earning annually between $200,000 and $400,000 were gathered under the 5th income range of $300,000 and finally those earning more than $400,000 and up to $600,000 per annum, were convened under the last income range group of $500,000, turning this variable into metrics.
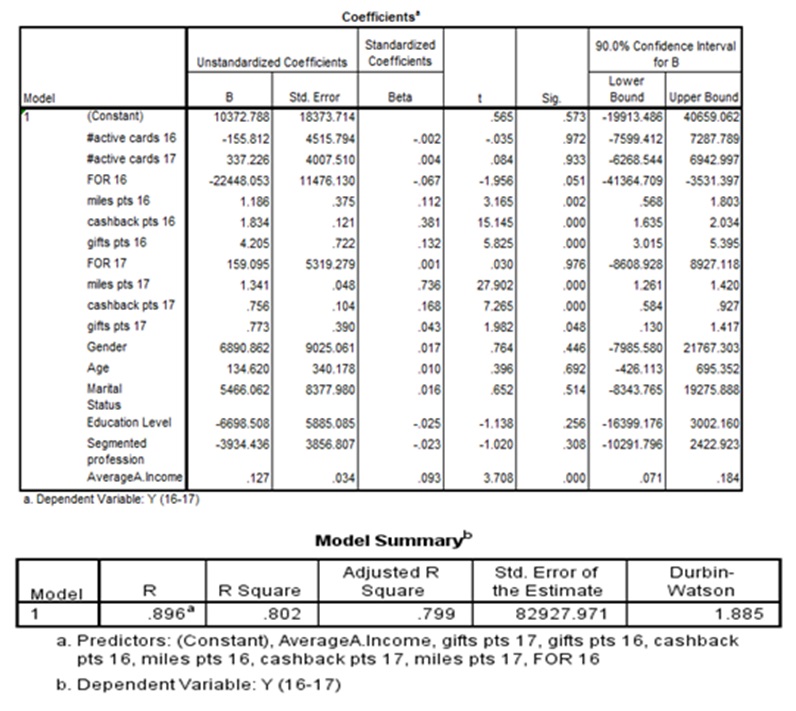
Table 4.1: Results of Coefficients of New Regression
The table above shows multiple insignificant variables to be removed one at a time, starting with the variables with the highest p-values, until p-value of all remaining are less than 5%. With each variable removed, a new regression was re-conducted to monitor the changes in the model summary and coefficients. At the 8th regression, all 8 remaining variables presented a p-level lower than 5%. These variables are, hence, represented in table 4.2 below, alongside their new coefficients related to this regression analysis:
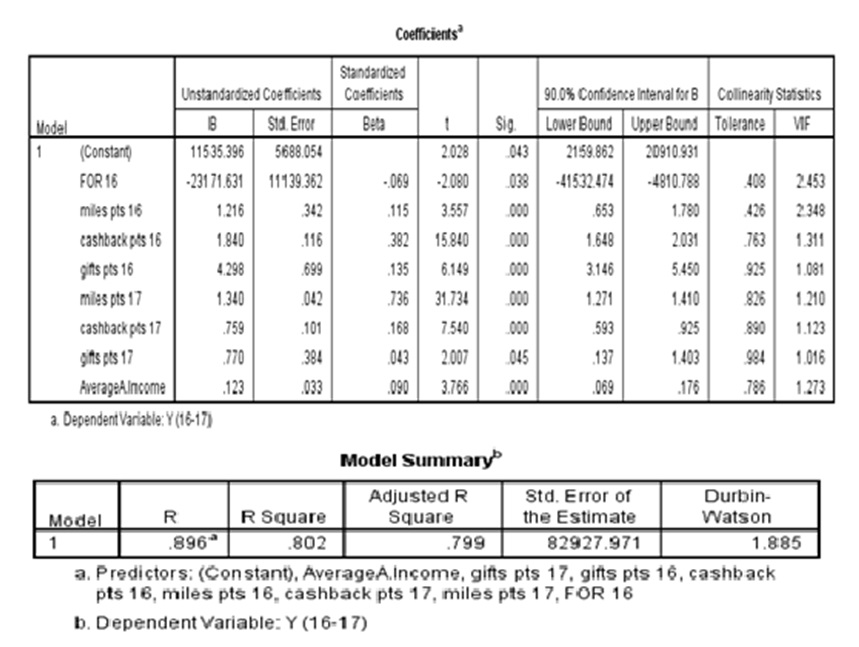
Table 4.2: Final Regression and the Coefficients of Remaining 8 Variables
To test for multicollinearity, the level of tolerance T and the variance indication factors VIF where VIF= 1/ T and T= (1-R2) where both calculated for the remaining 8 independent variables, shown in table 4-8 as well. The absence of multicollinearity amongst the variables was verified since all Tolerance levels resulted in values above 0.2 as well as VIF lower than 10. As for R-squared (R2), the coefficient of determination which determines the degree to which the independent variables trigger the variations in the dependent variable resulted in 0.802, signifying that the metric variables explain 80.2% of the variations in the total credit card spending per client, the dependent variable. Likewise, adjusted R-squared, which tests for the probability of increase in R2 if additional variables were added to the regression, turned to be 0.799 or 79.9%, thus implicating that the addition of other variables to the equation will not provide further explanation for the variation in the dependent variable. The Durbin-Watson test resulted in a value of 1.882, indicating that the dependent variable is not auto-correlated to itself in time, where the tolerance area for this test is between 1.8 and 2.2. The results of R2 and adjusted R2 and Durbin-Watson test then validate the robustness of this model.
Discussion of the Findings
As presented in table 4-2, the results of the multivariate regression conducted on the individuals’ category indicate that all remaining variables are positively and linearly correlated with the dependent variable Y: total spending on credit card of clients active in loyalty program of Bank X, except the frequency of redemption in 2016 which is negatively and linearly associated to Y. Furthermore, all resulted p-values are below 5% and presenting no multicollinearity concerns, thus allowing the analysis and testing of remaining hypotheses. The table also shows that the intercept β0 is at 11,535, meaning that total spending of credit cardholder in 2016 and 2017 (Y) is equal to 11,535 USD when all independent variables are equal to 0. The below equation represents the final model summary of this research.
Final Regression Model
Y (Total spending on card per Client in 2016 and 2017 in USD) = 11,535 – 23,171 (Frequency of Redemption 2016) + 1.216 (Points redeemed on Miles in 2016) + 1.840 (Points redeemed on Cashback in 2016)+ 4.298 (Points redeemed on Gifts in 2016)+ 1.340 (Points redeemed on Miles in 2017)+ 0.759 (Points redeemed on Cashback in 2017)+ 0.770 (Points redeemed on Gifts in 2017)+ 0.123 (Average annual income of cardholder) + Ɛ
Frequency of redemptions 2016: the frequency of redemption (FOR) in 2016 per client turned out to be negatively and significantly correlated to the dependent variable Y in a linear way with an unstandardized coefficient B of -23,171. This result indicates that for every increase of one unit in the FOR in 2016, the total amount spent per client decreases by 23,171 USD, while all other variables are held at 0. In this view, there is a significant linear relationship between the frequency of redemptions in 2016 and the total amount spent on cards in 2016 and 2017 and therefore H7 is retained: There is a significant linear relationship between frequency of points redemption by client in 2016 and client’s accumulated loyalty points.
In fact, when gathering the data for this research, the management informed the researchers that the points collected by clients during 2015 were intentionally accumulated by the bank in order to give the customers the ability to benefit from the offered rewards once the program was to be introduced in 2016. Thus, during 2016, the clients were actually redeeming points collected since 2015 and the beginning of 2016 but did not have yet the ability to accumulate large amount of points by the start of the program, and therefore explaining the negative correlation between the frequency of redemption in 2016 and the dependent variable Y.
Total number of points redeemed on Miles, Cashback and Gifts in 2016: the standardized coefficients estimate of these independent variables being +1.216, +1.840 and +4.298 respectively, indicate the presence of a positive linear relationship between these three variables and total spending on cards in 2016 and 2017. The Miles, Cashback and Gifts 2016 are all combined under Points Redemption Category 2016, and therefore, the above cited results lead to the non-rejection of H5:Cardholder’s accumulated loyalty points varies with respect to subject’s choice of points redemption category in 2016. As a matter of fact, all three category types proved to be positively related to the dependent variable, which signifies that the clients who redeemed their collected points during 2016 will spend more on their cards thereafter, agreeing with Verhoef (2003), stating that clients who participated in a loyalty program exhibit higher degrees of likeliness to stay loyal to the firm and willing to increase their business with the firm.
Total number of points redeemed on Miles, Cashback and Gifts in 2017: the weights of total number of points redeemed on Miles, Cashback and Gifts in 2017 displayed positive linear correlation with Y at +1.340, +0.759 and +0.770 respectively. Same as the above, these types of redemption are also pooled under Points Redemption Category 2017. The positive linear relation of this category with the dependent variable brings about the non-rejection of H6: Cardholder’s accumulated loyalty points vary with respect to subject’s choice of points redemption category in 2017. Remarkably, the Miles redemption category in 2017 exhibits a higher coefficient than its precedent in 2016 (10.2%), while the Cashback and Gifts categories coefficients decreased (-58.75% and -82% respectively). While investigating the potential reasons behind these changes from 2016 to 2017, the management indicated that during 2016, the program was considered as new and was continuously under test by the customer service department. Shortly, the clients perceived the value in redeeming their points through Miles and not Cashback, thus explaining the rapid increase of this category on the account of the others, while an increase in frequency of redemption and number of new active clients in 2017 was observed, all indicating the increase of clients’ loyalty to the bank through increased spending on their cards.
Average annual income of cardholder: the coefficient of this independent variable shows a value of +0.123, signifying that it has a positive linear relationship with the total spending of clients on their credit cards in 2016 and 2017, whereby the higher the income of the cardholder, the more the spending on the credit card, leading to retain another hypothesis; H4:Cardholder’s accumulated loyalty points varies with respect to subject’s income. This result endorses Devlin, Worthington and Gerrard (2007) literature in section 3.2 and contradicts with Danes & Hira (1990)’s study that found that lower income groups exhibit higher spending on their credit cards. Other studies that support the findings of this research include Khare (2013), Kim & DeVaney (2001) and Wang, Lu & Malhorta (2011). These findings indicate that clients with higher income are more likely to spend on their credit cards.
Conclusions and Recommendations
Summary of the Main Findings
The findings of this paper revolve around the investigation of the total spending pattern per client at Bank X, a commercial bank in Lebanon, in consideration of client’s gender, age, education level, average annual income, marital status, number of points redeemed per client in certain rewards category in 2016 and 2017, frequency of redemption in 2016 and 2017, profession and country of residence.
A descriptive approach on the country of residence determined the patterns of points redemption of clients in Lebanon and abroad and proved that client’s accumulated loyalty points vary with respect to the country of residence, allowing to retain H10: Cardholder’s accumulated loyalty points varies with respect to country of residence.
Moreover, an analysis of variances (ANOVA) was conducted on some of the demographical variables like gender, marital status and segmented profession. The most significant factors on total spending on credit cards in 2016 and 2017 per client from each variable respectively were male, married, and belonging to CCOTR profession segment, noting that the education level of the client tested as insignificant; all consequently allowing for the non-rejection of H1: Cardholder’s accumulated loyalty points varies with subject’s gender; H4: Cardholder’s accumulated loyalty points varies with subject’s marital status and H8: Cardholder’s accumulated loyalty points varies with respect to subject’s profession and the rejection of H3: Cardholder’s accumulated loyalty points varies with subject’s education level. The remaining metric variables were all plugged in a multivariate regression model: A regression was conducted where 8 independent variables tested as insignificant (their p-value were above 5%).
Implications and Future Research
Financial institutions may use the findings of this research to determine the factors they should take into consideration in order to improve the experience of loyalty programs for their clients. In specific Bank X’s management should design exciting new features to its redemption categories. For instance, the strong positive trend of bank customers (as proven by the regression analysis) to opt for travel miles, prompts the bank to add new travel destinations and varied travel packages to suit all needs and tastes with exceptional flexibility and adapted travel plans, to answer the growing demand on this category. Moreover, a new and wider variety of gifts must be available to suit all tastes and preferences. Bank X ‘s management can also benefit from the finding of this research to determine the best ways to target their currently active clients based on their discussed criteria in the findings section, as well as group different types of clients together based on the analyzed demographical factors. On another note, the authors of this paper recommend the bank’s management to invest in further modern statistical tools in order to make the process of collecting relevant data more feasible and less time consuming should the bank’s strategy be changed to adapt to the changing needs of the clients and the ongoing ups and downs of the financial industry in Lebanon. The adoption of similar software arms the bank with unrivaled elasticity to shift from traditional marketing efforts to more sophisticated campaigns targeting specific client segments in order to increase customer loyalty.
To the authors’ knowledge, this research paper includes variables that were not taken into further consideration regarding loyalty programs in financial institutions in general, and banks in specific. Thus, this dissertation provides a new and updated perspective on these trendy programs. Few variables have not been included in this research, such as type of credit cards in client’s possession, location of purchasing transactions, limit of credit card, and clients’ other business activities with the bank. Consequently, the inclusion of similar variables in the designed model would serve as an enlargement of this research that may depict and discover other factors that affect a client’s loyalty to a bank through the accumulation of loyalty points. It is also recommended to extend this research over a prolonged time period. Not to mention that the acquisition of larger and more diversified samples is recommended, as it may build upon the results of this paper and thus expose new findings in this field and add to the existing body of literature pertaining to this topic. And last, the inclusion of a factor analysis on listed variables might lead to the discovery of new factors affecting the success of a loyalty program at a bank.
References
Banking control commission of Lebanon (n.d.). Retrieved from http://www.bccl.gov.lb/publications/lebanese-bank-list/
Bolton N. R., Kannan P.K., & Bramlett M. D. (2000). Implications of loyalty program membership and service experiences for customer retention and value. Journal of the Academy of Marketing Science, 28 (Winter), 95–108.
Breitkopf, D. (2006, September 26). Point of sale transactions said hurting ATM volume. American Banker, 7.
Carbo-Valverde, S. & Linares-Zegarra, J. M. (2011). How effective are rewards programs in promoting payment card usage? Empirical evidence. Journal of Banking and Finance, 35 (12), 3275-3291.
Chakravorti, S. (2003). Theory of credit card networks: A survey of the literature. Review of Network Economics, 2 (2), 50-68.
Ching, A. & Hayashi, F. (2008). Payment card rewards programs and consumer payment choice. Retrieved from https://papers.ssrn.com/sol3/papers.cfm?abstract_id=1114247
Danes, S. M. & Hira, T. K. (1990). Knowledge, beliefs and practices in the use of credit cards. Home Economics Research Journal, 18, 223-235.
Devlin, J. F., Worthington, S. & Gerrard, P. (2007). An analysis of main and subsidiary credit card holding and spending. International Journal of Bank Marketing, 25 (2), 89-101.
Dorotic M., Verhoef P. C., Fok D., Bijmolt T. H. A. (2014). Reward redemption effects in a loyalty program: when customers choose how much and when to redeem. Internal Journal of Research in Marketing, 31, 339–355.
Evanschitzky, H. & Wunderlich, M. (2006). An examination of moderator effects in the four-stage loyalty model. Journal of Service Research, 8 (4), 330-34.
Forrester (2015) Elevate Engagement to Unlock the Potential of Your Loyalty Program. orrester Consulting. Retrieved from:http://insight2action.deluxe.com/rs/deluxe1/images/DR_WP_20150411_FORRESTER-ELEVATE.pdf?aliId=13662628
Homburg, C. & Giering, A. (2001). Personal characteristic as moderators of the relationship between customer satisfaction and loyalty: an empirical analysis. Psychology and Marketing, 18 (1), 43-56.
Khare, A. (2013). Credit card use and compulsive buying behavior. Journal of Global Marketing, 26 (1), 28-40.
Kim, H. & DeVaney, A. S. (2001). The determinants of outstanding balances among credit card revolver. Financial Counselling and Planning, 12 (1), 67-69.
Leenheer J., Heerde H. J. V. , Bijmolt T. H. A., Smidts A. (2007). Do loyalty programs really enhance behavioral loyalty? An empirical analysis accounting for self-selecting members, International Journal of Research in Marketing, 24 (1), 31-47
Lemon K. N., Wangenheim F. V. (2009). The reinforcing effects of loyalty program partnerships and core service usage a longitudinal analysis. Journal of Service Research, 11 (4), 357-370.
Lemon K. N., White T. B.& Winer, R. S. (2002). Dynamic Customer Relationship Management: Incorporating Future Considerations into the Service Retention Decision. Journal of Marketing, 66 (January), 1–14.
Lenormand, M., Louail, T., Cantú-Ros, O., Picornell, M., Herranz, R., AriasJ. M., Barthelemy, M., San Miguel, M. & Ramasco, J. (2015, May 30). Influence of sociodemographic characteristics on human mobility. Scientific Reports, 5 (10075), 1-15.
Limbu, Y. B. & Xu, B. (2012). Are college students at greater risk of credit card abuse? Age, gender, materialism and parental influence on consumer response to credit cards. Journal of Financial Services Marketing, 17 (2), 148-162.
Liu, M.T. (2009). Do credit card redemption reward programs work in China? An empirical study. Journal of Consumer Marketing, 26 (6), 403-414.
Magi A.W., (2003), Share of wallet in retailing: the effects of customer satisfaction, loyalty cards and shopper characteristics. Journal of Retailing, 79 (2), 97-106.
Ming-Yen Teoh, W., Chong, S. & Mid Yong, S. (2013). Exploring the factors influencing credit card spending behavior among Malaysians. International Journal of Bank Marketing, 31 (6), 481-500.
Mitchell, V. W. & Walsh, G. (2004). Gender differences in German consumer decision‐making styles. Journal of Consumer Behaviour, 3 (4), 331-346.
Seiler, V., Rudolf, M. & Krume, T. (2013). The influence of socio-demographic variables on customer satisfaction and loyalty in the private banking industry. International Journal of Bank Marketing, 31 (4), 235-258.
Sobolevsky, S., Sitko, I., Tachet des Combes, R., Hawelka, B., Arias, J. & Ratti, C. (2015). Cities through the prism of people’s spending behavior. Public Library of Science One, 11 (2).
Spradlin, D. (2016). Four Pillars of a Successful Rewards Program for Banks and Credit Unions. Retrieved from: https://thefinancialbrand.com/59016/banking-loyalty-rewards-program-strategy/
Subramaniam, R. & Marimuthu, M. (2010). Bank credit card and the selection criteria: An exploratory study. African Journal of Business Management, 4 (16), 3463-3472.
Verhoef, P. C. (2003). Understanding the effect of customer relationship management efforts on customer retention and customer share development. Journal of Marketing, 67 (October), 30–45.
Wang, L., Lu, W. & Malhorta, N. K. (2011). Demographics, attitude, personality and credit card features correlate with credit card debt: A view from China. Journal of Economic Psychology