Ionuț Costinel NICA, Simona Liliana CRĂCIUNESCU (PARAMON), Daniela ALEXANDRU (BLANĂ) and Ștefan-Andrei IONESCU
Bucharest University of Economic Studies, Bucharest, Romania
Volume 2021,
Article ID 852077,
Journal of Organizational Management Studies,
23 pages,
DOI: 10.5171/2021.852077
Received date: 17 September 2020; Accepted date: 9 February 2021; Published date: 10 June 2021
Academic Editor: Andreea Zamfir
Cite this Article as:
Ionuț Costinel NICA, Simona Liliana CRĂCIUNESCU (PARAMON), Daniela ALEXANDRU (BLANĂ) and Ștefan-Andrei IONESCU (2021)," Using of KPIs and Dashboard in the Analysis of Carrefour Company's Performance Management”, The Journal of Organizational Management Studies, Vol. 2021 (2021), Article ID 852077, DOI: 10.5171/2021.852077
Economic activity is the main concern of any society and it takes place in enterprises that use resources and become sources of wealth for the same society. The main goal of any business/enterprise, regardless of its form, has been to make profit and gradually improve it. This is only possible through cost control and revenue growth, which is directly linked to the constant adaptation to market demands. Managing the company’s activity and analyzing the level of performance are essential to have financial stability and a competitive advantage. Performance analysis techniques have a special role in following up the evolution of the company and determining the problems in the processes. Thus, the company manager can set standards of excellence and ensure that they are met. The use of these methods ensures that appropriate decisions are taken to reduce costs and maximize profits. This paper aims to identify the main methods and techniques of enterprise performance analysis and proper data management, and the case study is focused on Carrefour, with the aim of studying the main key performance indicators and identifying problems. The own approach of this research consists in identifying the most important key performance indicators from the financial perspective for the elaboration of a dashboard at the level of the Carrefour organization. It could contribute to changing the way of analyzing and investigating performance, by intervening in times when the analyzed indicators no longer perform.
Currently, enterprises have a special role in the economy, as the ability of the entrepreneur is a very important neo-factor of production. Western entrepreneurship and technological progress have sprung up for centuries, with a positive influence on the world.
The basic context for the emergence of enterprises is considered to be composed of constants such as money, accounting for the calculation of earnings, credit and basic contractual formalities.
The origin of the concept of “a company” dates back to the 16th century in India when there were certain groups of merchants and artisans who played an important role in trade. The importance of traders grew in medieval Europe. Trade began as a profitable exchange between individuals and households, gradually growing in an organized form. Since the 1980s, organizations have replaced typewriters with computers to perform certain tasks, such as processing fees. During this period, there was a rapid increase in the outsourcing of goods and services, while firms sought new ways to reduce costs and increase efficiency.
The end of the twentieth century was marked by a rapid transition from mechanical to digital, with new technologies being used more and more, and at the same time, the Internet became a platform with a major impact on the world trade. It significantly changed the way businesses operated, and began to be used as an important aspect of a stable business model, through which, reservations could be made for means of transport or banking.
The 21st century has witnessed the development of new technologies with a role in the outsourcing of administrative services, thus creating a new branch of service companies, now a competitive industry. Companies have evolved in direct proportion to technology, leading to the facilitation of operations through digitization, which resulted in an increase in the complexity of how companies operate.
The article is structured in three main chapters that combine the theoretical elements with the practical ones, considering the efficient management of the activity and the monitoring of the performance using certain instruments, later transposed in a dashboard.
The first section tackles the evolution of the concept of “a company” and how it was originated, as well as the role of knowledge in achieving good performance. Theoretical aspects of managing large volumes of data and an in-depth understanding of the activity are also described. Moreover, in this chapter, the composition of the supply chain of a company and its importance in terms of consumer satisfaction are analyzed.
The second chapter presents, at a theoretical level, the analysis of performance in terms of efficiency, effectiveness and adaptability. This chapter highlights the most important methods for obtaining a clear picture of the entire business and increasing customer satisfaction. At the same time, the key performance indicators that underlie the diagnosis of the company’s economic activity are described, as they have an essential role in measuring progress. In addition, the methods through which forecasts can be made are detailed, some of them based on mathematical elements.
The last section contains the case study on the Carrefour company, having as an objective, the analysis of the performance and the identification of the problems using the key performance indicators. The analysis was performed over a period of eight years (2012-2019), using as a forecasting method, the logistic regression, starting from financial indicators. In addition, in order to have an overview of the entire activity, a performance dashboard will be created.
The key performance indicators (KPIs) considered were used to track the evolution of the company from several points of view, such as the ability to use capital efficiently and make profitable investments. On the other hand, the degree of indebtedness and the ability to fulfill one’s obligations are monitored. The results of the scoreboard analysis were used to identify the level of financial stability and the degree of risk in the last eight years.
Enterprise, big data and the role of knowledge in the enterprise
At present, enterprises have a special role in the economy, as the ability of the entrepreneur is a very important neo-factor of production. Western entrepreneurship and technological progress have sprung up for centuries, with a positive influence on the world.
The basic context for the emergence of enterprises is considered to be composed of constants such as money, accounting for the calculation of earnings, credit and basic contractual formalities.
The notion of a knowledge-based organization was originated in 1984-1988, as “a community of workers with design work, interconnected through a computerized infrastructure” (Holsapple, C. W., 1987). A knowledge-based enterprise is focused on using and integrating knowledge to achieve good performance, and resources are mainly focused on learning. Within such a company, there are many opportunities for employees to learn, which are non-existent in a traditional company.
The main aspect of the knowledge-based organization is the knowledge fund, which is considered a main resource of the organization, with an important role for its performance and intellectual-intensive processes, being essential for the functioning of the enterprise and achieving its objectives.
A knowledge-based enterprise has four essential dimensions:
Process – consists of activities carried out within the company, some of which are related to the production or sale of a product. A knowledge-based organization is focused on two interconnected processes, which support the core activities: the efficient use of existing knowledge, and the creation of new knowledge.
Place – refers to the boundaries of an enterprise that, for the purpose of sharing or creating knowledge, can cross traditional legal boundaries.
Purpose – includes the mission and strategy of the company, starting from the premise that the main strategic resource is knowledge.
Perspective – a knowledge-based enterprise is oriented more towards the exploitation of knowledge than towards the sale of products, with knowledge being applied in any aspect of the activity.
Knowledge and organizational culture are strongly linked, and improving the way a company creates and implements knowledge could not be achieved without a simultaneous change in culture.
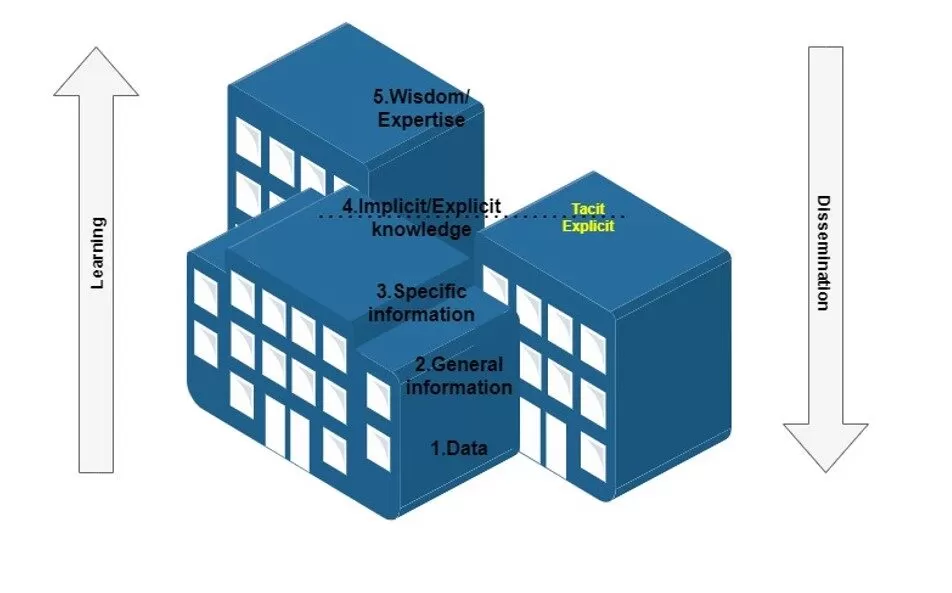
In its basic form, knowledge is a combination of information and the human context that enhances the capacity for action. The first dimension of knowledge can be seen at the individual, group or organizational level. The second dimension includes explicit and implicit knowledge, or structured and unstructured. Explicit or structured knowledge can be found in documents, databases and processes, while implicit or unstructured knowledge is dependent on context and personal experience.
Figure 1: The hierarchy of knowledge
Source: The design is done by the authors.
Knowledge management helps the company find, select and organize important information for problem solving and decision making. It addresses issues of organizational adaptation and survival in the context of discontinuous environmental change.
Organizational culture is an important aspect in promoting knowledge sharing and creation. It can be described by values, norms and practices. Values highlight the beliefs of members of an organization about what should be done, indicating preferences for a specific outcome or behavior. Norms are common views on how members should behave or how to perform their tasks. Practices include the formal or informal routines of the organization to achieve its goals, such as implementation processes or group meetings.
Culture has a mediating role in the relationship between knowledge at the individual level and at the organizational level, creating the context for social interaction. It also has a significant role in the efficient management of knowledge. Knowledge shared and maintained within the enterprise has a key role to play in productivity and process improvement. Knowledge management aims at the simultaneous development of each component within a company, such as staff, equipment, and space.
Big Data refers to the large volume of data that is difficult to manage, which requires the use of various technologies in order to obtain information. The term “Big Data” was coined to differentiate the abundance of unstructured data; machine-generated data from ordinary data that has been generated by transactional systems for many years. Unstructured data is represented by documents, photos, videos, and social media, while structured data comes from relational databases, company resource planning, and customer relationship management.
The McKinsey Global Institute predicts that the volume of data will increase by 40% per year (James Manyika, 2011). Although the volume of data is often the most visible parameter, there are other issues that matter. The four characteristics that define Big Data are:
Volume: represents the amount of data generated. The volume of data can reach unprecedented levels. It is estimated that 2.5 quintillion bytes of data are generated every day, with large companies having terabytes or petabytes of data stored on devices or servers. This data is used to shape the future of an enterprise and its activities, while monitoring progress.
Speed: social media data produces a large flow of valuable opinions for customers. Facebook users upload more than 900 million photos in a single day. Speed is directly related to the entire data infrastructure in managing and delivering data to recipients as quickly as possible.
Variety: variety in Big Data refers to structured and unstructured data that can be generated by either humans or machines. The most frequently added data are txt structures, tweets, videos and images. Variety involves the ability to divide the data received into various categories.
Truthfulness: refers to an uncertainty of available data, preventing companies from reacting quickly and finding appropriate solutions. The main problem in such a large data environment is accuracy. For a better data use strategy, the data must be organized according to groups, value and significance; data needs to be clean, consistent and consolidated.
Big Data analysis can be used to discover certain opportunities that are not obvious at first glance; many companies extract large amounts of data in order to find out hidden information that was not previously available to them.
In order to capitalize on everything related to a large volume of data, it is necessary to structure all non-structured data, and this can be done by using approaches to decipher the meaning of unstructured data and group them according to important areas, such as customer, product, market, company, etc. The next step is to perform a predictive analysis by extracting templates from the data and using them to predict possible future trends. Because they cannot be determined exactly, probability intervals can be useful in regulating resource implementation decisions and setting expectations.
Following the predictive analysis, the future requirements of the market can be identified, thus managing to attract a larger number of consumers. Big Data also allows one to profile customers and engage in a real-time conversation with them. For example, when a customer enters a bank, the official can check his profile, find out his preferences, and use this information to recommend the relevant products and services for that customer.
The tools in this field allow the mapping of all data within the company and the analysis of all internal threats. Thus, sensitive information can be kept secure in accordance with regulatory requirements. Security and data protection are indispensable in financial organizations.
Methods for measuring the performance of an enterprise
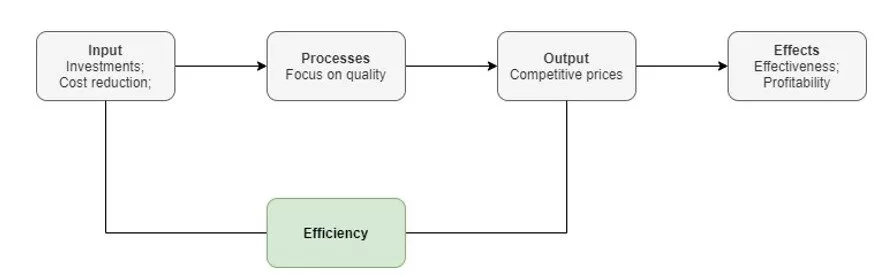
Regarding the analysis of a company’s performance, as well as its competitiveness in the market, three dimensions can be identified: efficiency, effectiveness and adaptability.
Efficiency assesses the proportion of limited resources used in the production process to achieve a certain result. This concept is based on the terms inputs and outputs. An efficient enterprise is the one that results in as much volume as possible using a limited number of inputs. Efficiency is not a measure of market success, but rather of pursuing productivity and minimizing costs.
Effectiveness is determined by the degree to which the result obtained is in line with the proposed objective. It is also closely linked to the means adopted by each company to generate sustainable growth in the business environment.
Adaptability involves analyzing changes in efficiency and effectiveness that have occurred as a result of a change in the company’s environment.
An important aspect is also the focus on efficiency and negligence of effectiveness, which result in temporary profitability. On the other hand, considering only efficiency result in lack of profitability, given that the opportunity cost of capital is higher compared to the profit obtained.
Efficiency involves financial discipline as well as control over working capital, while efficiency requires the ability to adopt the appropriate means for sustainable growth, which is directly proportional to the firm’s access to and differentiation from other companies’ private resources.
Businesses apply various methods to increase both the level of efficiency and effectiveness. More and more companies have taken over the organization of staff into teams as a technique to improve performance, which is considered a key element for increasing efficiency. The bases of effectiveness were also identified starting from the nature of teamwork. Cloud computing has proven to be a tool with many advantages in terms of efficiency through easy document sharing and active collaboration, while reducing certain costs.
In order to be considered competitive, a company must use its resources to produce appropriate and quality goods, setting an appropriate price. In the long run, competitiveness is measured by the company’s ability to continue its business and protect its investment, generating its profitability. Productivity is considered a determining factor for a company’s competitiveness, along with profitability and participation in the internal and external market.
Productivity is the result of the interaction between organizational management and external factors, constituting the ability to transform the inputs used into products. In economics, this is the rationale of what is produced and what resources are needed for that production, which is measured by comparing inputs and outputs. Productivity measurement is reflected in changes in production efficiency. Also, in order to increase the company’s productivity, it is recommended to identify and analyze inefficient resources, so as to reduce unnecessary expenses. In highly productive organizations, a direct link can be seen between productivity and competitive advantage.
Customer Relationship Management
Customer Relationship Management is a business strategy that involves understanding, anticipating and managing customer needs, in order to maintain a long-term mutually beneficial relationship. This is a shift from traditional marketing that focuses on retaining current customers and attracting others. A CRM tool creates a simple interface for data collection, so that the company can communicate with consumers in an accessible way.
The objective of this strategy is to create value for both buyers and the company in the long run, offering the opportunity to have a competitive advantage over companies in the market that offer similar products, and also an increase in profit.
Customer relationship management helps companies find out useful information about customers, such as the category they belong to and why they buy products, forecasting purchasing trends. Thus, the needs that have to be met later can be anticipated. By organizing customer data, the appropriate selection of recipients for promotions and new products is ensured.
Another advantage of this concept is the increase of efficiency by automating certain aspects such as sales processes and marketing campaigns, allowing the structuring of processes into simpler data.
The main types of customer relationship management are: operational, analytical and collaborative.
Operational CRM focuses on automating and improving processes based on customer relationships, being suitable for companies with a shorter sales cycle and e-commerce.
Analytical CRM specializes in analyzing information about buyers, determining their behavior and market trends. It uses data mining techniques, being suitable for companies in a market with high prices and many competitors.
Collaborative CRM involves sharing information with external companies, by combining data to increase customer satisfaction. It is suitable for companies where innovation and the development of new products are essential for success.
Technology has an important role in customer relationship management, involving the use of databases and data mining techniques. The benefits are reduced costs by increasing effectiveness and efficiency, making a long-term profit and maximizing opportunities.
Dashboard
A dashboard is an information management tool that analyzes, selects and displays key performance indicators (KPIs) to identify the situation of the company and the synthesis of the activity carried out. It offers the possibility to monitor and enhance performance in real time, thus reducing the analysis time.
Dashboards can make it easier to view data and share key information both internally and outside the company. They also contain predictive analyses, determining trends and patterns. Thus, it can be useful for strategy, planning and analysis.
The main features of a dashboard are:
Synergy- A visually efficient and ergonomic design is needed to be able to synthesize certain information from a single view.
Accuracy – The information captured must be accurate in its entirety, the rendering of economic processes must be accurate, and their transmission has to be done in real time.
Flexibility- The structure can be adjusted according to the changes.
Accessibility- The information must be configured so that it can be used quickly and meet predefined thresholds.
News- Data display must be done in real time for effective decisions.
The elaboration of a dashboard can be done in four stages:
Identifying problems and determining objectives- Choosing key data and performance indicators to be highlighted in the dashboard.
Determining end-users and establishing a plan- Identifying information that is relevant to the end-user and that directly influences the objective.
Selection of appropriate indicators – Selection of the most relevant indicators in terms of assessing the outcome of actions.
Drawing up the dashboard – Using ways that allow a good view of the indicators, so that the message is communicated effectively.
Dashboards can be of three types: operational (allow supervisors to monitor operational processes), tactical (allow analysis of processes in each department) and strategic (monitor progress towards the proposed objective).
The advantages of dashboards include: real-time monitoring of changes, centralization of all data in one place so that they can be accessed by all users, forecasting based on current trends and identifying negative trends.
Dashboards can be made for each department of the company, such as: legal, IT, financial, human resources, accounting, and marketing.
Balanced Scorecard
Balanced Scorecard is a method of aligning the company’s activities with the vision, while evaluating performance. It is also a mechanism that can be used to implement the strategy, defining important success factors.
This technique can be used to improve organizational performance, focus on strategy and results, and communicate vision and strategy appropriately. Scorecards consist of quantitative components, both visual (tables, graphs) and symbolic (key performance indicators).
The Balanced Scorecard model includes viewing the business from four perspectives:
Financial- Satisfying the requirements of shareholders and creating value. Examples of measures: economic added value, cash flow.
Internal business processes – The quality of internal processes, establishing the desired level of productivity. Includes measurements in terms of innovation, activities (quality, time, and cost) and after-sales services.
Development and innovation- Engaging all intangible resources in order to improve critical processes. Includes measurements in terms of staff (training, skills) and system.
The main advantages of Balanced Scorecards are: providing a clear image of the company, understanding strategies at all levels and continuously improving the economic activity.
The difference between scorecards and dashboards is in their functions: although both techniques are related, the former can be used to manage performance, while the latter helps to monitor performance. Also, the application context is different: scorecards are strategic while dashboards are operational. A scorecard provides information that is not found in a dashboard, with in-depth analysis capabilities and performance predictions. On the other hand, the second is more open to interpretation.
Benchmarking
Benchmarking is a continuous systematic process of measuring outputs and processes, identifying the main sources of competitive advantage. Through this method, an enterprise can protect itself against competition.
The main types of benchmarking are:
Internal – Comparison of processes carried out within the company. It is easy to implement, and it provides quick access to data, but it is time consuming.
Functional – Comparison of functions and work tactics activated in different sectors. It is not suitable for any type of business.
General- Identifying innovative technologies that can be used in several types of economic activities.
Competitive – Comparison with similar companies based on performance measures.
The benefits of benchmarking include identifying the strengths and weaknesses of an enterprise and improving its competitive advantage. It is also cost-effective and time-efficient. These can be done for goods and services, work processes, human resources department, organizational performance and strategies.
Using this method, standards of excellence can be established and met by constantly searching for the best processes and applying them, while improving organizational performance. On the other hand, one can identify how the processes of the best listed companies on the market work.
Key Performance Indicators
Key performance indicators are financial and non-financial indicators used to estimate a company’s success in pursuing long-term goals previously set. High-level KPIs focus on the overall performance of the company, while low-level KPIs consider processes in departments such as marketing, sales, and human resources.
These indicators are focused on future results, underlying decision-making by providing accurate information on trends. They are also used in various industries for specialized purposes, such as: maintenance, sales, construction, marketing, supply chain management and information technology (IT). KPIs used in IT contain: code (number of lines of code), complexity (loops), understanding inputs and outputs, as well as antivirus.
The purpose of a KPI is to track performance measures that track changes towards a target, indicating the level of progress made in achieving the project objectives. At the same time, key performance indicators identify the relevant elements for performance and for providing information on the appropriate controllable factors for making decisions that will lead to a positive outcome. On the other hand, they do not indicate the measures to be taken to correct deviations from the target.
The three high-level goals of the indicators are: team motivation, compliance with the use of organizational process assets and alignment with company objectives, improving performance and taking over best practices.
The SMART rule is used in the literature to identify the characteristics of a KPI:
Specific (S) – is focused on performance goals;
Measurable (M) – can be expressed quantitatively;
Achievable (A-attainable) – targets are reasonable, achievable;
Realistic (R) – is relevant to the work done in the project;
Time-based (T) – is measurable over a period of time.
The components of a key performance indicator are: measurement, target (a set of values against which measurements will be made), data source and reporting frequency (at least monthly). The main types of targets are: simple quantitative, time-based objectives (measurements performed at a certain time interval), and completion objectives (measurements performed at the end of the project).
The most commonly used financial KPIs are: net profit margin, operating cash flow, inventory turnover (sales/inventory), return on equity (return on equity) and EBITDA (profit before interest, taxes, depreciation and amortization). The latter is calculated by the sum of net profit, interest expense, tax expense, depreciation and amortization expense. Depreciation refers to property, plant and equipment and depreciation to intangible assets.
The net profit margin (net profit/income) indicates the level of efficiency of a company that generates profit compared to its income. Usually calculated as a percentage, it shows how many monetary units earned are translated into profit.
Return on equity measures a company’s ability to use shareholders’ investments efficiently, generating high profits. It is calculated through dividing the net income by equity.
Non-financial KPIs can be an advantage in identifying strengths and weaknesses, as well as providing better feedback to employees on how to meet strategic objectives. Thus, the staff is able to understand exactly what they have to do, as there is a link between daily tasks and the strategic direction.
Examples of non-financial indicators are: customer retention rate (number of consumers remaining customers over a given reporting period, calculated as the ratio of customers lost in a given period to the number of customers at the beginning of the same period), employee productivity rate (force efficiency of labor, calculated as the ratio between the total income of the company and the total number of its employees), and the percentage of project delays (number of delayed projects/total number of projects).
Key performance indicators are of particular importance in monitoring the state of the enterprise and in measuring progress. They can also be used to make adjustments, predict future results, solve certain problems and address opportunities.
The techniques of analyzing the performance of an enterprise are of particular importance for its stability, determining the current financial position. They identify the company’s situation, assessing whether it is in line with its vision and objectives, thus highlighting the main problems.
The main advantages of these techniques are the centralization of all data in one place so that it can be accessed by all users, the identification of trends and the significant reduction of time. Also, through these techniques, predictive analyses can be performed based on current trends, highlighting certain patterns useful for strategy and planning.
Proper management of information, using these techniques, ensures that the right decisions are made to remedy problems and focus on results. On the other hand, standards of excellence are set and the best processes are determined to achieve them.
In conclusion, the techniques of analyzing the performance of an enterprise are essential for providing a clear picture and understanding of its strategies at all levels. With their help, a continuous improvement of the economic activity can be ensured, while reducing the costs.
Case Study: Carrefour performance monitoring
Carrefour is a French multinational corporation specializing in retail, being among the first positions in the top supermarket chains globally. It was founded in 1959, with Marcel Fouriner and Louis Defforey as founders. In 1960, the first store was opened in the Annecy district of Haute-Savoie.
The Carrefour Group was the first to introduce the concept of a hypermarket in Europe, opening one in 1963 in a town near Paris, Sainte-Geneviève-des-bois. The success of Carrefour was based on low prices, stock turnover and reduced equipment costs. The innovative nature of weighing, packaging and collection has also attracted a large number of consumers, with a negative impact on small businesses.
In 1970, the company’s shares were listed on the Paris Stock Exchange. At that time, high inflation rates resulted in increased competition for food prices. In 1973, the Royer law was passed in France, imposing restrictions on large stores. Thus, Carrefour focused on expanding to other countries (Spain in 1973, Brazil in 1976 and Argentina in 1982).
In April 1976, a line of fifty foodstuffs was launched with a private label called “Produits libres” and substantially lower prices.
Carrefour merged, in 1999, with its main competitor, Promodès SA. Due to the increased competition and weaker sales in France, its market share decreased. On the other hand, during this period, the first hypermarkets were opened in Asia.
In 2017, Carrefour gave birth to a French start-up, Expliceat, building a mill designed to crush the remaining bread, later using the crumbs for various pastries. A strategic plan (“Carrefour 2022”) was also announced a year later, which includes improved food sustainability, waste reduction and the development of organic products.
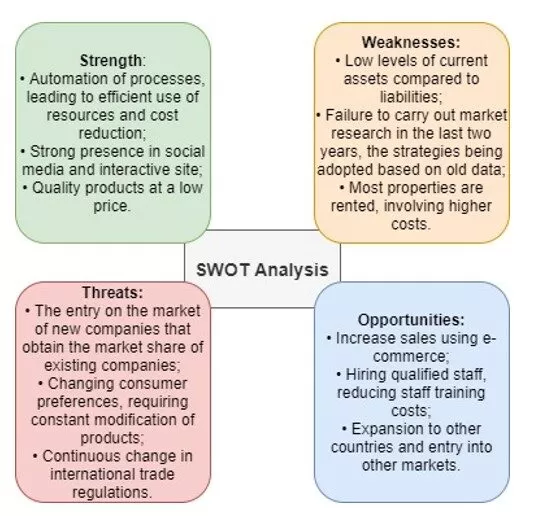
Figure 2: Swot Analysis
Source: The design is done by the authors.
In terms of listing, the market capitalization is $ 12.04 billion and the value of the enterprise is $ 29.76 billion. Also, the profit margin is 1.53%, which means that the company earns $ 0.0153 for every dollar traded.
Database Description
In this research, the financial indicators of Carrefour from the period between 2012 and 2019 were chosen as an analysis study. The data source is the website: http://www.carrefour.com/content/results, accessed on 15.09.2020. Thus, the indicators contained in the database are total revenues, gross profit, net sales and net income, expressed in millions of euros. Also, the evolution of performance can be analyzed using EBITDA (profit before interest, taxes, depreciation and amortization), and cash flow, as well as marginal indicators such as gross margin, net profit margin, return on equity (ROE), return on investment (ROI) and return on assets (ROA).
Return on investment measures the return-on-investment relative to its cost, calculated as the net profit divided by cost and expressed as a percentage.
The return on assets indicates the efficiency of the firm’s use of assets, calculated as the ratio between the net profit and total assets.
In terms of net sales, they are recorded between 2012 and 2019, expressed in detail for each continent (Europe, Latin America and Asia). On the other hand, the database contains information on the main categories of products sold in Carrefour stores, as well as the number of products of each type.
Another category of financial indicators included in the database is liquidity, efficiency and exchange ratios. Thus, data on the current ratio, the fast ratio and the debt/equity ratio of the last eight years were introduced in order to analyze the company’s ability to meet its financial obligations. The database also contains stock turnover rates, which are then used to measure the short-term performance of the company.
In addition, essential data of the company are included such as share capital (contributions of all partners), depreciation, amortization and investment expenses, net debts and the total number of employees.
Behavioral influence of consumers using logistic regression
Key performance indicators are of particular importance in measuring the overall performance and determining the factors that directly influence consumers. In the case of Carrefour, there is a strong link between these indicators, significantly impacting financial results and market positioning.
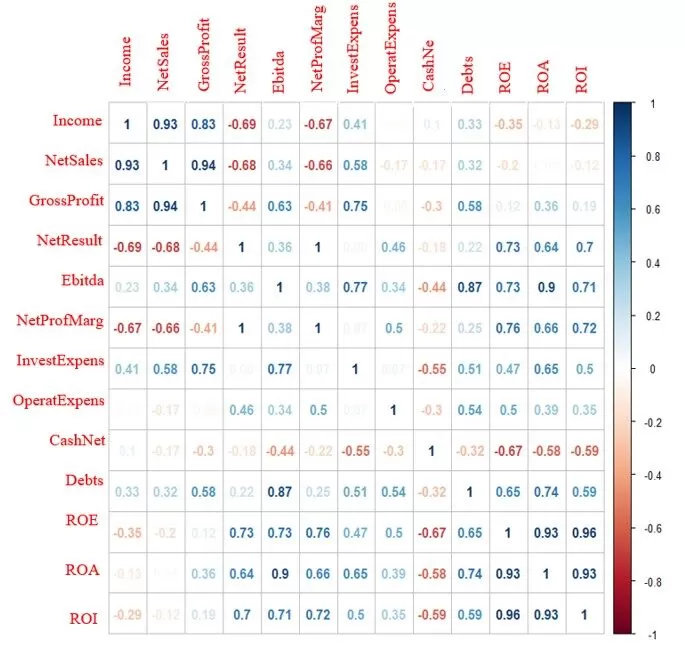
Figure 3: Correlation matrix of key performance indicators
Source: Authors’ computation in R Studio
At first glance, it can be said that in the matrix of correlation coefficients, there are both positive and negative correlations. Also, some variables are strongly correlated with others, with a correlation coefficient higher than 70%. Thus, they have a similar behavior and evolve in the same direction. In the figure above, one can see very high correlation coefficients. Thus, the net sales strongly impact the revenues (correlation coefficient 93%) and implicitly impact the gross profit (correlation coefficient 94%), these variables having a special relevance in the analysis of Carrefour’s performance. On the other hand, the gross profit is 75% influenced by investment expenditure, suggesting that the increase in investment would result in higher gross profit.
Another direct relationship is between the net result and ROE, the correlation coefficient being 73%.
It can be stated that EBITDA has a behavior similar to that of the ROA variable. The first indicator directly influences the return on the total invested capital, as well as the efficiency of shareholders’ capital use with ROE, with the coefficient being 73%. Also, the ROA variable is 74% dependent on the net debt. An increase in debt means a low rate of return on assets. On the other hand, in terms of the net profit margin, it is strongly correlated with ROI, the coefficient being 72%. Both indicators are significant for determining the level of efficiency of Carrefour.
Observing the two figures, one can see a low relevance of the variables net cash flow and operating expenses, which can be eliminated from the analysis.
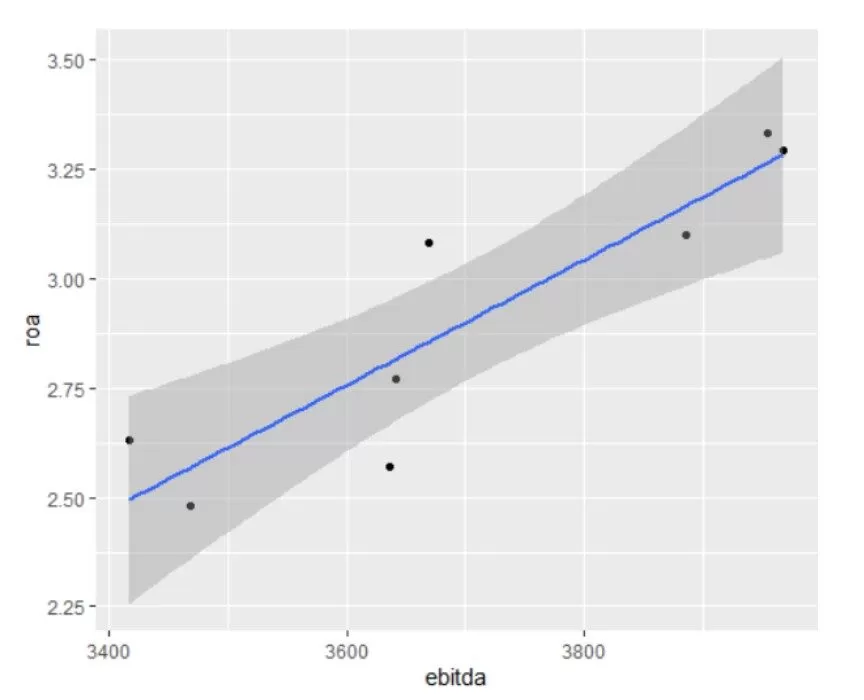
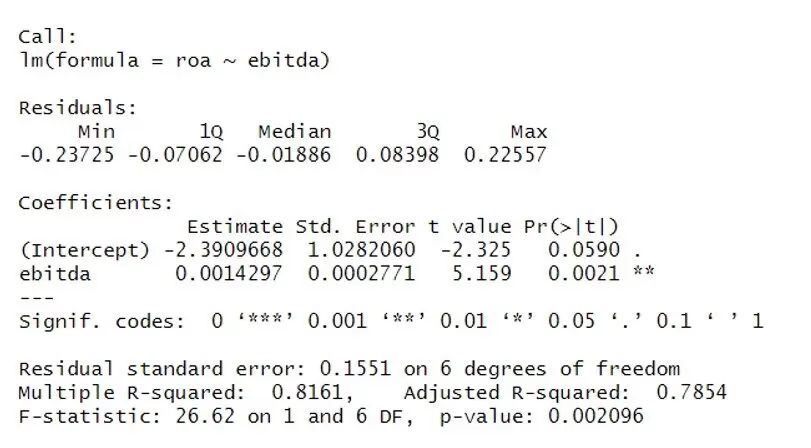
Although it is a difficult approach to understand and can be criticized if tackled only from inside the box and not outside the box, the following regression was performed to observe the links between ROE and EBITDA in measuring the performance of the analyzed enterprise. From the figure above, one can see a direct and positive link between the financial indicators EBITDA and ROA in the case of Carrefour, evolving in the same direction. On the other hand, the values are not evenly distributed on the regression line, meaning that there are certain values as outliers.
Figure 4: Analysis of the evolution of the ROA indicator according to the EBITDA indicator
Source: Authors’ computation in R Studio
Figure 5: Relationship between EBITDA and ROA indicators
Source: Authors’ computation in R Studio
Regarding the analysis of the link between EBITDA and ROA indicators, one can say that the linear regression model is a valid one, with a p-value of 0.002096, less than 0.05.
The relationship between the two financial indicators is strong, as the variation of the ROA variable is determined in proportion of 81.61% by the evolution of the EBITDA variable, the rest being explained by other factors. Thus, a higher value of profit before interest, taxes, depreciation and amortization would mean an increase in the efficiency of the use of assets.
The linear regression equation is , where the dependent variable () is ROA and the independent one () is EBITDA, which assumes that when changing the value of the EBITDA indicator by a monetary unit, the rate of return on assets for Carrefour will be modified by 0.00143 units.
The Carrefour store network is predominant in France and other European countries, as well as in Latin America. Also, approximately 250 supermarkets are opened in Asia. In 2016, the company also approached the African market. Consumer satisfaction varies from one region to another, being influenced by certain factors.
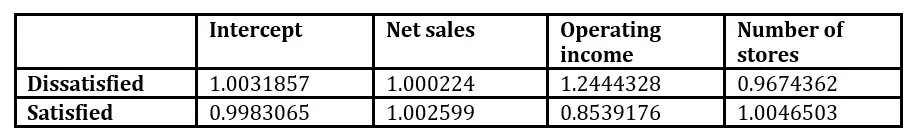
The study will establish the link between consumer satisfaction and the number of stores open in each region, net sales and the operating income. The dependent variable is the degree of satisfaction, having 3 values: dissatisfied, satisfied and very satisfied, taking as a reference the number of very satisfied consumers.
The equations of the regression model can be described as:
Thus, one can see that an increase by one unit in the number of stores is associated with a decrease in the chances of having dissatisfied consumers compared to those who are very satisfied by 0.033, and also an increase in the chances of having satisfied consumers by 0.005.
>Exp(Coef(Model)
Table 1: Coefficients of the logistic regression model
It can be said that the chances that the degree of satisfaction will be reduced are 3% lower, and those that the degree will be high are 0.5%, being higher than the chances that the degree of satisfaction will be very high in case of increasing the variable number of stores by one unit.
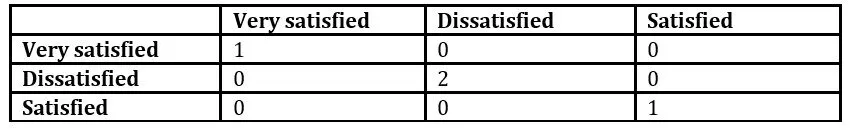
Table 2: Matrix of confusion
Of the 4 regions (Latin America, Asia, France, Other European countries), all were correctly labeled (being positioned on the main diagonal). Thus, consumers attracted by Carrefour in Latin America and Asia are dissatisfied, those in France are satisfied, and customers in other European countries are very satisfied. Following the analysis, one can see that the opening of new supermarkets would result in a higher degree of satisfaction.
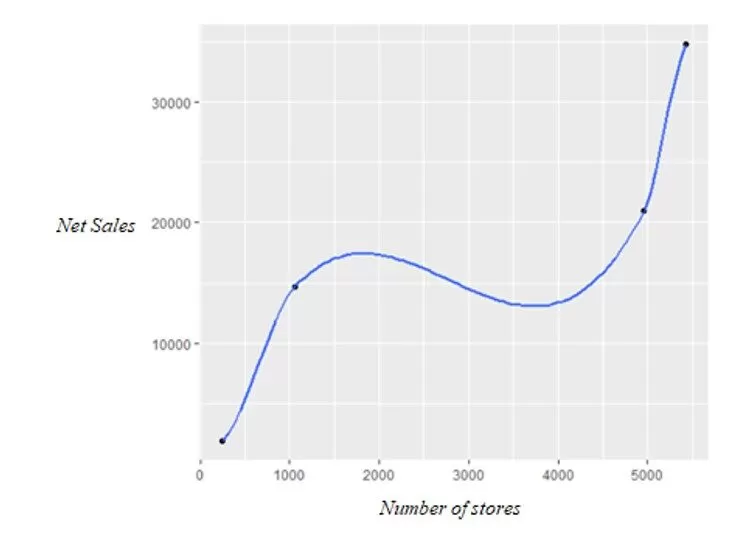
Figure 6: Analysis of the evolution of net sales according to the number of stores
Source: Authors’ computation in R Studio
Also, the link between the number of stores and net sales in the four regions is a direct one, and the increase in the number of supermarkets would lead to an increase in sales.
Key performance indicators (KPIs) are of particular importance in analyzing the evolution of the enterprise from a financial point of view. As for Carrefour, there is a strong link between certain KPIs. The indicators can be divided into several classes. These indicators represent the effects of the realized production and the services offered to the consumers, highlighting the company’s efficiency.
Based on the analysis of the correlations between the indicators, the authors proposed the grouping of revenues, having net sales and gross profit in a first cluster, debt and EBITDA in a second cluster, and ROI, ROE and net income in a third cluster, evolving in the same sense.
The first cluster contains the most important results, highlighting the company’s ability to obtain revenue and at the same time satisfy customer demand. It is directly related to the company’s objectives, indicating its financial stabilization and position.
The second cluster contains indices through which it is possible to analyze how efficiently the assets are used and the ability to pay their debts. It has a direct relationship with the third cluster, highlighting how efficiently equity and investments are used to increase the value of the net result, which is one of the main objectives of Carrefour.
As for the financial indicators belonging to the first class, they have an oscillating trend. Between 2012 and 2014, the trend was a decrease in net sales and revenues, following a slight increase that reached its peak in 2017. Starting from 2017, revenues and profit were continuously decreasing.
The decrease in revenues is caused, according to critics, by the follow-up of a business model developed in 1960, which does not comply with the current market situation, requiring an improvement in the mode of operation. Also, the negative trend of margins in France was caused by high costs related to the acquisition and transformation of a network of 400 Dia supermarkets. This acquisition was made in the fourth quarter of 2016. Thus, in 2017, Carrefour suffered significant losses, taking at least a year to form a customer base. These results were also reflected in the company’s net result.
Although the net result has been steadily declining since 2014, it was positive until 2017. In 2017 and 2018, Carrefour had very high losses in France, which represents half of the group’s revenues, having sales falling for six quarters row. The negative net results were a consequence of the large loans obtained to purchase the Dia chain of stores in France. The investment did not generate the expected revenue, and the costs of keeping stores open in France resulted in significant losses.
After two years in which negative results were registered, in 2019, the net result was 1311 million euros, as Carrefour was investing in remodeling the initial format and modernizing the stores to increase sales. The company’s transformation plan includes reducing sales promotions in France, focusing on lower prices and reducing the number of non-food items. In addition, they initiated the merging of supply chains of supermarkets with those of hypermarkets and the restructuring of IT systems to generate savings.
Carrefour recorded the highest level of debt in 2014, reaching the threshold of 9 billion euros. The increase in the net debt was caused by the group’s desire to accelerate its expansion in emerging markets in Brazil and China by taking over a network of competing stores, which is only possible through large loans. After 2014, the debt level had an increasing trend, reaching, in 2019, the lowest threshold in the last 10 years.
Regarding the EBITDA indicator (the company’s earnings before interest, taxes, depreciation and amortization), it had an upward trend until 2016, after which it started to decrease gradually. Thus, the company generated a higher income before the acquisition of the Dia supermarket network.
Return on equity decreased significantly between 2014 and 2017, reaching a negative threshold, due to an inefficient use of shareholders’ investments by acquiring non-profit chain stores in France and Latin America during that period. Starting from 2018, the results have increased as a result of the implementation of the project of transforming the initial format.
Regarding the ROI indicator, it fluctuates from one year to another, registering decreases between 2013-2014 and 2015-2017, having a negative value in 2017. Thus, Carrefour did not always invest efficiently, with the total costs exceeding the return on the investment. Starting from 2018, the return on investment has been constantly growing, when the competing networks purchased started generating higher and higher revenues.
The decreasing trend of the net profit was also reflected in the net profit margin, which had a negative value in 2017, indicating that Carrefour no longer had the ability to effectively make profit relative to its revenues. As a result, the market share decreased, leading to an increase in the market share of the main competitors.
Since 2018, the net profit margin has had an increasing trend, as the evolution was similar to the other key performance indicators. This was the year in which Carrefour began to recover financially.
Another category of the financial accounting indicator used as enterprise performance measures includes liquidity, efficiency and exchange ratios. Liquidity ratios highlight the company’s ability to meet its short-term financial obligations without the use of external capital. The main liquidity ratios are the current ratio and the fast ratio.
The current ratio measures the ability to pay current debts with current assets (cash, accounts receivable and inventories). It is calculated by dividing current assets by current liabilities.
The rapid report analyzes the ability to meet short-term obligations with the most liquid assets.
Efficiency reports (or activity reports) are used to measure the company’s short-term performance, highlighting the ability to use assets appropriately to generate revenue. An example of such a report is the stock turnover rate, which shows how many times the inventory has been sold and replaced in a given period.
In terms of stock turnover, its value is quite high, meaning that Carrefour can meet consumer demand without depleting its stock, and at the same time without having a lot of money stuck in stocks. Also, the costs of storing the products are low, because they are sold in a short time. The lowest value of the stock turnover rate in Carrefour was reached in 2016 as a result of the slowdown in sales.
In 2018, Carrefour started implementing the “Carrefour 2022” strategic plan, with the main objectives of streamlining the organizational structure, obtaining higher productivity gains, investing in e-commerce and focusing on product quality. Thus, the aim is to reduce management costs in order to offer competitive prices, increase control over expenditure and improve operational efficiency. The initial proposal is to reduce spending by 2.8 billion euros gross by 2020.
Significant cost reduction plans and a more effective investment policy are needed to increase growth and improve competitiveness. The cost reduction plan focuses on the operational efficiency of the supply chain and the simplification of headquarters’ organization. Therefore, the group’s intention is to reduce the number of stores that belonged to the Dia chain by 273, as they are not adapted to their catchment area.
In terms of investments, a large part of them will be allocated to the supply chain for the automation of order preparation platforms. It also aims to open 2,000 stores between 2018 and 2022 and invest 2.8 billion euros in the digital platform.
Following the implementation of the strategic plan, in 2019, there were solid increases in sales, with 25% more in terms of organic products (sales worth 2.3 billion euros) and 30% more in the case of e-commerce (up to € 1.3 billion). At the same time, the recurring operating income increased by 145 million euros compared to the previous year, suggesting a solid and profitable growth.
Carrefour has managed to achieve a satisfactory level of competitiveness in key regions such as Latin America and Spain, and in France, it has regained focus, improving its price positioning. While the profit margin decreased by 0.7% in France due to the increased competition, it stabilized at 3.2% in the rest of Europe, and in Latin America, Carrefour consolidated its operating profit margin from 4.5% to 5.7%. The company also managed to save 1.05 billion euros following the closure of the 273 Dia stores.
Observing the results obtained by applying the “Carrefour 2022” plan, an increase in the level of efficiency due to financial discipline was noted, complemented by an increase in efficiency, leading to results in line with the proposed objectives. Thus, Carrefour has adopted the appropriate means for sustainable growth and high competitiveness.
The productivity of the company can be measured by comparing the inputs used and outputs, also reflected in changes in efficiency.
Figure 7: Value flow analysis
Source: The design is done by the authors.
Dashboard Carrefour
There are many factors that directly influence the performance of Carrefour and should be taken into account to improve the business. Given that about 50% of the company’s revenue comes from sales in France, it is necessary to bring innovative elements to retain or even increase the number of customers. Latin America is also an investment-friendly region, with the opening of new stores leading to increased profits. As for the Asia region, it has a lot of potential for the development of a hypermarket chain, with a high purchasing power.
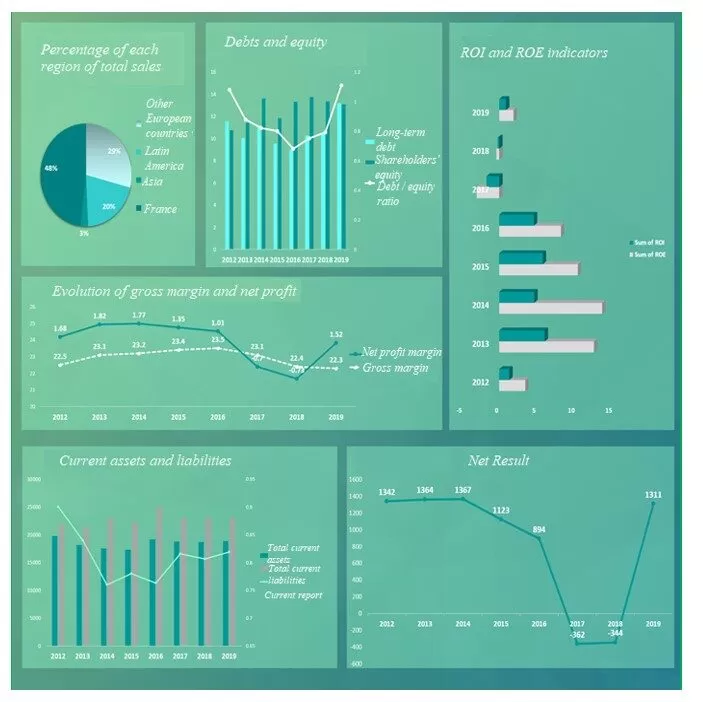
Figure 8: Dashboard Carrefour
Source: The design is done by the authors.
Debts are an important aspect in the company’s analysis, as they have been growing since the last quarter of 2016. Thus, the debt/equity ratio has had a significantly higher value in recent years, indicating that much of Carrefour’s financing comes from bank loans. Observing these indicators, one can say that the company is subject to a rather high risk, and it has a low capacity to pay its outstanding debts.
In the case of returns, in recent years, the company has used its capital inefficiently. On the other hand, it has had losses caused by certain investments, meaning that in the future, the following investments should be analyzed in detail for a low degree of risk.
The current report recently suggests that the Carrefour group does not have enough assets to pay its current debts, and unable to meet its obligations without selling inventory. One cause of the low current ratio would be too many loans obtained to buy a competing chain of stores.
Gross margin has a declining trend since 2017, although it does not deviate much from the average of recent years. The average value of the gross margin is 23, meaning that for every euro generated from sales, Carrefour generated 23 eurocents in the gross profit before other expenses, which is not a high value. Also, the company’s problems between 2016 and 2018 were reflected in the net profit margin, suggesting a reduced ability to generate profit from sales.
Regarding the overall performance of Carrefour, it reached the lower threshold between 2017 and 2018, as a result of the uninspired decisions of the company, reflected in the case of all financial indicators. The gradual increase in debt has led to financial instability, and the inefficient use of all available resources has severely reduced profitability. In addition, there was a major impact on the net result, which was negative for two consecutive years.
Although in 2019, the indicators suggest an improvement in the financial situation, a careful analysis of all investments and a plan to avoid loans are necessary. In order to increase profits, it would be advisable to exploit potential regions by gradually opening new stores. The region that could negatively influence the results is France, and for this reason, a strategy for financial stabilization is indicated by closing stores that have low sales and offering competitive prices.
After the large losses in 2017 and 2018, Carrefour is on an upward slope due to the “Carrefour 2022” project aimed at improving the business by reducing costs and investing in technology. However, the level of performance cannot be maintained on this upward trend if equity and investments are not used effectively, which is something to keep in mind. On the other hand, the increase in sales and the increase in the net income are directly linked to meeting market requirements and openness to online commerce, which are among the main objectives of Carrefour’s new strategic plan. Thus, the chances of paying off debts and generating profit are high.
Conclusions
Performance analysis is one of the main concerns of a company’s management, because only by analyzing the activity and identifying problems in the processes, profit can be maximized. Thus, it is necessary to select the most appropriate methods according to the company’s objectives.
Another important concept for the company is customer relationship management (CRM), facilitating communication between the company and consumers and helping to increase efficiency by automating certain sales processes.
The main tools for information management and analysis of the indicators detailed in this paper are: Balanced Scorecard, which aligns the company’s activities with its vision; benchmarking, through which one can identify strengths and weaknesses; the performance pyramid, which focuses on external effectiveness and internal efficiency; and the dashboard, which presents an overview of the company’s results. At the same time, it is necessary to determine trends and predict future market requirements. In this regard, certain methods such as logistic regression and extrapolation are addressed.
An effective analysis of an enterprise starts from key performance indicators (KPIs), which are the basis for decision-making. They aim to align with the objectives and take over the best strategies and practices.
The present research has, as a practical object of study, the analysis of the KPIs of Carrefour and the follow-up of the evolution from the financial point of view between 2012 and 2019. Thus, a strong relationship can be noticed between certain indicators which were later grouped as follows: revenues, net sales and gross profit in a first cluster, debt and EBITDA in a second cluster, and ROI, ROE and net income in a third cluster, evolving in the same direction.
Analyzing, with the help of Excel, the indicators of Carrefour company, this study identified certain problems starting from the last quarter of 2016 until the end of 2018, registering a net negative result in two consecutive years. In 2017, the losses caused by the investment made at the end of 2016 were a result of the purchase of a competing chain of stores in France, leading to a sharp decrease in the profitability and the net profit margin.
Although Carrefour encountered some difficulties and a high degree of risk generated by inefficient investments and excessive bank lending, the strategic plan “Carrefour 2022” launched in 2018 generated positive results and a visible upward slope due to reduced spending and investment in technology. In 2019, the company managed to reach a satisfactory level of competitiveness in key regions and to save more and more. Thus, it can be said that through the implementation of this project, the levels of efficiency, effectiveness and, implicitly, the performance have increased.
The evolution of the main key performance indicators of Carrefour was captured in a Dashboard, through which they can be monitored yearly.
In future research, the authors of this paper want to apply the viable system model developed by the father of managerial cybernetics, Stafford Beer, to make a diagnosis of Carrefour with the aim of investigating the functioning of the organization and its management. This qualitative method helps to identify the basic deficiencies that can lead to poor performance.
Aguinis, H. (2013). Performance Management, 3rd edition. Pearson;
Ajitabh, A., Momaya. K. (2003). Competitiveness of Firms: Review of Theory, Frameworks and Models. Singapore Management Review.
Ankam, V. (2016). Big Data Analytics. Birmingham: Packt Publishing;
Bhatti M., Awan, H., Razaq. Z., (2014). The key performance indicators (KPIs) and their impact on overall organizational performance. Quality & Quantity;
Bianchi, C. (2016). Dynamic Performance Management. Springer;
Cheng, J.-H., Lu, K.-L. (2018). The Impact of Big Data Analytics Use on Supply Chain Performance — Efficiency and Adaptability as Mediators. Computer Science;
Chirita N., Nica I. (2019). Cibernetica Firmei. Aplicatii si Studii de Caz. Economică Publishing;
Dimon, R. (2013). Enterprise Performance Management Done Right. John Wiley & Sons;
Eckerson, W. (2005). Performance Dashboards Measuring, Monitoring, and Managing Your Business. John Wiley & Sons;
Hugos, M. (2011). ESSENTIALS of Supply Chain Management. Third ed. John Wiley & Sons;
Nica, I., Ionescu, S. (2020). Business process modeling. Using Unified Modeling Language to streamline the design of the TO-BE system within a company. Theoretical and Applied Economics, no.4/2020 (625), Winter;
Nica, I. (2020). An approach to the index of economic freedom using the data mining technique in the economic environment context. Theoretical and Applied Economics, no.2/2020 (623), Summer;
Paladino, B. (2013). Corporate Performance Management Best Practices. John Wiley & Sons;
Price, C., Jorgensen, A., Knight, D. (2013). Building performance dashboards and balanced scorecards with sql server reporting services. Wiley;
Rashid, C. (2018). Efficiency of Financial Ratios Analysis for Evaluating Companies’ Liquidity. International Journal of Social Sciences & Educational Studies;
Scarlat, E., Chirita, N. (2019). Cibernetica Sistemelor Economice. 3rd Edition. Economică Publishing;
Taticchi, P., (2010). Business Performance Measurement and Management. Springer;
Velimirovic, D., (2011). Role and importance of key performance indicators measurement. Serbian Journal of Management;
Williams, D., (2014). Connected CRM Implementing a data-driven, customer-centric business strategy. Wiley;
Nica, I; Chiriță, N., Ionescu, Ș., (2021). Using of KPIs and Dashboard in the analysis of Nike company’s performance management. Theoretical and Applied Economics, vol. 0(1(626), S), pages 61-84, Spring.