3Electrical and Information Engineering Department, Covenant University, Ota, Nigeria
Volume (2015),
Article ID 238409,
Journal of Software and Systems Development,
15 pages,
DOI: 10.5171/2015.238409
Received date: 1 October 2014; Accepted date: 28 December 2014; Published date: 17 September 2015
Academic Editor: Meysam Namayandeh
Cite this Article as:
Okeniyi Joshua Olusegun, Okeniyi Elizabeth Toyin and Atayero Aderemi.A (2015), " Programming Development of Kolmogorov-Smirnov Goodness-of-Fit Testing of Data Normality as a Microsoft Excel® Library Function ", Journal of Software & Systems Development, Vol. 2015 (2015), Article ID 238409, DOI: 10.5171/2015.238409
This paper deliberates on the programming development of the Kolmogorov-Smirnov goodness-of-fit testing of data Normality as a library function in the Microsoft Excel® spreadsheet software, in which researchers normally store data for analysis and processing. The algorithmic program procedure utilised developed implementation of the Normality Kolmogorov-Smirnov D statistics for the one-sided and the two-sided test criteria as a library function in the Microsoft Excel® environment. For these programming developments, the Visual Basic for Applications® was employed for deploying macro embedment in the spreadsheet software. Successful programming development of the Normality K-S D statistics fosters implementation of the Normality K-S p-value estimation procedure also as a library function in the Microsoft Excel® environment. Test-applications of these programming developments in the study portray potency of accurate, speedy and economical procedure for testing compatibility of univariate data of real numbers to the Normal distribution, for datasets of n ≤ 2000 sample size.
Keywords: Normality testing; Kolmogorov-Smirnov statistics; machine precision arithmetic; Microsoft Excel® library function
Introduction
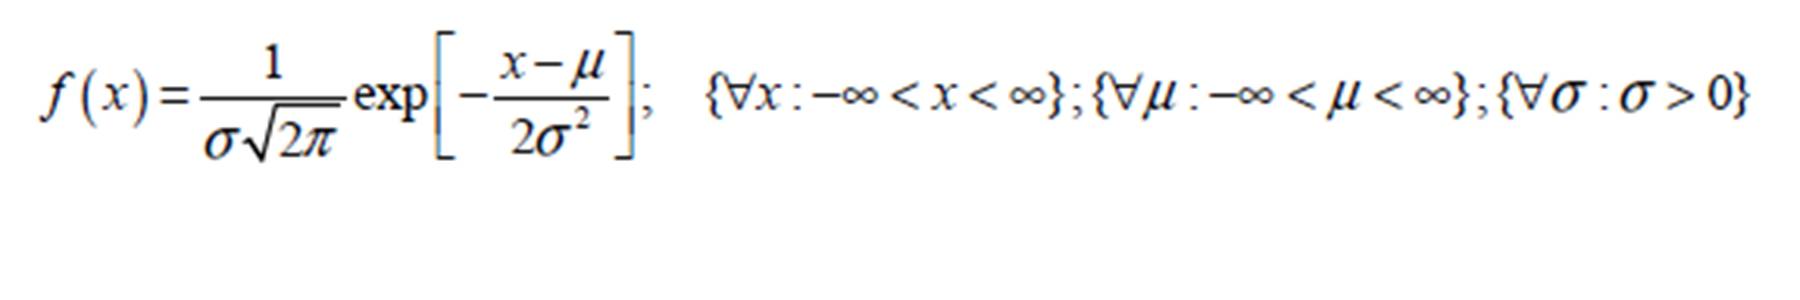
The Normal Probability Distribution Function (pdf) is a well known statistical tool for describing and/or representing data obtained from samples or from population of interests in many disciplines of research including humanity, business, science and engineering (Okeniyi et al, 2015a; Okeniyi et al, 2013; Omotosho et al, 2012; Banholzer et al, 2006; Ho, 2006; Evans et al, 2000; Bury, 1999). This symmetrical, bell-shaped, continuous statistical distribution could be identified with sample space extending from minus infinity to plus infinity even as it is a standard to which other distributions are compared (Bury, 1999). The mathematical expression of the Normal probability density function is given by (Okeniyi et al, 2015b; Okeniyi et al, 2013; Iwueze, 2007; Krishnamoorthy, 2006; Soong, 2004; Montgomery and Runger, 2003; Lipson and Sheth, 1973)
:(1)
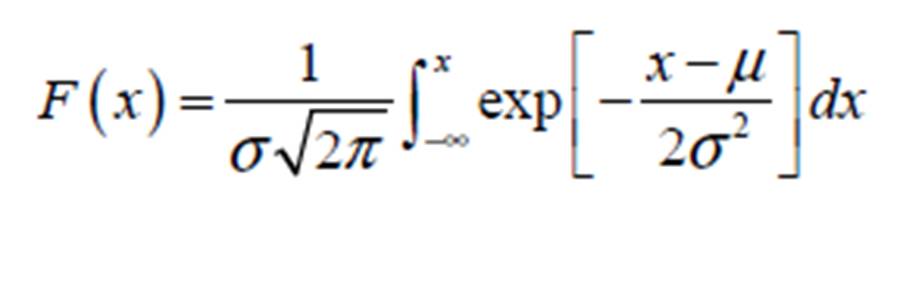
Where: x ≡ given univariate random variable; µ ≡ the location parameter of the Normal pdf; and ≡ the scale parameter of the Normal pdf. Thus, Equation (1) is commonly depicted, in literature (Okeniyi and Okeniyi, 2012; Krishnamoorthy, 2006; Shao, 2003; Bilodeau and Brenner, 1999; Bury, 1999), especially for datasets that come from the Normal distribution function, using the shorthand form N(µ, σ2). Also, the Cumulative Distribution Function (cdf) of the Normal pdf is given by (Okeniyi et al, 2013; Iwueze, 2007; Krishnamoorthy, 2006; Soong, 2004; Montgomery and Runger, 2003, Lipson and Sheth, 1973): (2)
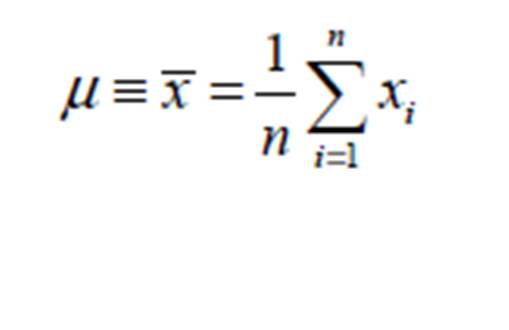
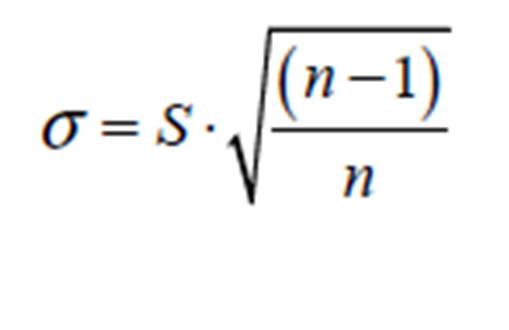
The Normal pdf finds usefulness in data modelling due to the easy applications of its maximum likelihood estimations of location and scale parameters as the respective measure of central tendency and measure of variability of the dataset of random sample or population (Krishnamoorthy, 2006; Bury, 1999; Lipson and Sheth, 1973). For instance, unlike many other Probability Distribution Functions, the maximum likelihood estimates of the location and of the scale parameters of the Normal Probability Distribution Function are well known and are easily obtained, respectively, from (Okeniyi et al, 2015b; Krishnamoorthy, 2006; Bury, 1999):
(3)
(4)
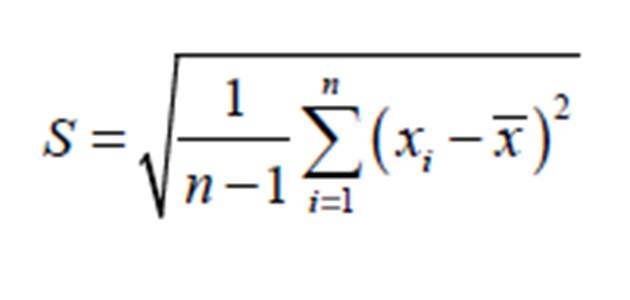
The term S from Equation (4) could be obtained from:(5)
Where is the sample mean, n is the number of data in the given dataset of the univariate random variable x and S is the sample standard deviation of the random variable x.
The ease of computation of the parameters of the Normal distribution and most probably the direct application of the parameters for drawing requisite conclusions concerning the random sample have led to the Normal pdf being the most applied among the statistical distributions. However, according to ASTM G16—95 R04 (2005), the indiscreet application of the Normal pdf modelling to data that distributed in other manner bear potency of grossly erroneous conclusions in the interpretation of prevalent condition represented by the scatter of the data. Avoiding this, therefore, makes it a fundamental requirement of theoretical and empirical research that the researchers test the Normality of the scatter of their data, i.e. ascertain that the data come from or distributed like the Normal Probability Distribution Function. For instance, Ho (2006) identified tests ascertaining Normality of data as preconditions for employing t-test, factorial analysis of variance and factor analysis among other types of statistical analyses of data. In that text, the use of non-parametric tests like the Mann—Whitney U, Kruskal—Wallis, Wilcoxon Signed Ranks tests were recommended only for data violating the Normality condition.
However, testing the Normality of data is not as simple as the estimation of the location and scale parameters of the Normal distribution. Normality testing requires non-parametric procedures that could be esoteric and which are known as the goodness-of-fit (GoF) testing. Among many methods that had been studied in literature, the Kolmogorov-Smirnov GoF had been proffered as the test of choice by researchers for studying continuous distribution, of which the Normal pdf is a widely used example (Breton et al, 2008; Yazici and Yolacan, 2007). In addition, the Kolmogorov-Smirnov GoF statistics is supported by many studies for small sample size (Breton et al, 2008; Yazici and Yolacan, 2007; DeCoursey, 2003) which makes it suitable for engineering data where availability of large sample size may be prohibitive for economical reasons. However, the use of Kolmogorov-Smirnov goodness-of-fit testing, for ascertaining whether set of data comes from or is distributed like a particular distribution or not, requires analytical procedures that could be cumbersome for non-statisticians or non-mathematicians. Soong (2004) exemplified a procedure for a one-sided goodness-of-fit test that culminated in the use of tables in the text before the Normality criteria of the dataset could eventually be decided. Such methods for large sample sizes, e.g. n = 1500, could culminate in drudgery that could dissuade Normality testing, human errors and consequent erroneous interpretation of the scatter of such data. Although commercial or freeware software packages exist for testing Normality, e.g. STATIGRAPHICS, MATLAB, etc, these softwares have to be acquired, installed (taking additional hard disk/memory space) and have to be invoked for each dataset of test-data groupings. Such applications to each dataset of test-data groupings are time intensive even as consequent copying of the test-results to the spreadsheet environment, normally employed for the dataset storage, could still lead to drudgery and human errors when many datasets are involved. These are apart from the requirement that the usage of the procedure for employing those commercial or freeware software packages has to be learnt which could culminate in training cost and/or the distraction ensuing from the time that had to be spent on the training.
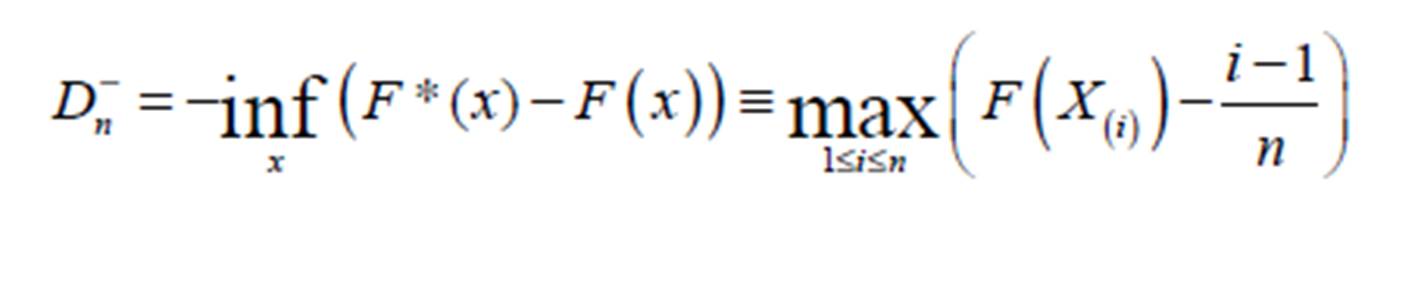
According to Drucker (2006), a critical principle of innovative culture demanded that an innovation has to be simple for it to be effective. Despite the fact that some authors from the present study have implemented Kolmogorov-Smirnov (K-S) goodness-of-fit (GoF) test as a Microsoft Excel® library function with requisite examples and software availability in report submitted elsewhere (Okeniyi and Okeniyi, 2012), the usage of that algorithmic software development remains limited. That implementation necessarily requires the estimation of the Kolmogorov-Smirnov D statistics given by (Okeniyi et al, 2015b; Okeniyi et al, 2013; Okeniyi and Okeniyi, 2012; Omotosho et al, 2012; Kutoyants, 2011; Weber et al, 2006; Gibbons and Chakraborti, 2003): (6)
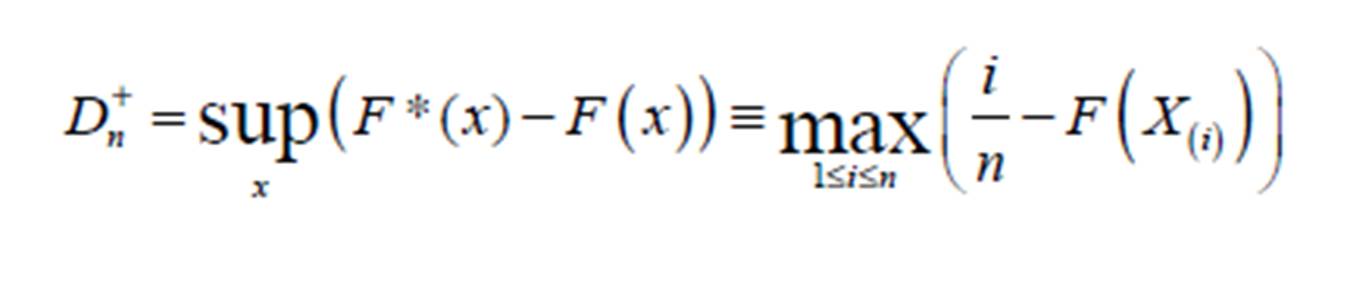
Which is the one-sided test that F*(x) is smaller compared to F(x), for sample size n. Also, the one-sided test that F*(x) is larger compared to F(x) needs to be obtained from (7)
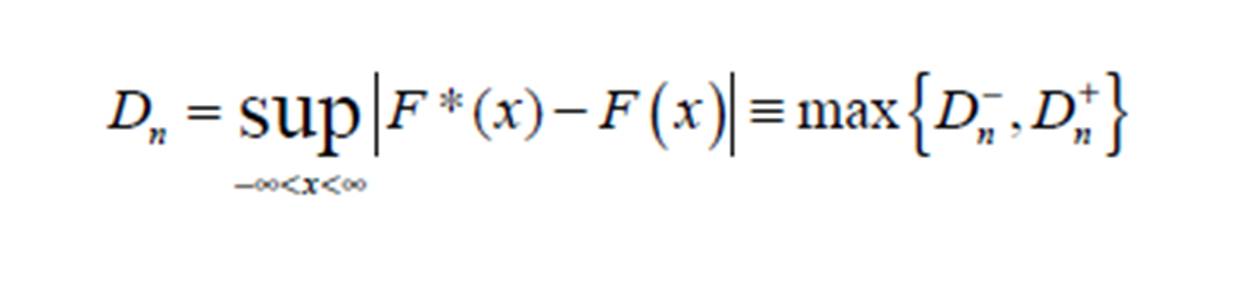
While the two-sided test which measures maximum absolute distance requires the estimation of the statistics (8)
In that paper, Okeniyi and Okeniyi (2012) described the procedure for accurately evaluating Kolmogorov-Smirnov p-values as a Microsoft Excel® (Ms Excel®) library function using machine precision, based on IEEE 64-bit (8-byte) floating-point, arithmetic. This finds embedment as a macro (Simon, 2002), implemented in Visual Basic for Applications®, which could be invoked from the Microsoft Excel® environment, i.e. a common spreadsheet environment where research data are normally stored, processed and analysed.
It is importantly notable that the library functions exist in Ms Excel® for the maximum likelihood estimations of the Normal distribution parameters, i.e. Equation (3), Equation (4) and, as may be required, Equation (5). These exist respectively as:
“=AVERAGE(Number arguments corresponding to sample/population)”
“=STDEVP(Number arguments corresponding to population)”
“=STDEV(Number arguments corresponding to sample)”
Also, Equation (1) and Equation (2) could be estimated in Ms Excel® through the usage of requisitely invoked condition in the library function given by:
NORMDIST(x,µ,σ,pdf or cdf condition)
In spite of these, however, there is no function in the highly important data storage, data processing and data analysing spreadsheet software for estimating the Kolmogorov-Smirnov statistics, i.e. Equation (6), Equation (7) and Equation (8). The existence of such library function, especially based on the cumulative density function of the Normal distribution would have assisted the use of the procedures described in Okeniyi and Okeniyi (2012) for highly simplified and quicker tests of Normality of sample data. Also, availability of such Normality test function in the Ms Excel® spreadsheet environment is potent with the additional advantage of time-saving applicability of such function to many groups of datasets by the “Formula” copying/pasting facility of the Ms Excel® package. This is potent at facilitating the focus of researchers on the interpretation of their data with the added advantage of saving cost and time that could have been expended on purchasing and/or learning to use additional software in the stead of the cumbersome use of tables for Normality testing. Therefore, this study deliberates on the implementation of data Normality test by the Kolmogorov-Smirnov goodness-of-fit statistics in the environment of Visual Basic for Applications® (VBA®) that could be invoked as a library function within the Microsoft Excel® software. Program Implementation Methods
Algorithm for K-S D
The algorithmic procedure employed for implementing the K-S statistics in this study include modification of the descriptions itemised for the one-sided D+ estimation by Soong (2004). By this, the algorithmic procedure employed for the VBA® program implementation include:
– Capturing dataset of univariate data, x, from the Microsoft Excel® spreadsheet environment;
– Re-arrangement of captured data into an ordered statistics of univariate data, x(i);
– Evaluating the maximum likelihood estimates of the location parameter, µ, and the scale parameter, σ, of the captured data;
– Determination of the observed Normal Cumulative Distribution Function, F*(x(i)), at the instances of each x(i) as required for D— or D+ and/or for Dn;
– Determination of the theoretical Normal Cumulative Distribution Function, F(x(i)), at the instances of each x(i) from the ordered statistics of univariate data;
– Evaluation of D— as per Equation (6) or D+ as per Equation (7) and/or Dn as per Equation (8);
– Displaying the Normal K-S D result in the Microsoft Excel® spreadsheet environment.
Implementing K-S D in VBA®
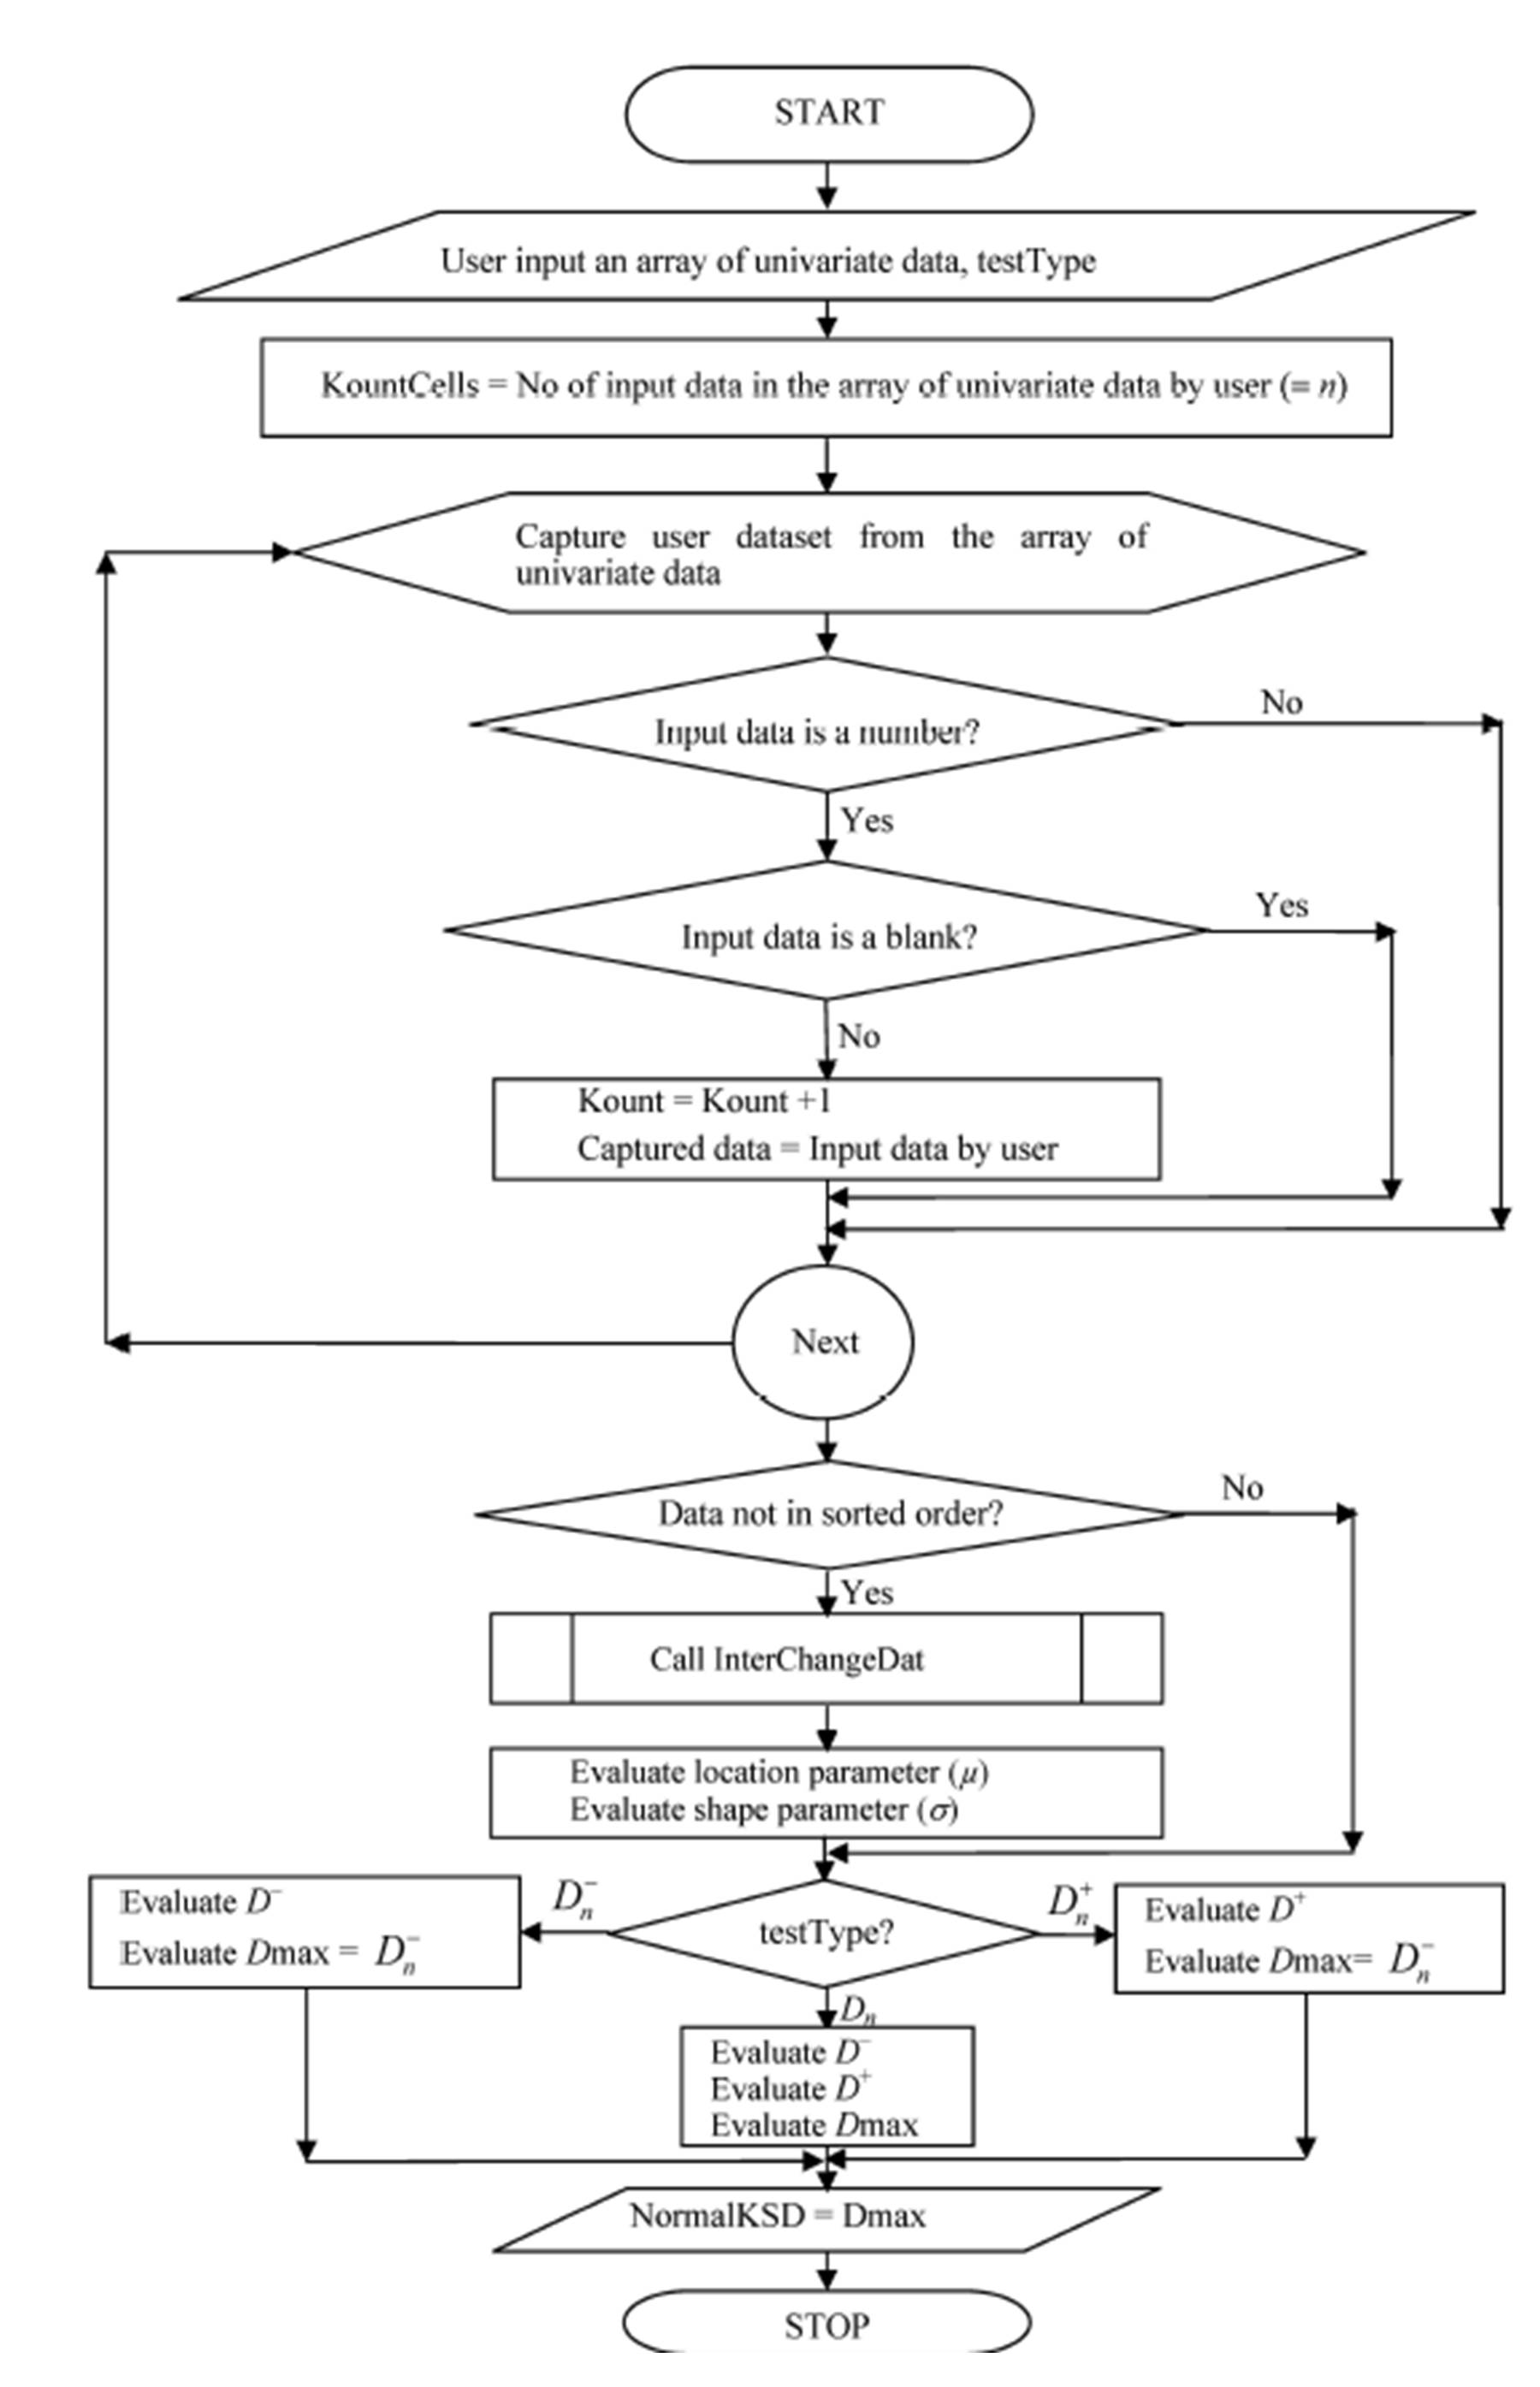
Implementation of K-S D statistics in VBA® followed the flow chart in Fig 1. For a library function deployment, the data to be captured depend on the input of the user which is expected to be an array of univariate data, hereby tagged “DatArray”. For this, the number of input data specified by the user was queried in this implementation through use of the “Application” object in conjunction with the “WorksheetFunction” property and the “Count” method by:
This finds usefulness for re-arranging the input data by the user through requisitely assigned variable for storing the input data in the VBA® program implementation, tagged “DatStor”. The re-arrangement procedure was implemented by the “bubble sorting” code (Gottfried, 2001) that invoked a data interchanging modular program “InterChangDat” in the form:
For i = 1 To KountCells – 1
For k = i + 1 To KountCells
If DatStor(i) > DatStor(k) Then
Call InterChangeDat (DatStor(i), DatStor(k))
End If
Next k
Next i
Maximum likelihood estimate of the location parameter, the mean (μ), and the scale parameter, the standard deviation (S) of the dataset, were evaluated by the respective VBA® statements that employed the “Average” and the “Stdev” methods of Ms Excel®, as appropriate, in the form of:
The maximum absolute distance was obtained through an interchange program code implementation given, for D+ (i.e. Dplus) as an instance, by:
DMax = Dplus(1)
For i = 2 To KountCells
If DMax < Dplus(i) Then
Temp = DMax
DMax = Dplus(i)
Dplus(i) = Temp
End If
Next i
The “Dmax” obtained from this constitutes the K-S D, for this instance D+, that could be employed for evaluating K-S p-value from the procedure reported by Okeniyi and Okeniyi (2012).
Mimicking Ms Excel® function with array argument operand
It is of interest to mimic or imitate Ms Excel® function having array operand as argument. Examples of these include the “Sum” function and the “Average” function. These functions find capability at ignoring Ms Excel® columns containing blanks and/or non-numeric values, while input data for these functions could also span many columns. Based on this, recognition and exclusion of non-numeric part of the input array was implemented through the conditional statement:
If Not IsNumeric (DatArray.Cells(i, j).Value) Then kountIt = kountIt – 1
While the exclusion of the blank segment was effected through use of “ElseIf” program segment in the form of: ElseIf DatArray.Cells(i, j).Value “” Then DatStor(kountIt) = DatArray.Cells(i, j).Value
The Kolmogorov-Smirnov D library function for the Normal distribution
The foregoing was implemented as macro function of the Visual Basic for Applications® (VBA®) of Microsoft Excel® through the declaration:
Public Function NormalKSD(DatArray As Variant, testType As Integer)
Where “DatArray”, as it should be recalled, was conceived as the argument to capture user input of univariate data that could be optionally multi-column but single area or single arrayed. The argument “testType” could assume any of three forms: testType = 0, for K-S D— evaluation; testType = 1 for K-S D+ evaluation; and testType = 2 for K-S Dn evaluation. The function returns value of “Dmax” through the program coding:
NormalKSD = DMax
By these, the function “NormalKSD” could be invoked right from within Microsoft Excel® spreadsheet environment, in similitude to invoking an existing library function, by:
=NormalKSD(DatArray, testType)
Application of “NormalKSD” implementation for Normality K-S p-value
Ultimately, motivation for computing K-S D statistics was for estimating the K-S p-value on which the decision of normality would be based as per identified confidence interval/level of significance (Okeniyi and Okeniyi, 2012, Soong, 2004). Due to this, the implementation of the “NormalKSD” from this study was applied for directly estimating Kolmogorov-Smirnov p-value, for Normality testing of data, from dataset in the Microsoft Excel® spreadsheet environment. This finds proposition as a library function that could be invoked as:
=NormalKSP(ArrayDat, ksdType)
Results and Discussion of implemented program testing
The NormalKSD program implementation was applied from within Microsoft Excel® version 2007 spreadsheet environment. This was running on Hp Pavilion dv6 Notebook PC with Intel® Core™ i3 CPU M330 @ 2.13GHz, 2133MHz, 2 Core(s), 4 Logical Processor(s) and which employed Microsoft® Windows® 7 Home Premium as the operating system. The data used for this test-application were the same data employed by Soong (2004) for exemplifying computations of K-S D+ (tagged d2) by statistical tables and graphical methods.
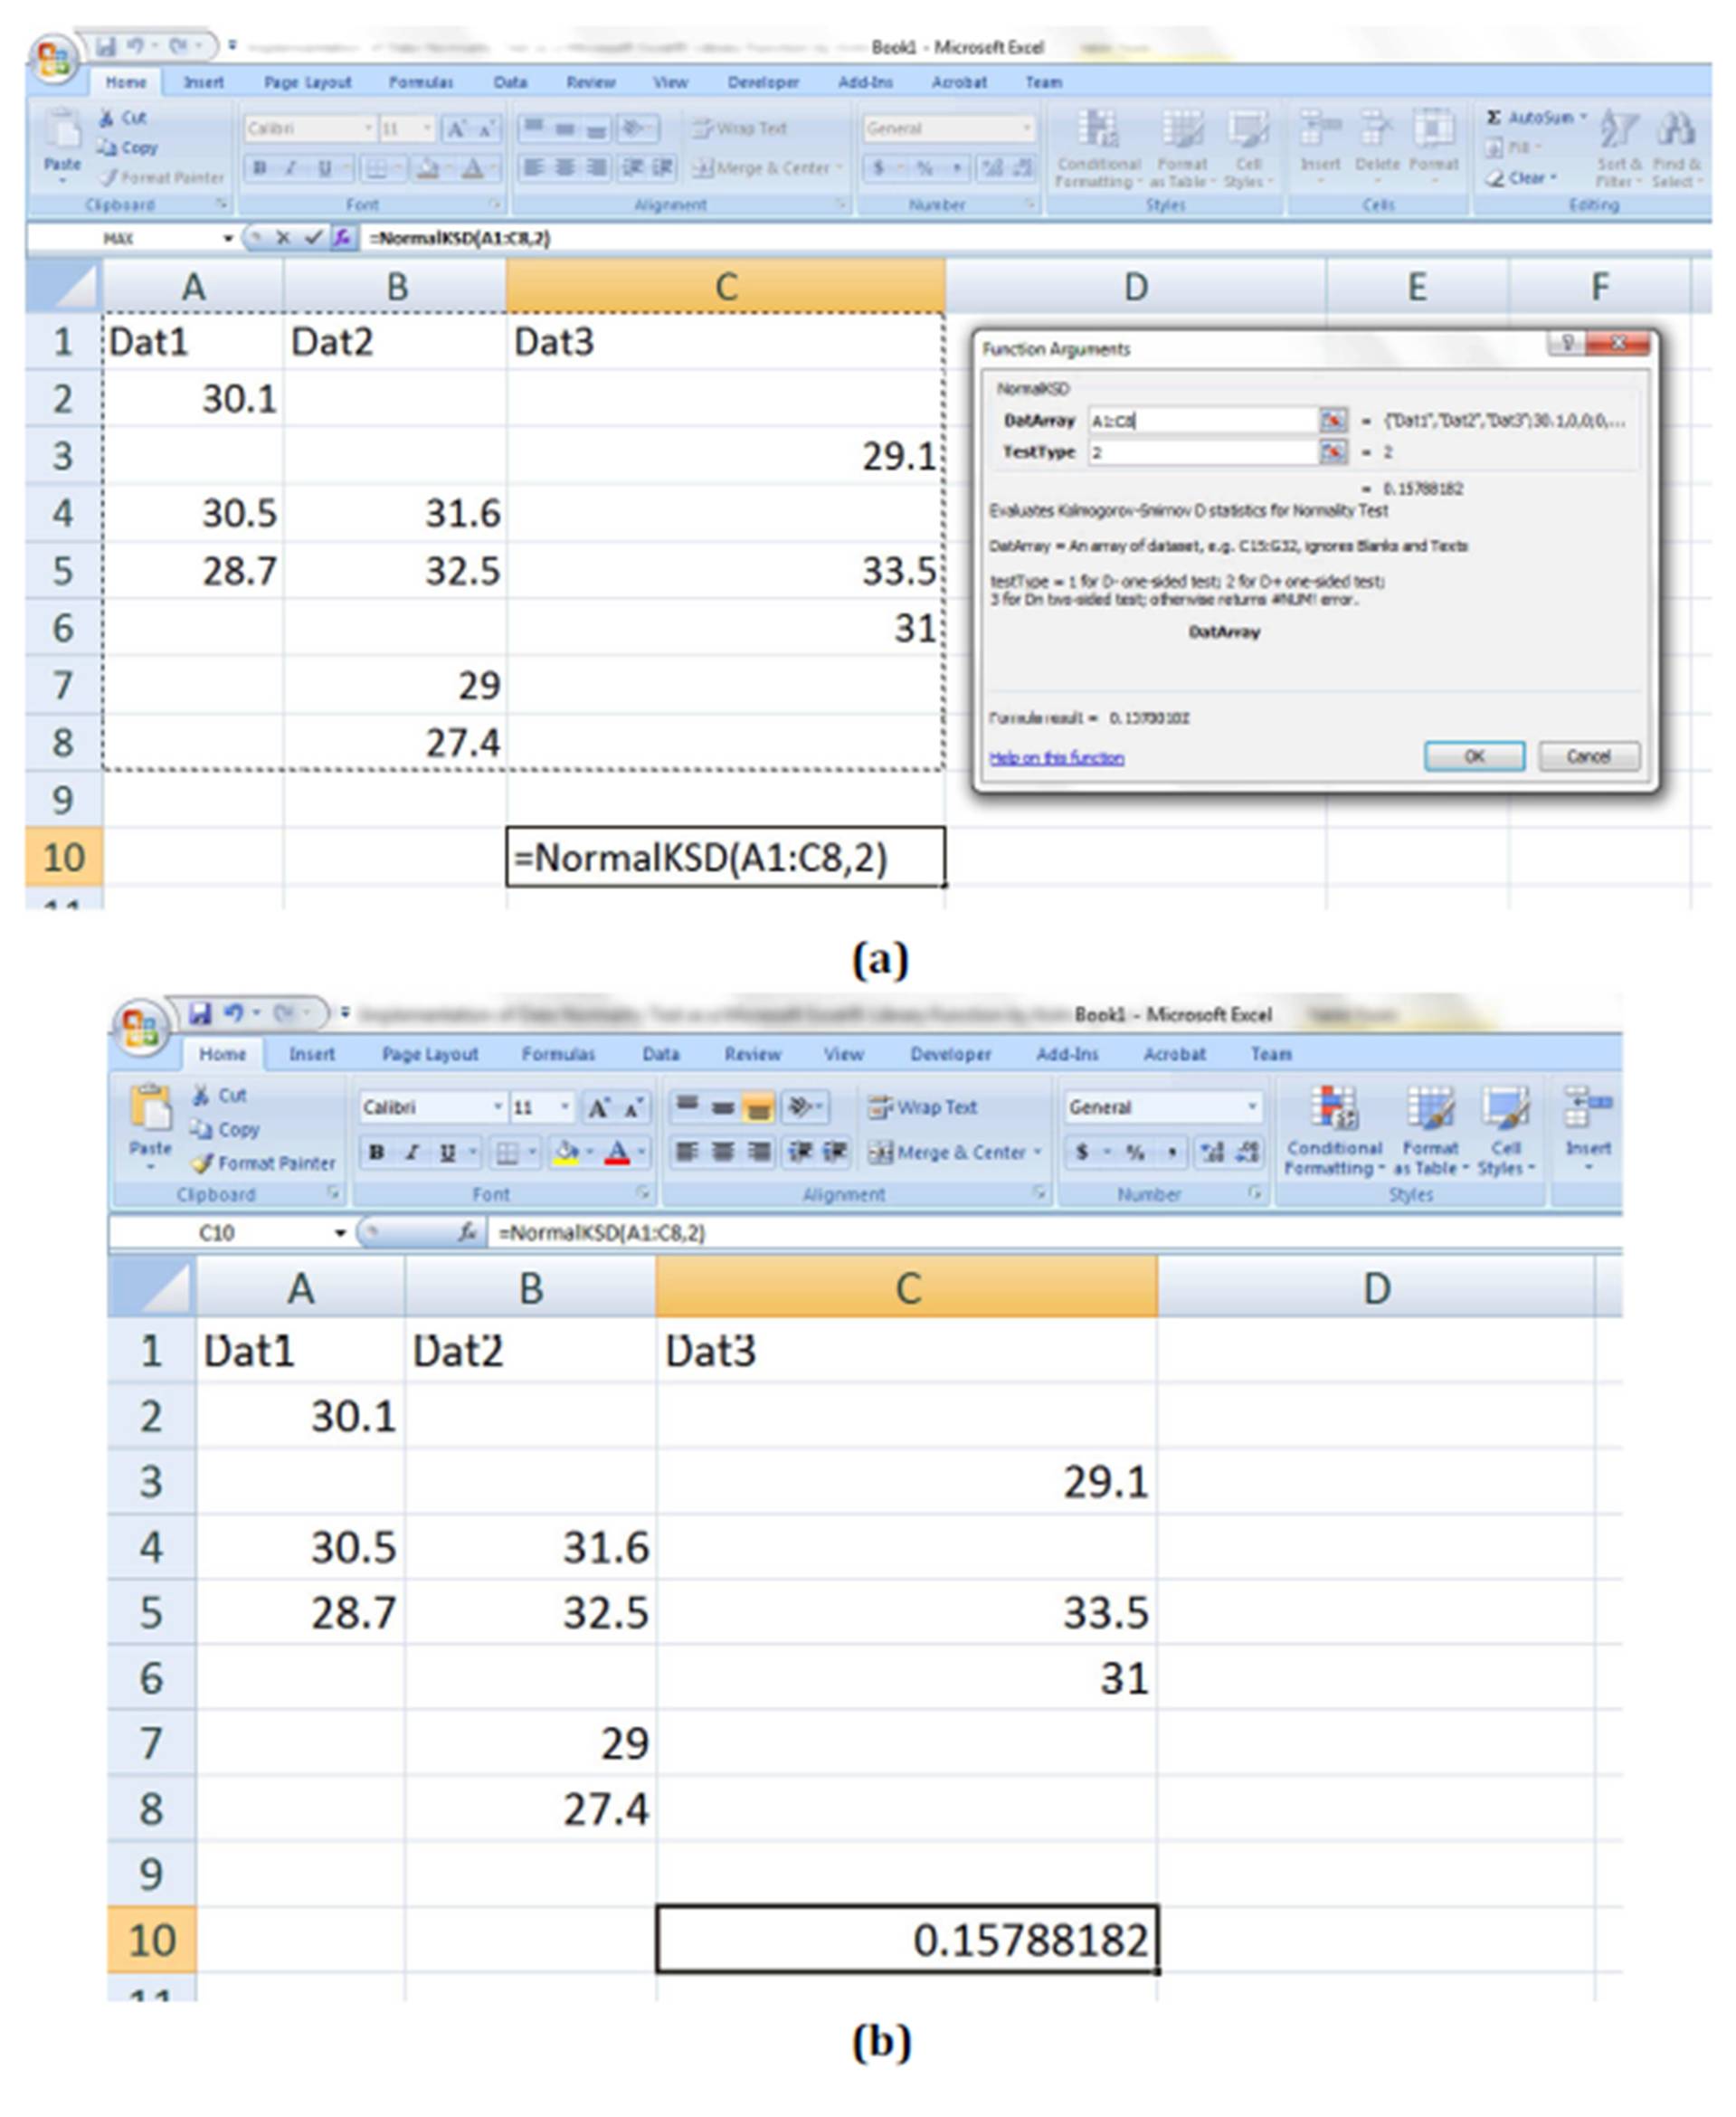
The direct computation of K-S D+ of this dataset using the “NormalKSD” library function proposed in this study was as shown in Fig 2. In that figure, the data were scattered for exemplifying multicolumn dataset, ignoring of cells with text(s) and blank(s) cells without data by the implemented library function, Fig 2(a). The result of the “NormalKSD” on the Ms Excel® was shown in Fig 2(b) as = 0.15788182 correct to 8 decimal places (8 d.p.). This result represents more accurate estimations compared to d2 = 0.1517 that was obtained from Soong (2004). This disparity of the result obtained from this work and that from Soong (2004) is due to the fact that the computations in Soong (2004) would have exhibited cumulative error due to the 4 d.p. of values obtained from the tables employed in that text.
Figure 2: Evaluating Normality K-S D+ (i.e. d2) in Ms Excel® using the data from Soong 2004 in a multicolumn scattered form (a) selecting the array of multicolumn dataset with texts and blanks (b) evaluated Normality K-S D+ by the implemented “NormalKSD” library function
Figure 3: showed the direct computation of K-S p-value in the Ms Excel® environment from the multicolumn dataset using the implemented “NormalKSP” library function. This direct computation gave the result of the Normality K-S p-value = 0.55271852 (correct to 8 d.p.).
Figure 3 Evaluating Normality K-S p-value in Ms Excel® using the data from Soong (2004) in a multicolumn scattered form (a) selecting the array of multicolumn dataset with texts and blanks (b) evaluated Normality K-S p-value by the implemented “NormalKSP” library function
This result is > 0.05 significant level of α. By this, conclusion bearing agreement with that from Soong (2004) on this same set of data, include the direct deduction that it could not be rejected that the dataset distributed like or come from the Normal Probability Distribution Function.
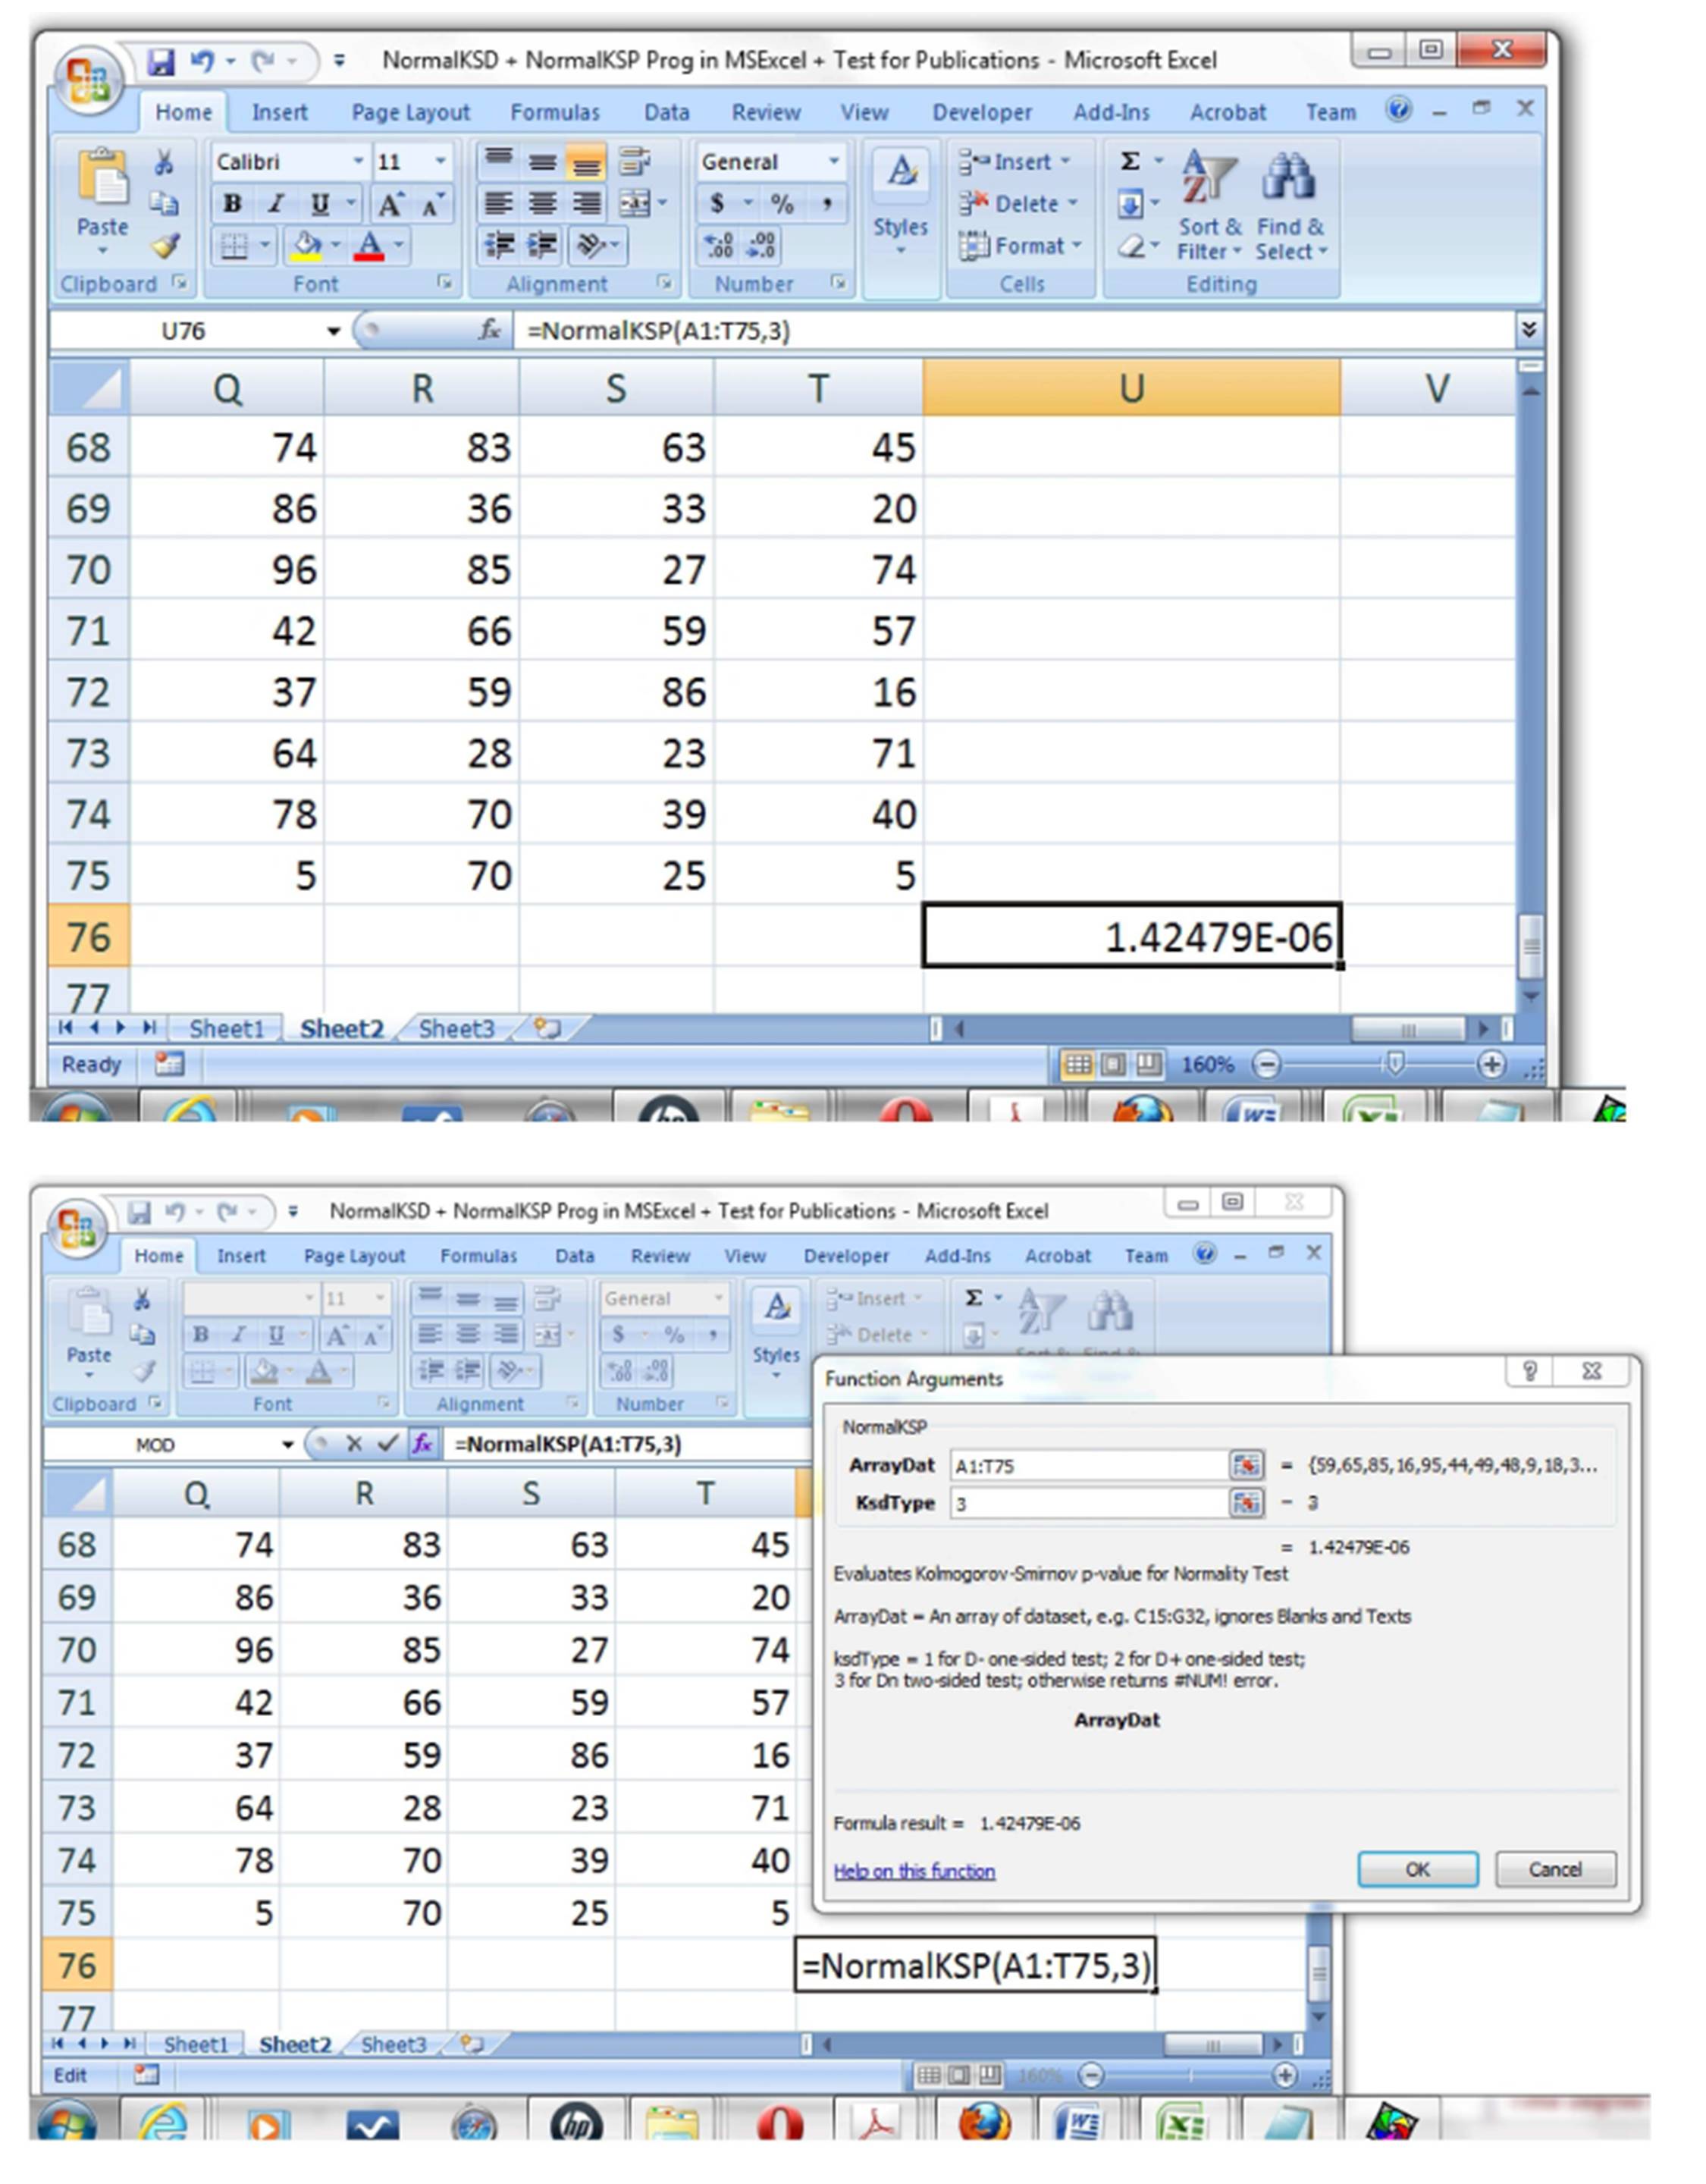
However, benefit of this implemented library function could be better perceived through the application of the method for quickly ascertaining Normality of the 20 columns Χ 75 rows = 1500 random data between 1 and 99, obtained by “RandBetween(1,99)” Ms Excel® library function. Fig 4(a) showed the “NormalKSP” application to this dataset, at “A1:T75” of the Excel sheet, while the result was as shown in Fig 4(b) as Normality K-S p-value = 1.42479Χ106. This is < 0.05 such that it could be quickly deduced that the scatter of the data did not distribute like or come from the Normal Probability Distribution Function.
This quick approach at ascertaining Normality of dataset makes the novel implementation of the “NormalKSD” statistics and the subsequent “NormalKSP” constitute improvement over the methods described in Okeniyi and Okeniyi for evaluating Normality K-S p-value. For instance, the procedure for Normality K-S p-value estimations described in Okeniyi and Okeniyi (2012) requires the number of univariate data, “n”, computation of K-S D statistics, “d”, and the sidedness of the K-S GoF test, “num_sided” as function arguments. By the implementation in this study, the rigorous estimation of Normality K-S D statistics is avoided with the added advantage of accurate K-S p-value estimation for facilitating faster decision of Kolmogorov-Smirnov goodness-of-fit criteria. Also, that the method from Okeniyi and Okeniyi (2012) on which the estimation of the Normality K-S p-value was based could be applied to the dataset of up to n ≤ 2000 data constitute further advantage of modelling comparably large univariate data.
Figure 4: Application of the “NormalKSP” library function for quickly ascertaining Normality of n = 20 ï‚´ 72  1500 data (a) selecting the array of 20 columns and 75 rows (b) evaluated Normality K-S p-value for the large univariate data
By the application of the implemented Microsoft Excel® library function described in this study, researchers can therefore focus on the Normality testing of their data from within the Microsoft Excel® spreadsheet environment where their research data are normally stored. The novel implementation of Normality testing function in Microsoft Excel® being proposed from this study requires no additional training other than the well-known method of invoking library function within the Microsoft Excel® spreadsheet environment.
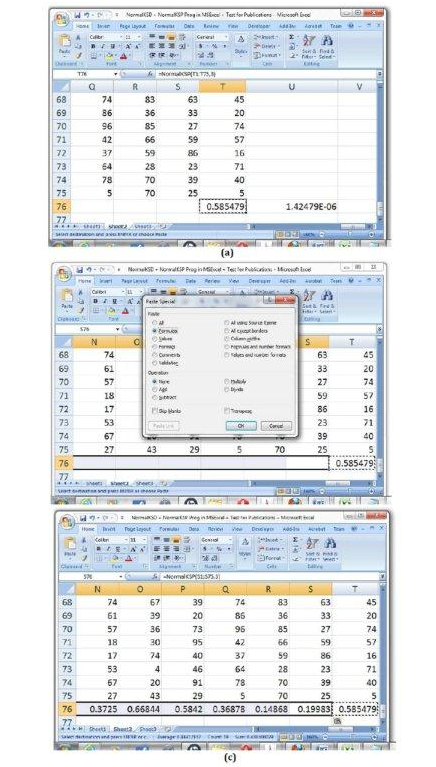
That this implemented Normality testing function would constitute inclusion in the library function of Microsoft Excel® fosters the additional advantages that it could be copied and pasted as “Formula” for other groups of dataset sharing the same number of samples. This copying and pasting advantage is exemplified in Fig 5 for the datasets spanning 20 columns employed in Fig 4. By the section of the K-S p-value test-results shown in Fig 5(c), the time-saving conclusion can be deduced that each of the datasets in columns N, O, P, Q, R, S and T in the Microsoft Excel® spreadsheet shown distributed like or come from the Normal distribution. For each of these datasets, K-S p-value is greater than 0.05. That this Normality testing could be done for 20 columns implied it could be executed for up to the n ≤ 2000 columns of Microsoft Excel® for datasets arranged either along the columns or along the rows of Microsoft Excel®. Any of these columns or rows applications constitute tremendous time-saving and economical Normality testing computations compared to the single dataset per time facility available in known software packages that could also be used for data Normality testing.
Figure 5: Application of the “NormalKSP” library function to many groups of dataset with the same sample size using the copy/paste facility of Ms Excel® (a) copying a cell of “NormalKSP” application (b) using the “paste special” + “Formula” facility of Ms Excel® after selection of the other cells (c) Test-results of K-S p-values pasted for the other 19 datasets (please note “Count: 19” on the Excel status bar) of univariate data.
Conclusion
Implementation of Data Normality test as a Microsoft Excel® library function by the Kolmogorov-Smirnov goodness-fit-statistics had been described in this study. From this, the following conclusion can be drawn:
– Implementation of the Normality K-S D statistics through the proposed “NormalKSD” library function in Microsoft Excel® facilitates time-saving and economical estimation of the absolute maximum difference, Dn ≡ Dmax, for K-S GoF statistics;
– The “NormalKSD” implementation fosters the “NormalKSP” library function deployment that facilitates quick estimation of Normality K-S p-value for univariate data from within the Microsoft Excel spreadsheet environment;
– By the Normality K-S p-value implementation in this study, the rigorous evaluations of K-S D statistics can even be avoided, thus, facilitating time-saving and economical decision, by the Kolmogorov-Smirnov goodness-of-fit test-criteria, of the Normality of univariate datasets of real numbers up to n ≤ 2000 samples in all fields of research endeavour.
References
1.ASTM G16-95 R04 2005. Standard guide for applying statistics to analysis of corrosion data. ASTM International, West Conshohocken, PA.
20. Okeniyi, JO., Loto, CA. and Popopla, API. 2015b. Electrochemical performance of Anthocleista djalonensis on steel-reinforcement corrosion in concrete immersed in saline/marine simulating-environment. Transactions of the Indian Institute of Metals, doi:10.1007/s12666-014-0424-5.
21. Omotosho, OA., Okeniyi, JO., Ajayi, OO. and Loto, CA. 2012. Effect of synergies of K2Cr2O7, K2CrO4, NaNO2 and aniline inhibitors on the corrosion potential response of steel reinforced concrete in saline medium. International Journal of Environmental Sciences, 2 (4), 2346—2359.
22. Shao, J. 2003. Mathematical statistics, 2nd Edition, Springer Science+Business Media, LLC, New York.
23. Simon, J. 2002. Excel Programming: Your visual blueprint for creating interactive spreadsheets, Hungry Minds, Inc., New York.
24. Soong, TT. 2004. Fundamentals of Probability and Statistics for Engineers, John Wiley & Sons, Ltd, Chichester. Google Scholar