Brno University of Technology, Faculty of Business and Management, Department of Informatics Kolejní, Brno, Czech Republic
Volume (2016),
Article ID 675401,
Journal of Software and Systems Development,
12 pages,
DOI: 10.5171/2016.675401
Received date: 22 October 2014; Accepted date: 19 January 2015; Published date: 4 October 2016
Cite this Article as:
Petr Dydowicz (2016), " Creation and Use of Internal Matrix Database Functions in VBA MS Excel Environment for Bulk Data Processing ", Journal of Software & Systems Development, Vol. 2016 (2016), Article ID 675401, DOI: 10.5171/2016.675401
A whole range of organisations use the MS Office package on different levels of their internal structure, either directly or as ITC support. The package includes the MS Excel spreadsheet processor. Excel is mostly used where the deployment of stronger tools such as SQL or other database tools is too work-intensive with regard to the strategic priorities of the company in the ITC area. There are several reasons for this. MS Excel is a rather intuitive and user-friendly tool and a functioning application can be created with its help with nearly zero knowledge and skills in programming by use of MS Excel internal functions and tools. Nevertheless, an internal inquiry performed in the years 2011 – 2014 in companies daily using MS Office has found out that the utilisation of VBA (an environment for the creation of own macros, functions and forms in Visual Basic for Application), integrated across the MS Office package, is nearly zero. This article therefore aims not only at pointing out the current status of bulk data processing in the MS Excel environment, but mainly at underlining (and comparing to the current status) the options with the help of which, using the VBA language, a more effective use of the MS Excel spreadsheet processor can be achieved in the area of bulk data processing, in particular in the creation of matrix functions simulating database functionality. I have used some of the existing internal functionalities of MS Excel for a comparison with my proposal.
Keywords: MS Excel, VBA, database function simulation, matrix functions
Introduction
This contribution discusses the possible ways of using VBA for the creation of user matrix functions in the MS Excel environment. The question is: Why VBA?
VBA is a programming language implemented in the Microsoft Office environment designed for creating simple applications, either at the level of desktop applications (such as forms, Active X control elements), or it can be used to create user-defined functions or simple macros (not requiring programming skills).
This programming language is an intuitive one, and with some exaggeration one may say that it is the „younger brother“ of the Visual Basic development tool of the Microsoft Visual Studio family of development tools. As opposed to commercial programming languages which may be purchased, with various levels of equipment, for relatively high prices, the VBA, as mentioned above, is part of the MS Office package. In short, a high-quality office tool (including a text editor, table processor, presentation tool, datababse tool) and an internal programming tool (VBA), which may be used within these office subsystems, are available for the price of one. The present possibilities of the MS Excel table processor allow perfecting computational methods by creating user-defined functions using the VBA tool. Several categories of internal functions implemented in the MS Excel environment no doubt have an enormous potential regarding their utilization in practice. The question is, however, whether the possibilities of MS Excel, based on the use of internal functions, are good enough to meet the company requirements for bulk data processing outputs. If such ouptputs cannot be obtained by using standard internal functions, the VBA tool can be used to create user-defined functions meeting all the requirements for the expected output format. As mentioned above, the aim of this article is to show how the internal programming VBA tool may be used to create such functions for data processing which are missing from company environment. To achieve this aim, we have used the method of creating user subprograms, i.e. functions which are located in the complement module (Add-In) of the application (XLAM). An example of such a user function, which is described in this article, may be understood as an element of the set of user functions which may be used in any spreadsheet. MS Excel contains a number of functions in the category of internal database functions, which in their own way are able to simulate the query functionality (QUERY) used in database environment. Formulation of the Problem
As indicated above, I am trying to show VBA can be used in the MS Excel table processor with emphasis on the possibility of using simultaneously certain internal functions and methods in the area of bulk data processing — databases, and on the different outputs of such methods. I am proposing to solve this low data extraction capacity, caused by the absence of database functionalities of the internal functions, by designing a user function which simulates the ouputs of standard database functions.
Source: Author
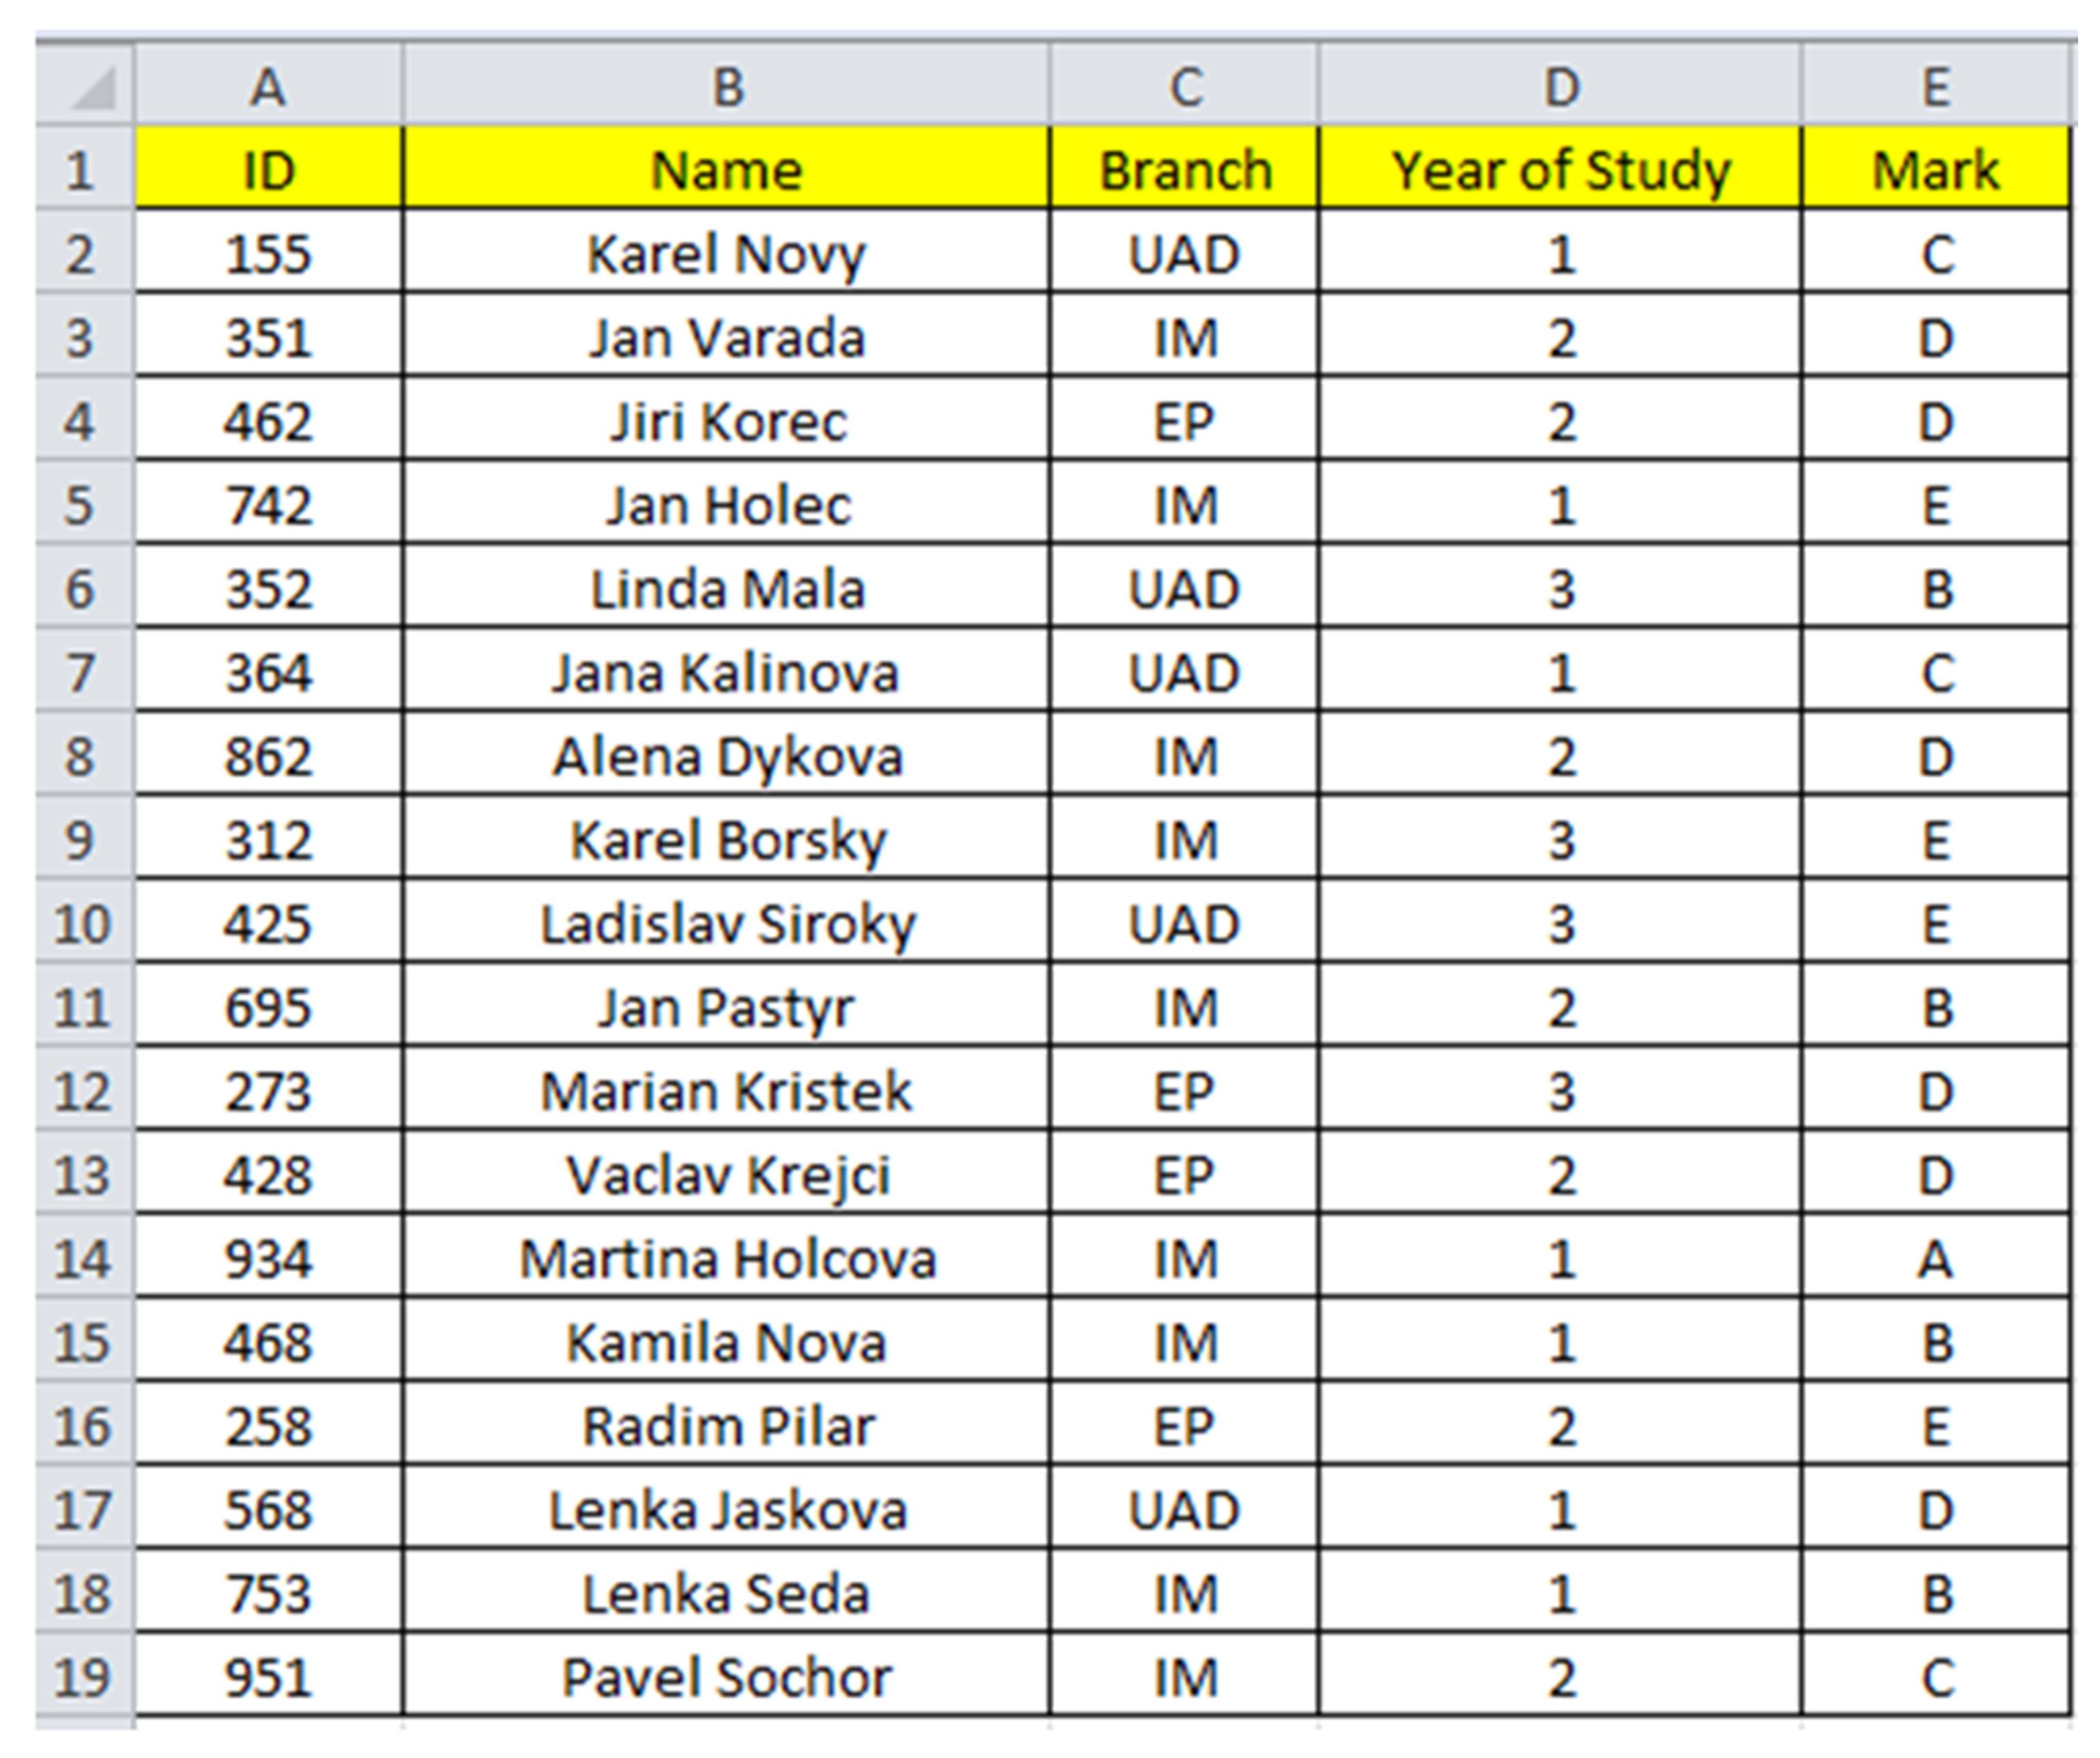
Figure1 :An example of database table in MS Excel environment
The table (in Fig 1) has all the characteristics of a database table with the header in the first line containing array names and each line representing an entry of the database table. The A2:E19 range contains a complete list of students. The first column (A) contains the students´ indentification numbers, the second column (B) the students´ first names and surnames, the third column (C) the branches of study, the fourth column (D) the years of study, and the last column (E) the grades.
Given a simple problem: Extract from this table the set of all second year students whose branch of study is either IM or EP. Possible solutions:
Simple look up functions VLOOKUP, LOOKUP and HLOOKUP
MS Excel features a number of functions which can be used to look up a particular entry meeting a given condition. This condition is usually composed from a simple expression, e.g. by comparing a substring to an array string. By an array we mean in this case a particular column which has a name and contains a set of lines with expressions which are compared to the given substring (defined by the condition) and subsequently evaluated. The filosophy of such a function consists in searching the given array (column) from the first to the last cell to find matches. If a match is found, the function returns an expression, usually the expression of the column defined by one of the function arguments (index or range). The function output
The output of such a function is usually a single expression, precisely because the function is a simple one which is located in a single cell. This function is suitable for the extraction of an entry based on a given unique (unrepeatable) value which is being looked up in the array of values. In the case of the table from Fig. 1, this array is the A column (ID). If we wished to list the set of second year students studying at the branches IM or EP, then these look up functions could not be applied to this purpose. Automatic Filter Method
A second possibility of extracting a set of students according to the given problem consists in using an automatic filter. This operation is more sophisticated than the preceding one, i.e. the use of functions, because the filtering operation returns a whole list created on the basis of the defined conditions. Its disadvantage is that the primary data are usually changed by the filter operation, so that the lines whose column value is being filtered does not correspond to the given condition, are somehow made „invisible“. Another disadvantage of this solution consists in the unsuitable or limited use of certain functions. As mentioned above, only those lines are displayed whose filtered array value corresponds to the given condition. If standard functions, such as SUM, MAX or AVERAGE, are used, then the function does not return the correct value, since the output value of these functions is usually computed from the lines which are hidden based on the filter condition. Thus, the use of functions is somewhat limited and only those functions may be used which take account of the lines which are hidden after the filter condition is evaluated. An example of such a fucntion is the SUBTOTAL function.
Automatic filter output
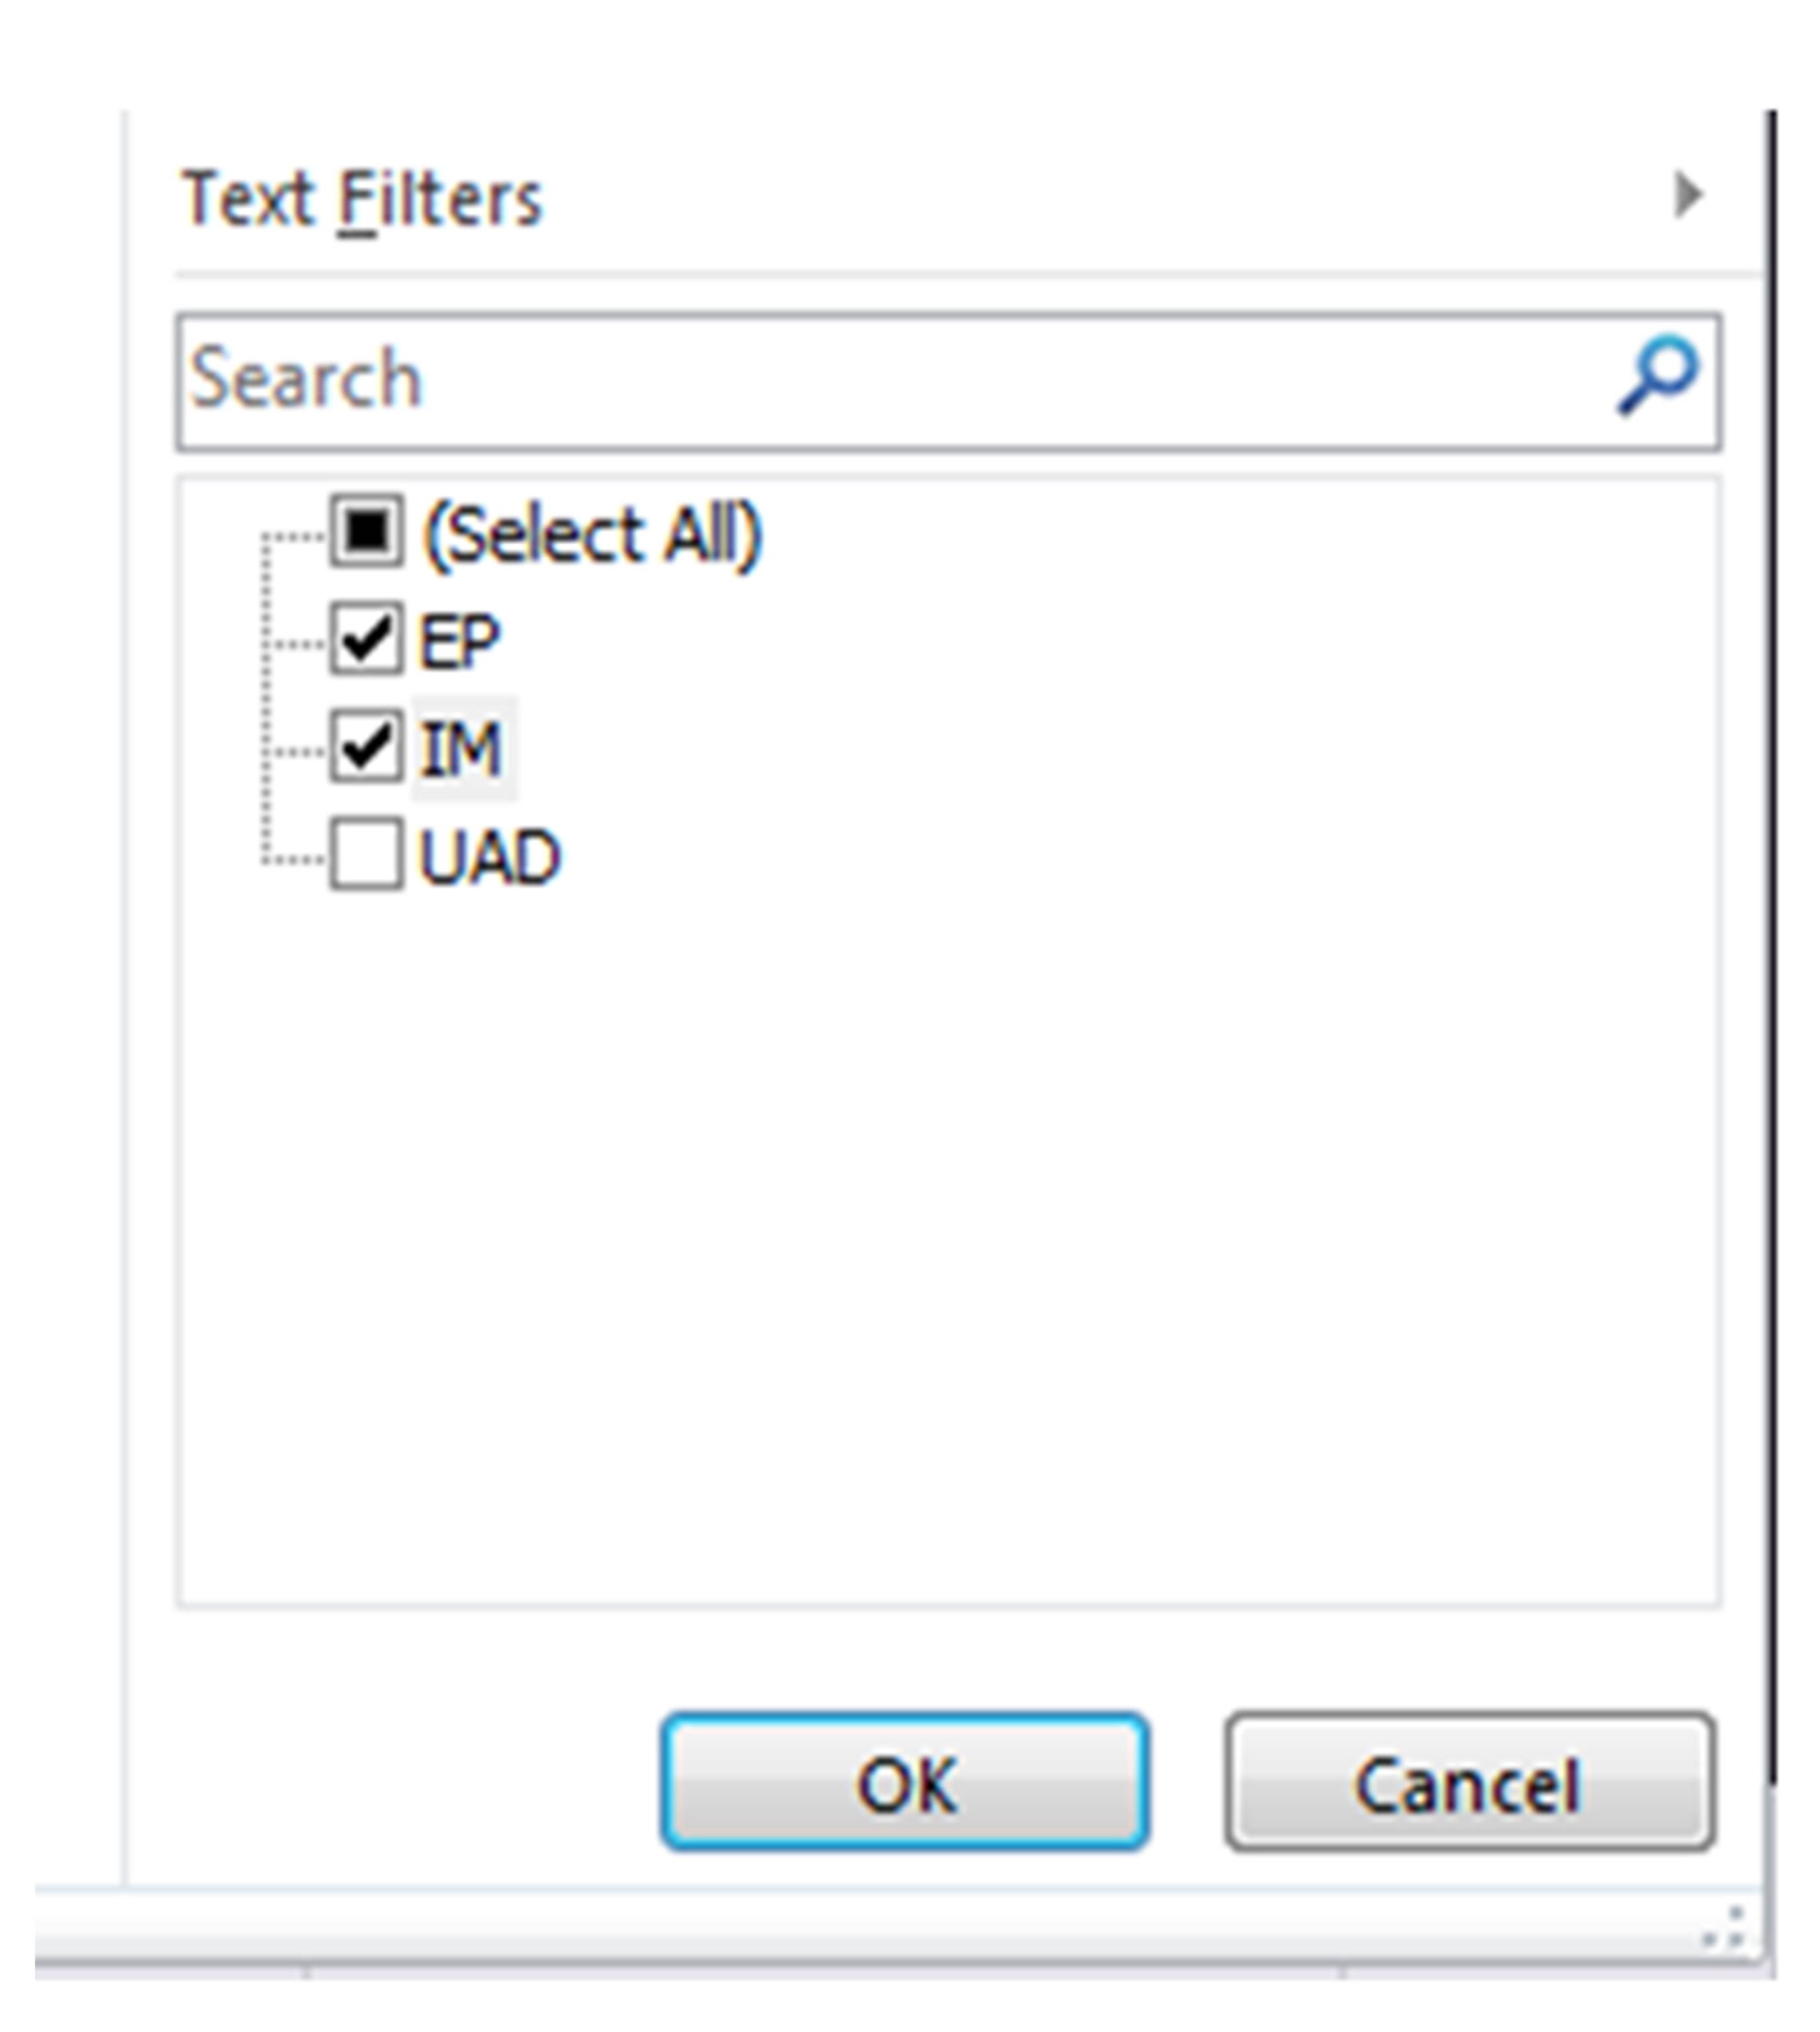
The entire table including the header must be marked and the DATA → FILTER option selected on the card bar. At each entry of the header line the control element is added (combo box) which after opening contains the list of all non duplicite values of the given column. If, according to the given problem, the set of all second year students studying at IM or IP branches is to be filtered out, then the „IM“ and „EP“ entries must be selected for the „Branch“ column /see fig. 2/ and a single „2“ entry for the „Year of Study“ column /see Fig. 3/.
Figure 2: Filter for the „Branch“ column
Figure 3: Filter for the „Year of Study“ column
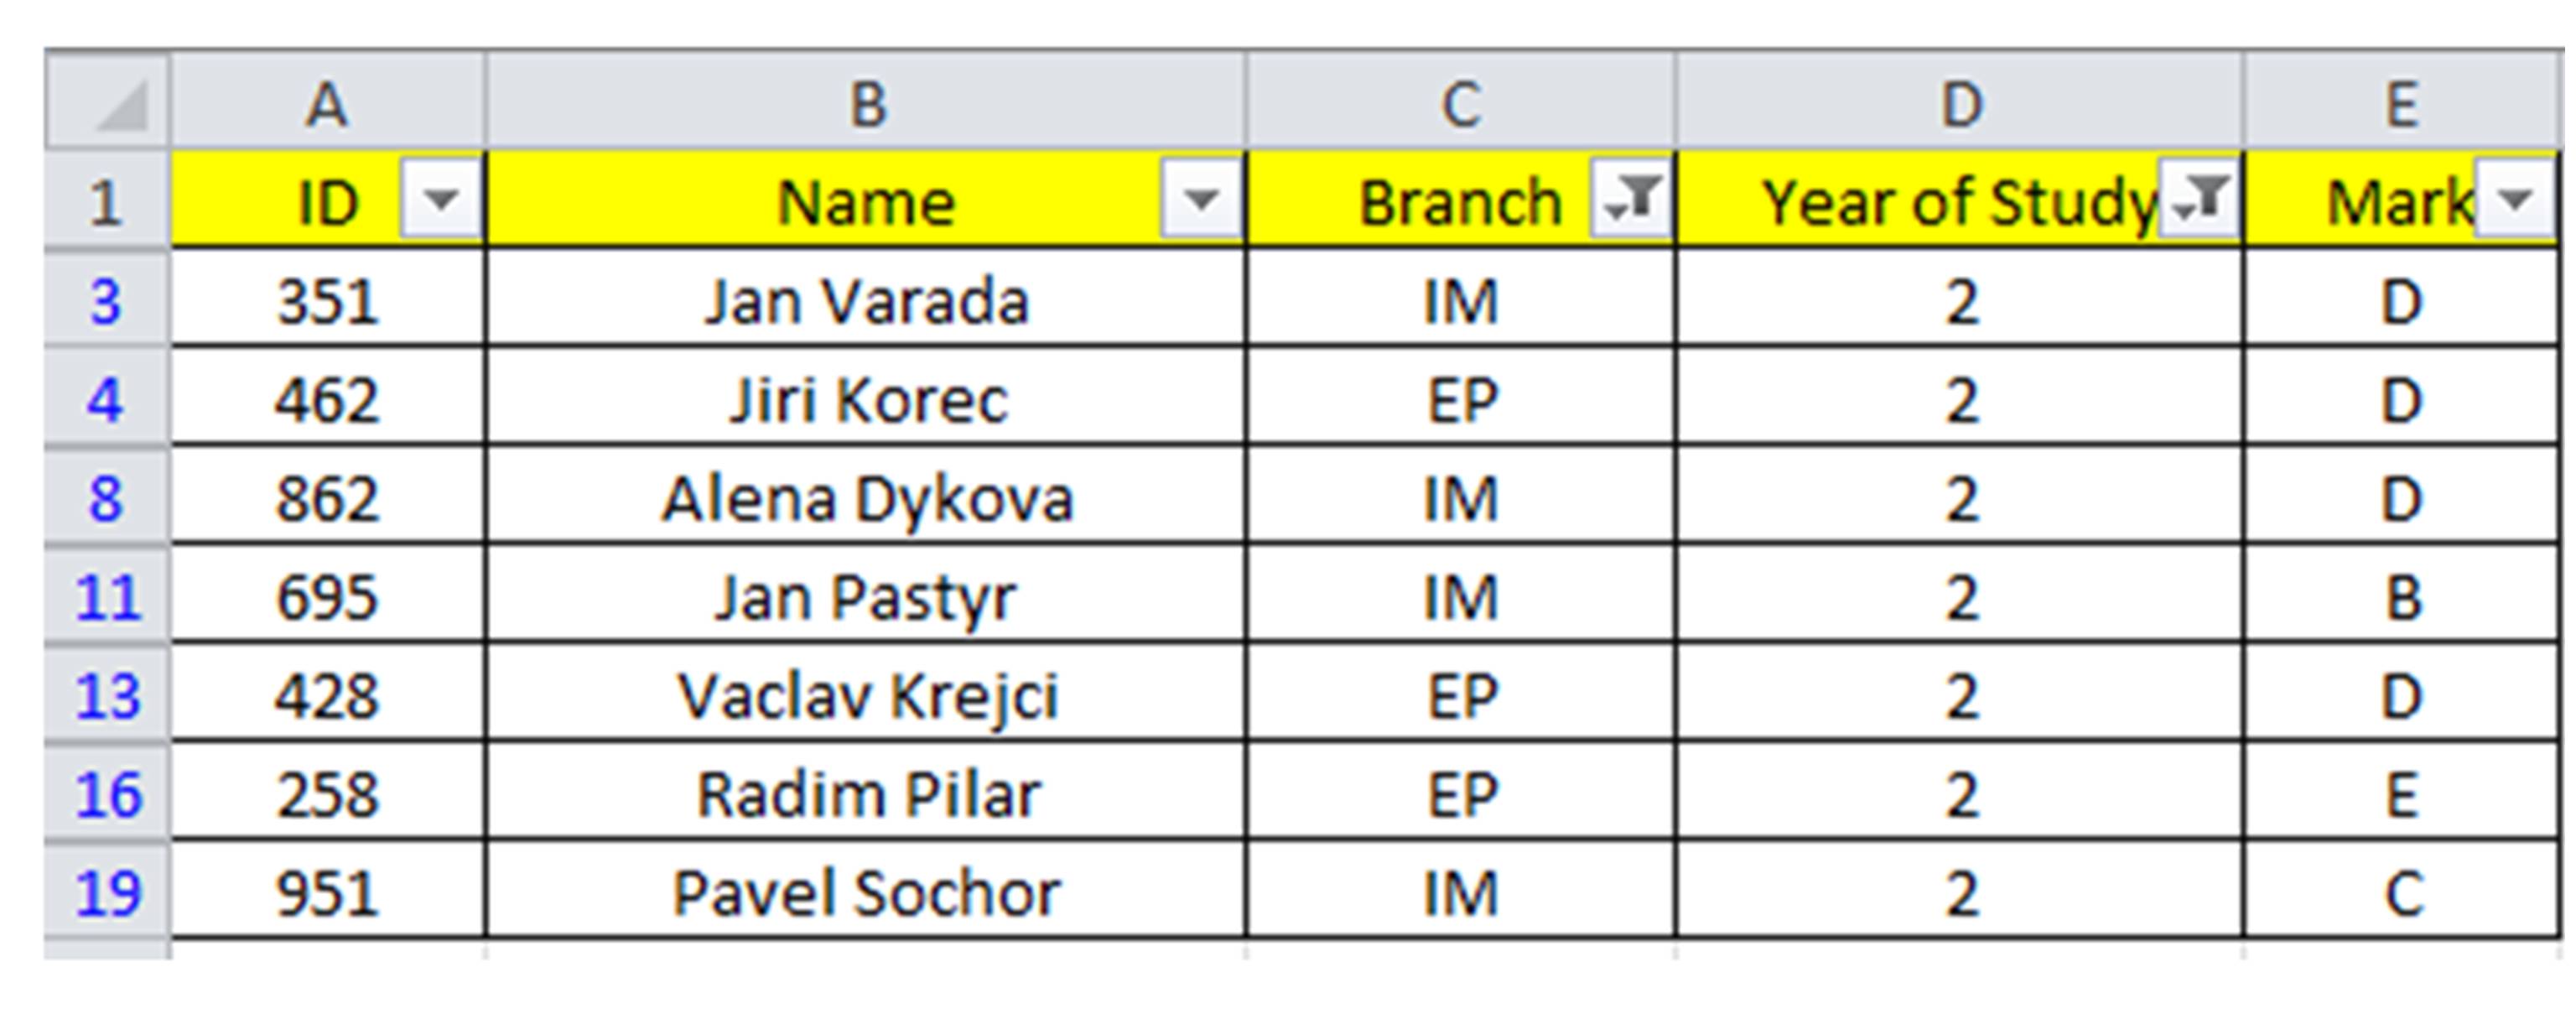
The output of this method is a table containing lines corresponding to the automatic filter definition as follows:
((BRANCH = “IM“) OR (BRANCH = „EP“)) AND (YEAR = 2)
Source: Author
Figure 4: The filtered data (entries)
As mentioned above, one of the disadvantages of this solution is the fact that the lines whose column values entering the filter do not correspond to the filter conditions, are hidden. The fact that the lines are hidden would be no problem in itself, if we did not insist on an „unaltered table“. In addition, only functions which eliminate the hidden lines in their computation (SUBTOTAL) may further be used to process such a filtered table. Advanced Filter Method
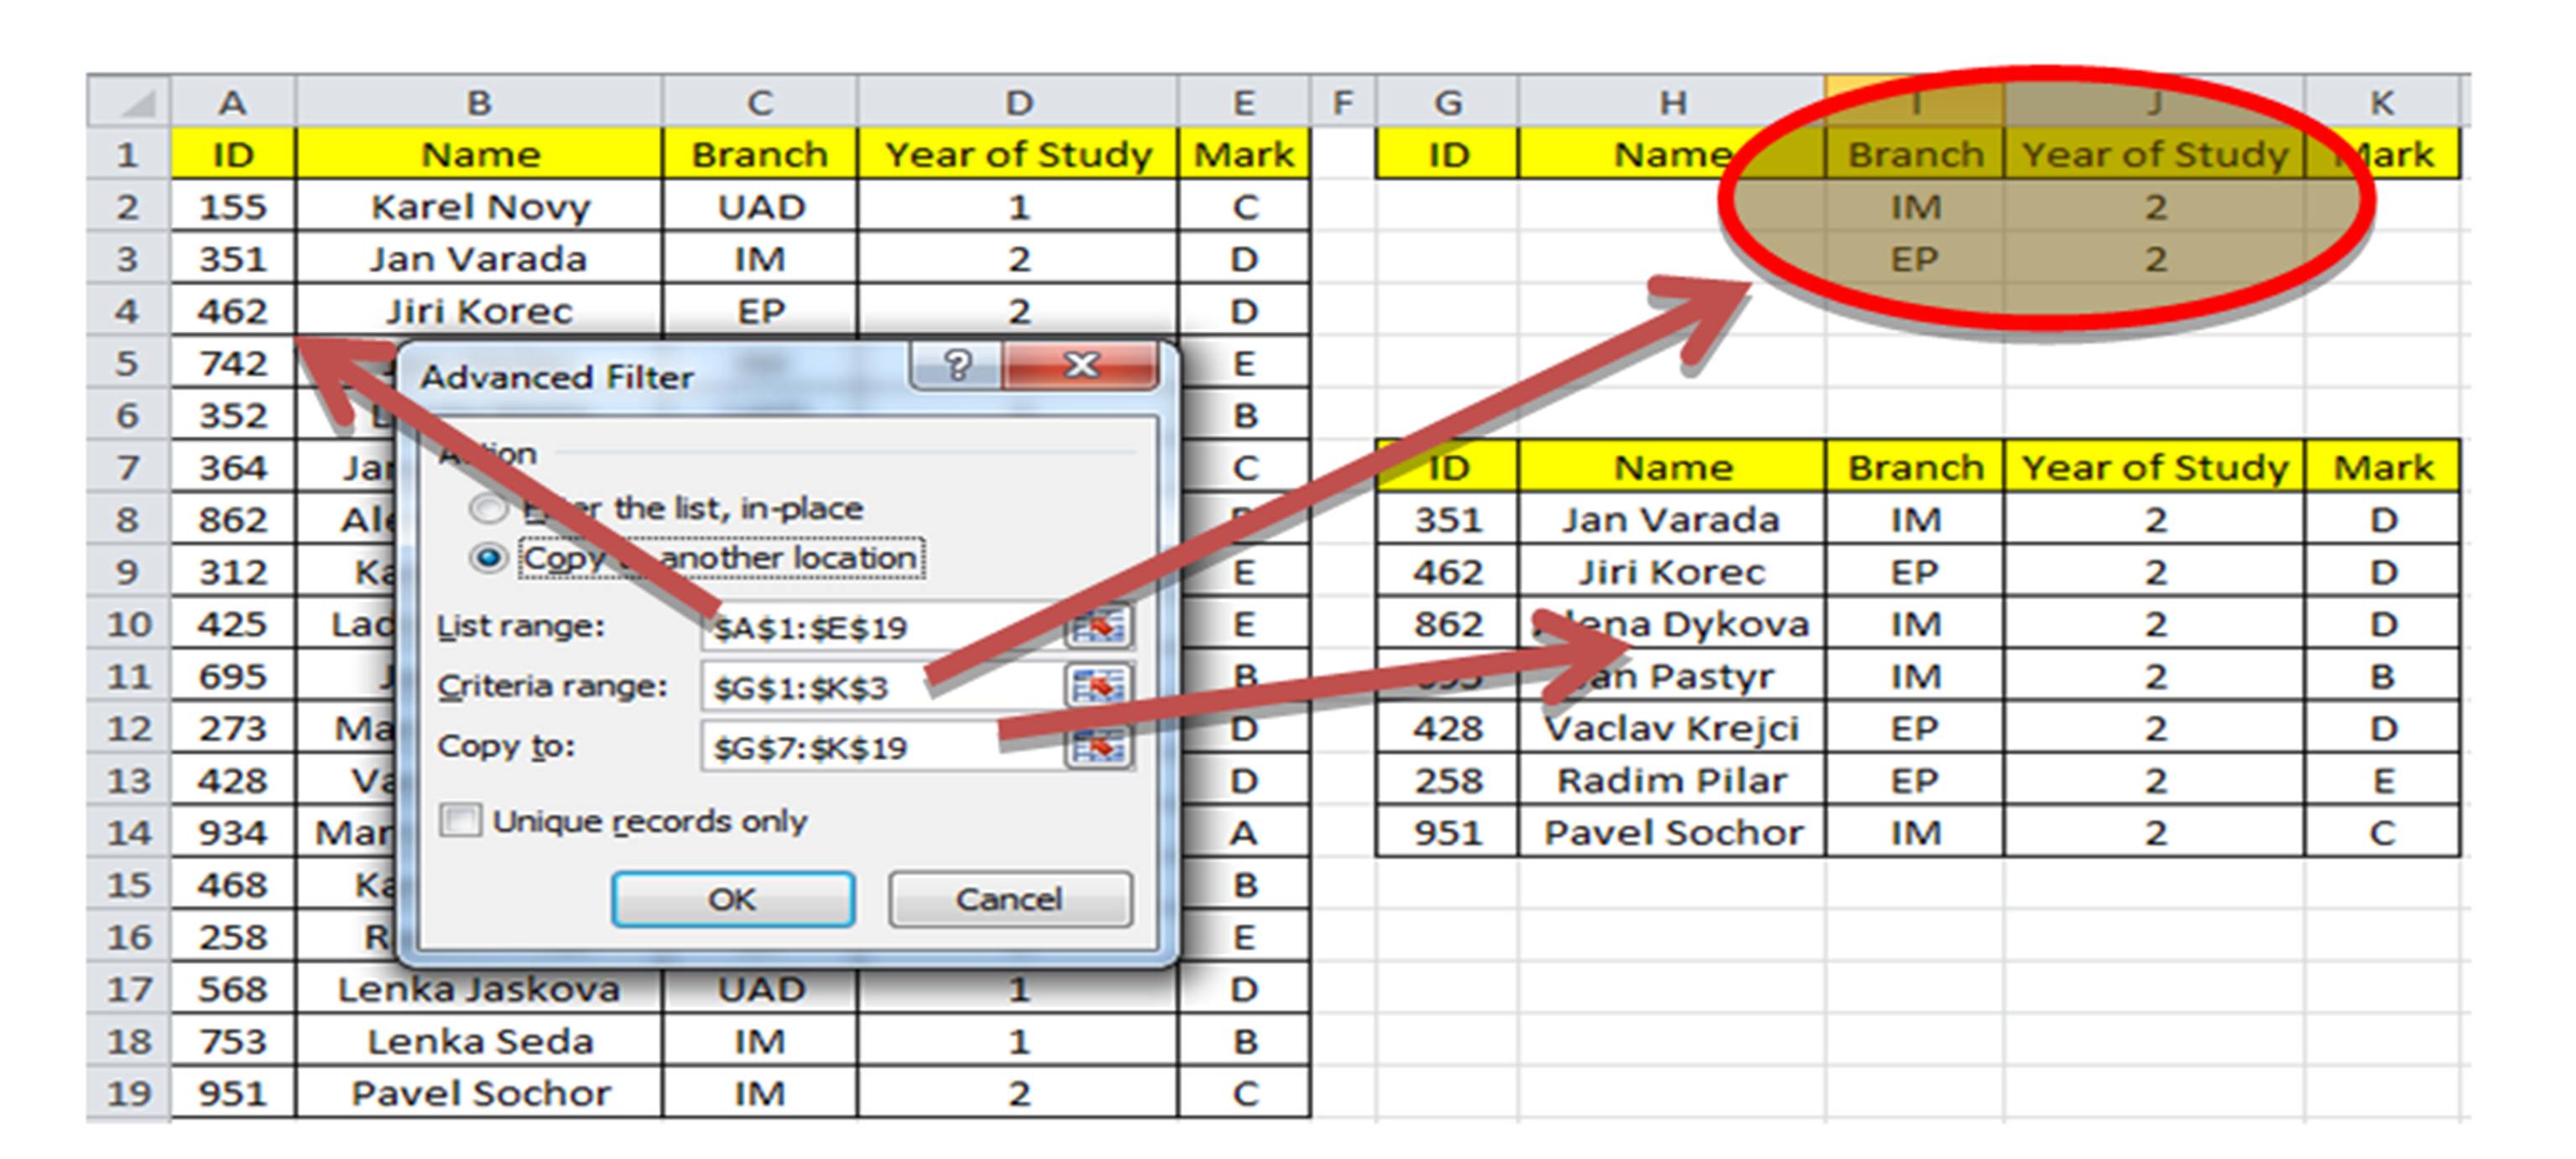
This method uses filter conditions and, unlike the the automatic filter method, does not hide lines in the output. It is based on the principle that three ranges must be defined: first, a range from which the selection is carried out, second, a range in which the filter criteria are stored, and third, a range for the output of filtered data (entries).
Source: Author
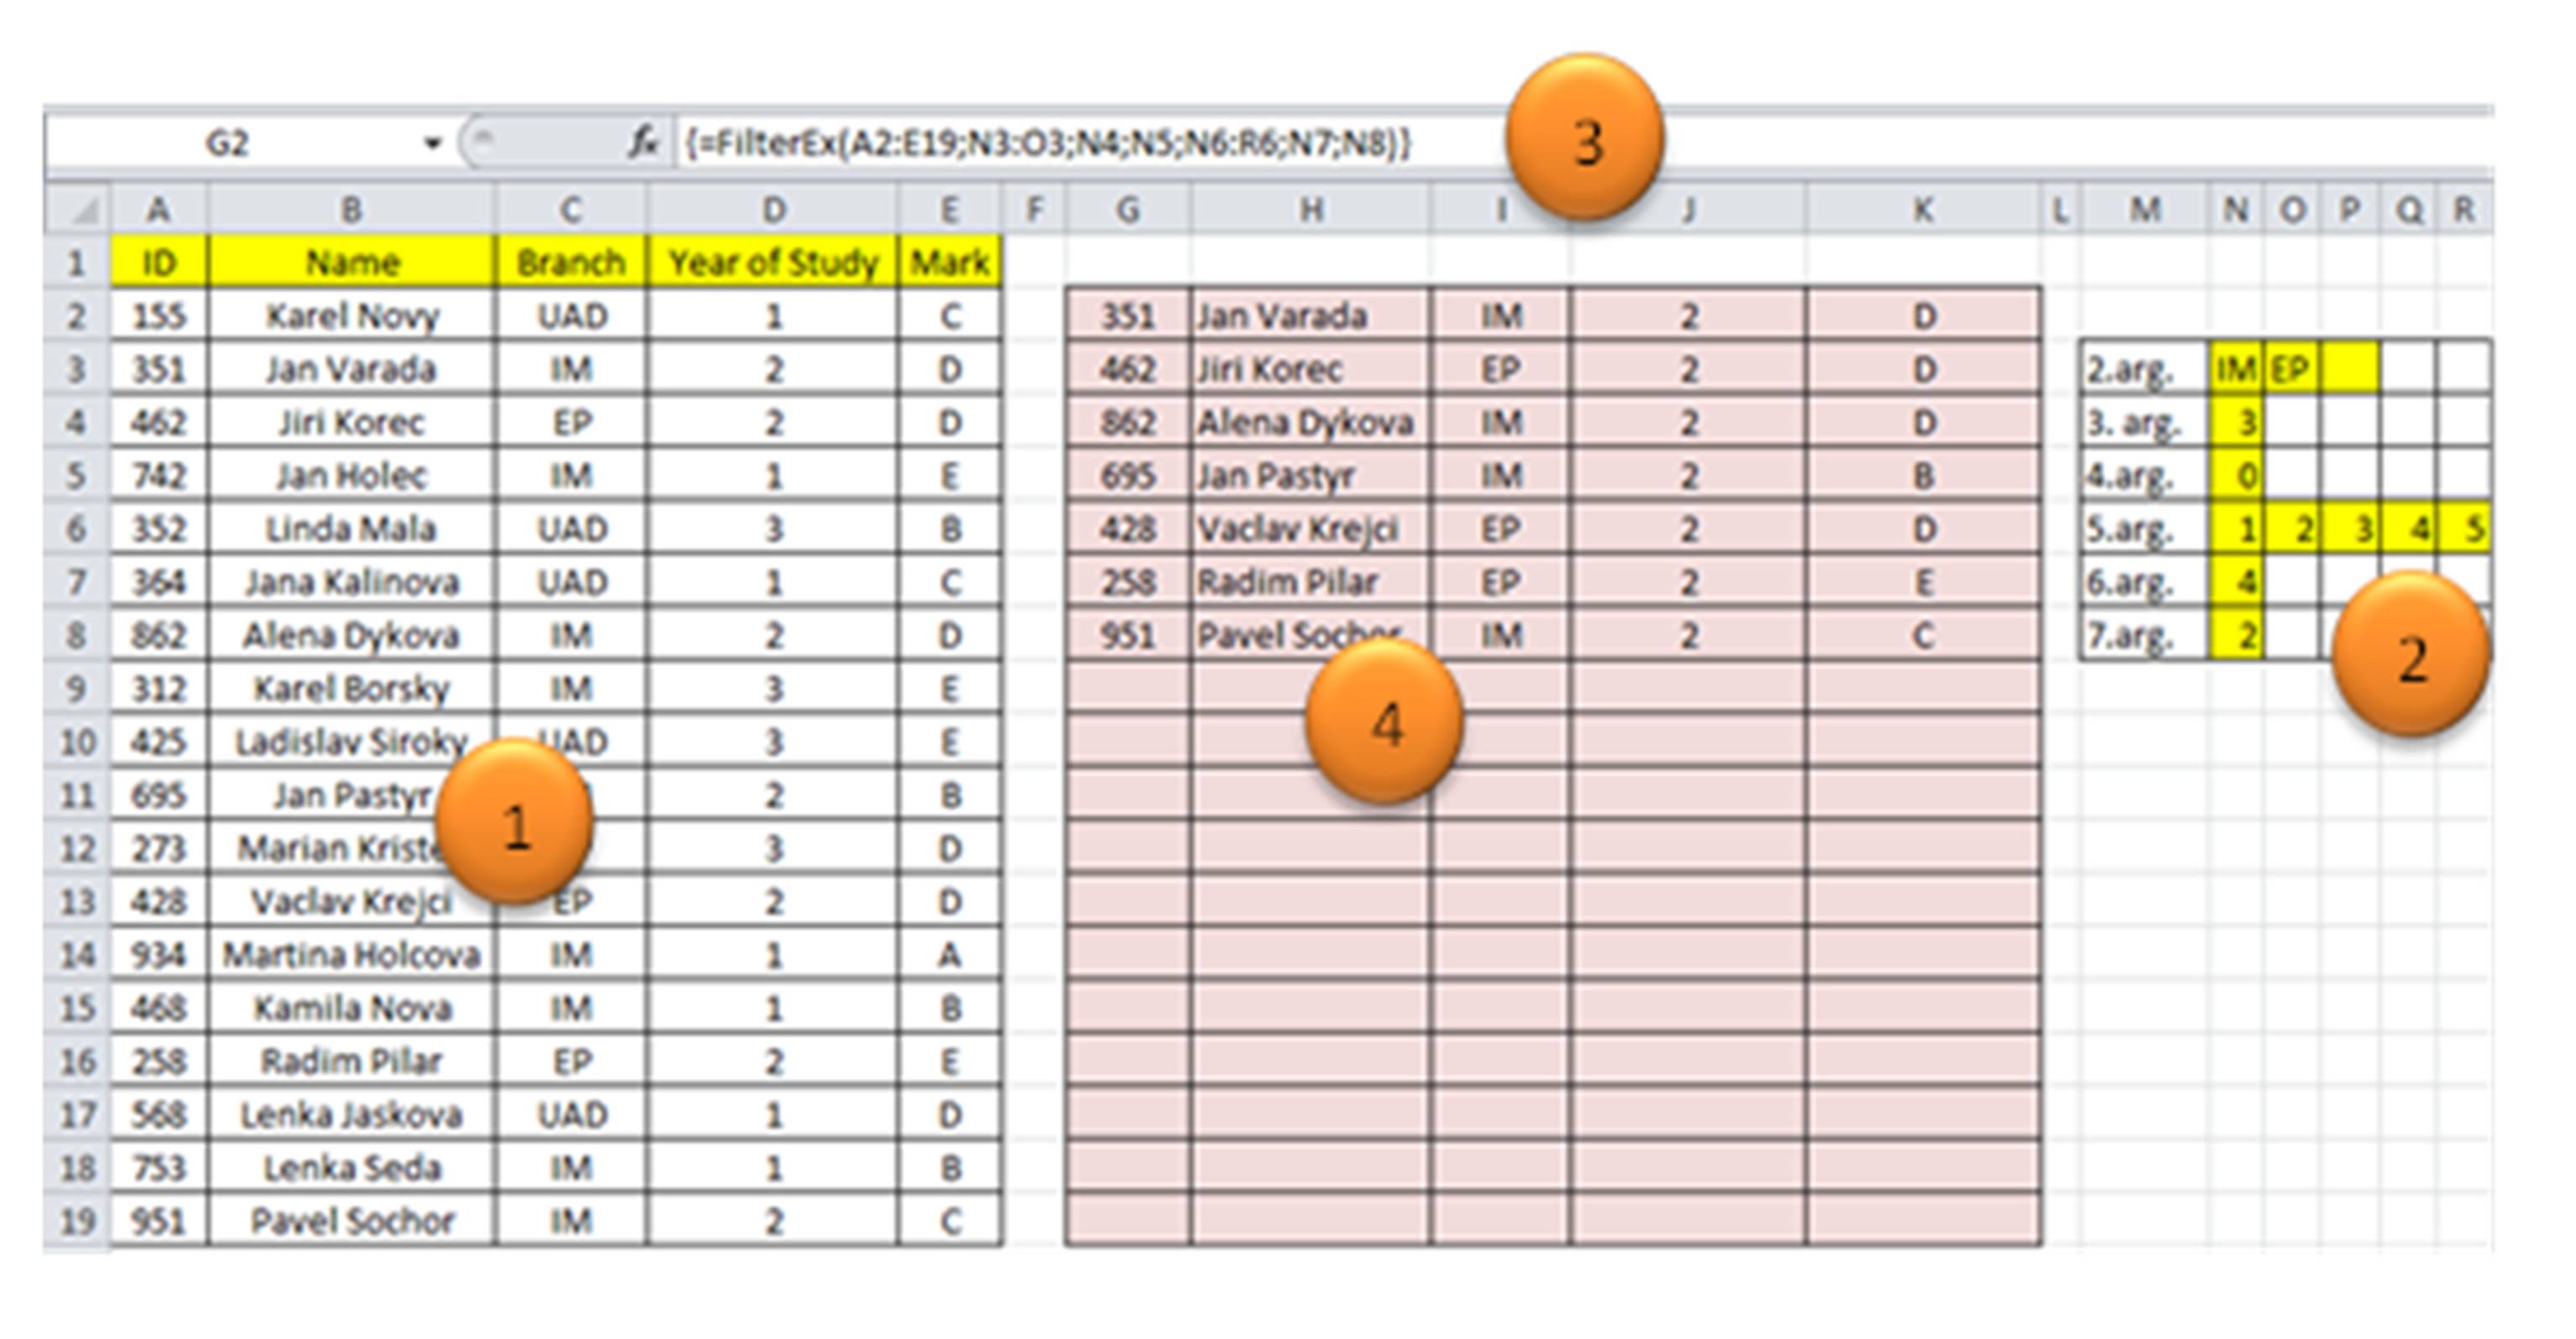
Figure 5: Advanced Filter
The output of this method is a table (see Fig. 5 — cells G7:K14) consisting of lines corresponding to the automatic filter definition as follows:
((BRANCH = „IM“) AND (YEAR = 2)) OR ((BRANCH = „EP“)) AND (YEAR = 2))
Project, desciption and solution implementation
By comparing these three methods, i.e. standard lookup functions, automatic filter and advanced filter for extracting (filtering) entries, one may conclude that the method best suited to the given problem is the advanced filter method. However, from the processing point of view, this method is not as dynamic as the method using of standard look up functions. In general, with the look up functions method, the value of the function argument or the value of the cell to which the function arguments are pointing may be changed and this is immediately recalculated based on the change of input data. The recalculation is also carried out if input data values change. The disadvantage of the Advanced Filter method consists in the fact that if the input data or criteria change the method is not automatically recalculated but the method implementation procedure must be repeated.
Therefore, an elegant and sophisticated solution is to create a function which combines selected properties of the outputs of the above-descibed filering methods, i.e. a function which would return not a single value, but a whole set of filtered data. Such a funtion output may be implemented via matrix funtions, i.e. functions whose output runs across an array of cells.
The function will be created in the VBA environment and located in an independent module as a public function. Its name will be FILTEREX and it will have a definite number of arguments. The function will be accessible to the user in the function catalogue under the user function category.
Requirements for the function:
The function must be universal from the data processing point of view, i.e. allow processing various types of data (numbers, text)
The function must return a set of outputs into several lines — matrix function
The function processes data based on the multi-criterion definition:
(X1 OR X2 OR… … Xn) AND (Y) , where X1, …, Xn is a set of criteria inter-related by logical sum, where 1 < n < 100, Y is the criterion 2 variable. The filter condition may be expressed in the programming code e. g. as follows:
IF ((X1=TRUE) OR (X2=TRUE) OR (X3=TRUE)) AND (Y=TRUE) Then…
a) If the selection criterion is a text entry, then the comparation method must be defined:
(„A“=“a“ or „A““a“).
b) The function must return output (record) in different formats (changed order of items with respect to the input table)
c) The function returns selected items from the record. If the record has 5 items, then the number of items returned must be in the interval (1 — 5).
d) The function must allow defining by its argument the selection criterion and the column whose values will be related to the preceding selection by logical product (AND).
Based on the above requirements the function arguments are as follows:
Argument 1: address of the entire table
Argument 2: address of an external area containing criteria values joined by logical sum (OR)
Argument 3: number specifying the column to be searched
Argument 4: text array comparation
Argument 5: address of area whose values specify the output position of selected columns into the output display
Argument 6: If filled in, specifies order of column in the input table related to the preceding selection by logical product (AND)
Argument 7: If the value of Argument 6 is greater than 0, then the value is the logical product (AND) criterion to the preceding selection
Table: 1 Argument Definition Table for the FilterEx Function
Source: Author
Based on requirements for a matrix function and definition tables, a matrix function has been created which returns outputs (input table entries) into a set of lines
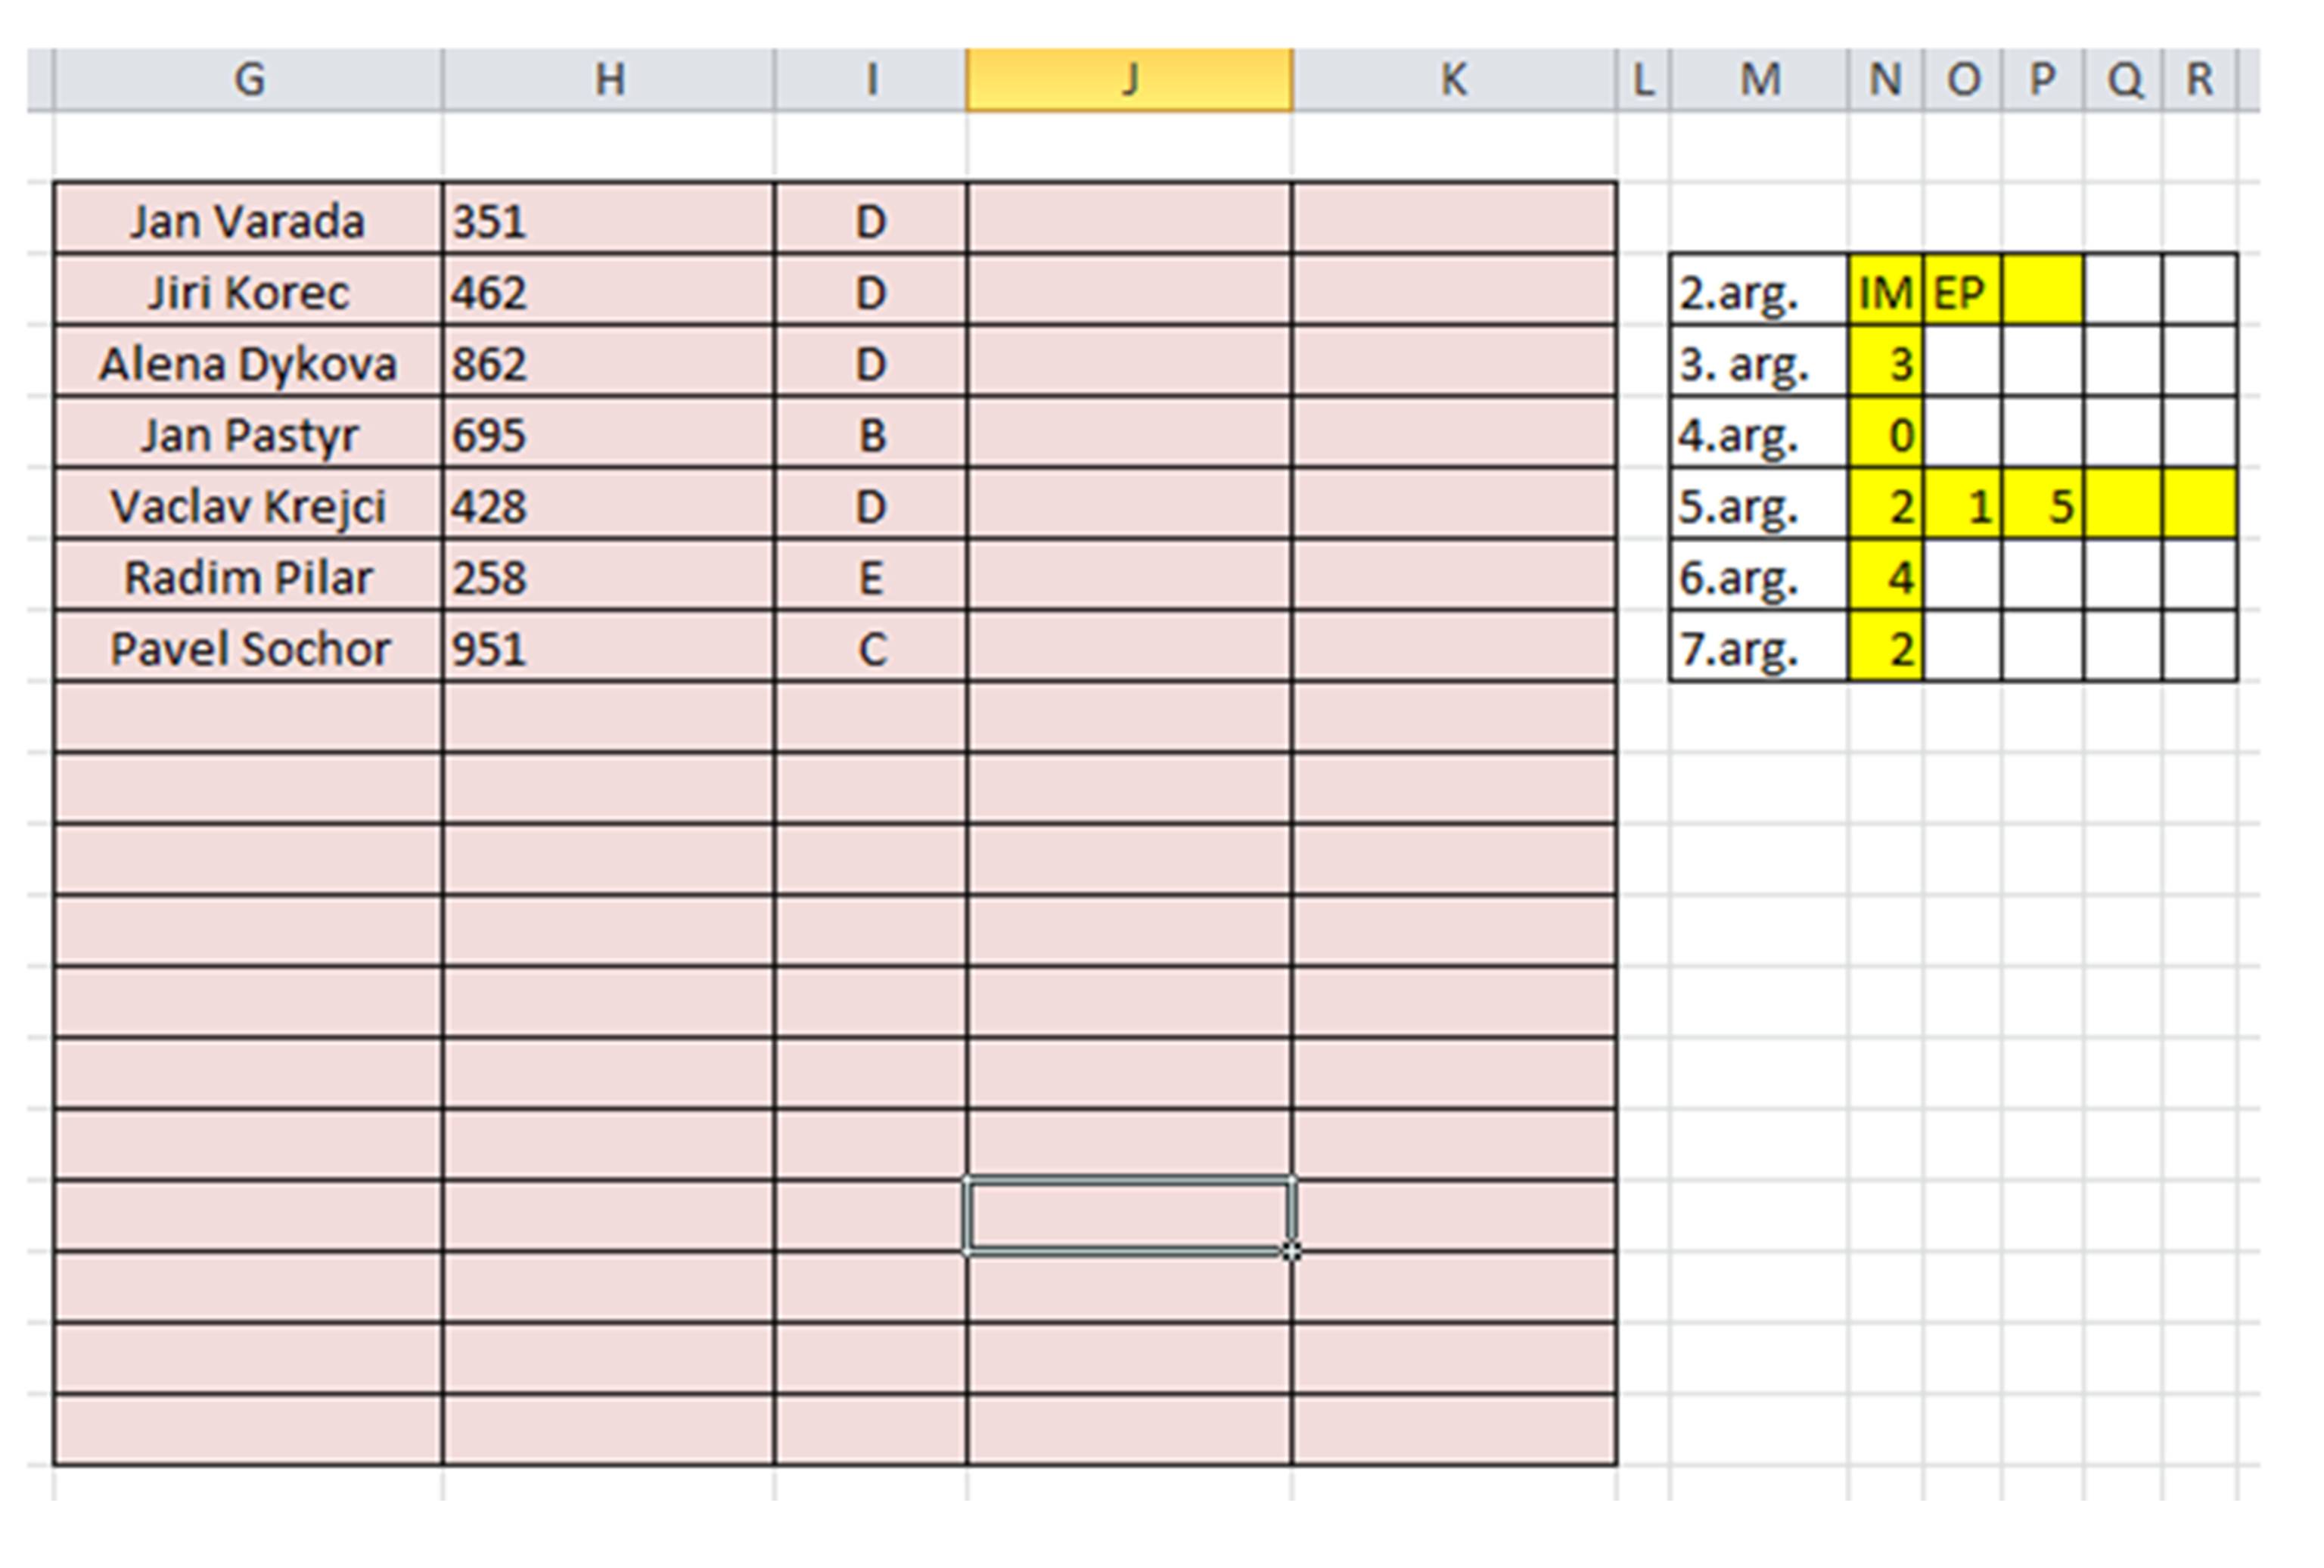
Description of Fig. 7: Area No 1 (cells A1:E19) contains database entries whose address is the value of the function´s first argument (see Area No. 3 — Formula Bar). Area No. 2 contains the values of Arguments 2 — 7, and we can see that according to the original formulation of the problem which says that we wish to filter all second year students (Argument 6 which specifies the relative position of the table column to be searched by logical product (AND), Argument 7 specifies the value searched in column 4 (Year of Study) of the branches IM and EP (Argument 2 — cells N3:O3), Argument 5 specifies not only the order of the return columns but also the columns hich are to participate in the output, in this case all 5 columns in the same order as in the input table. For instance, if we wanted the output table to contain the first name, surname, ID and grade (in this order) only then Area No. 2 and the output of the matrix function would be as follows:
Source: Author
Figure 8: The Function Output with a Changed Order of Output Columns (Argument 5)
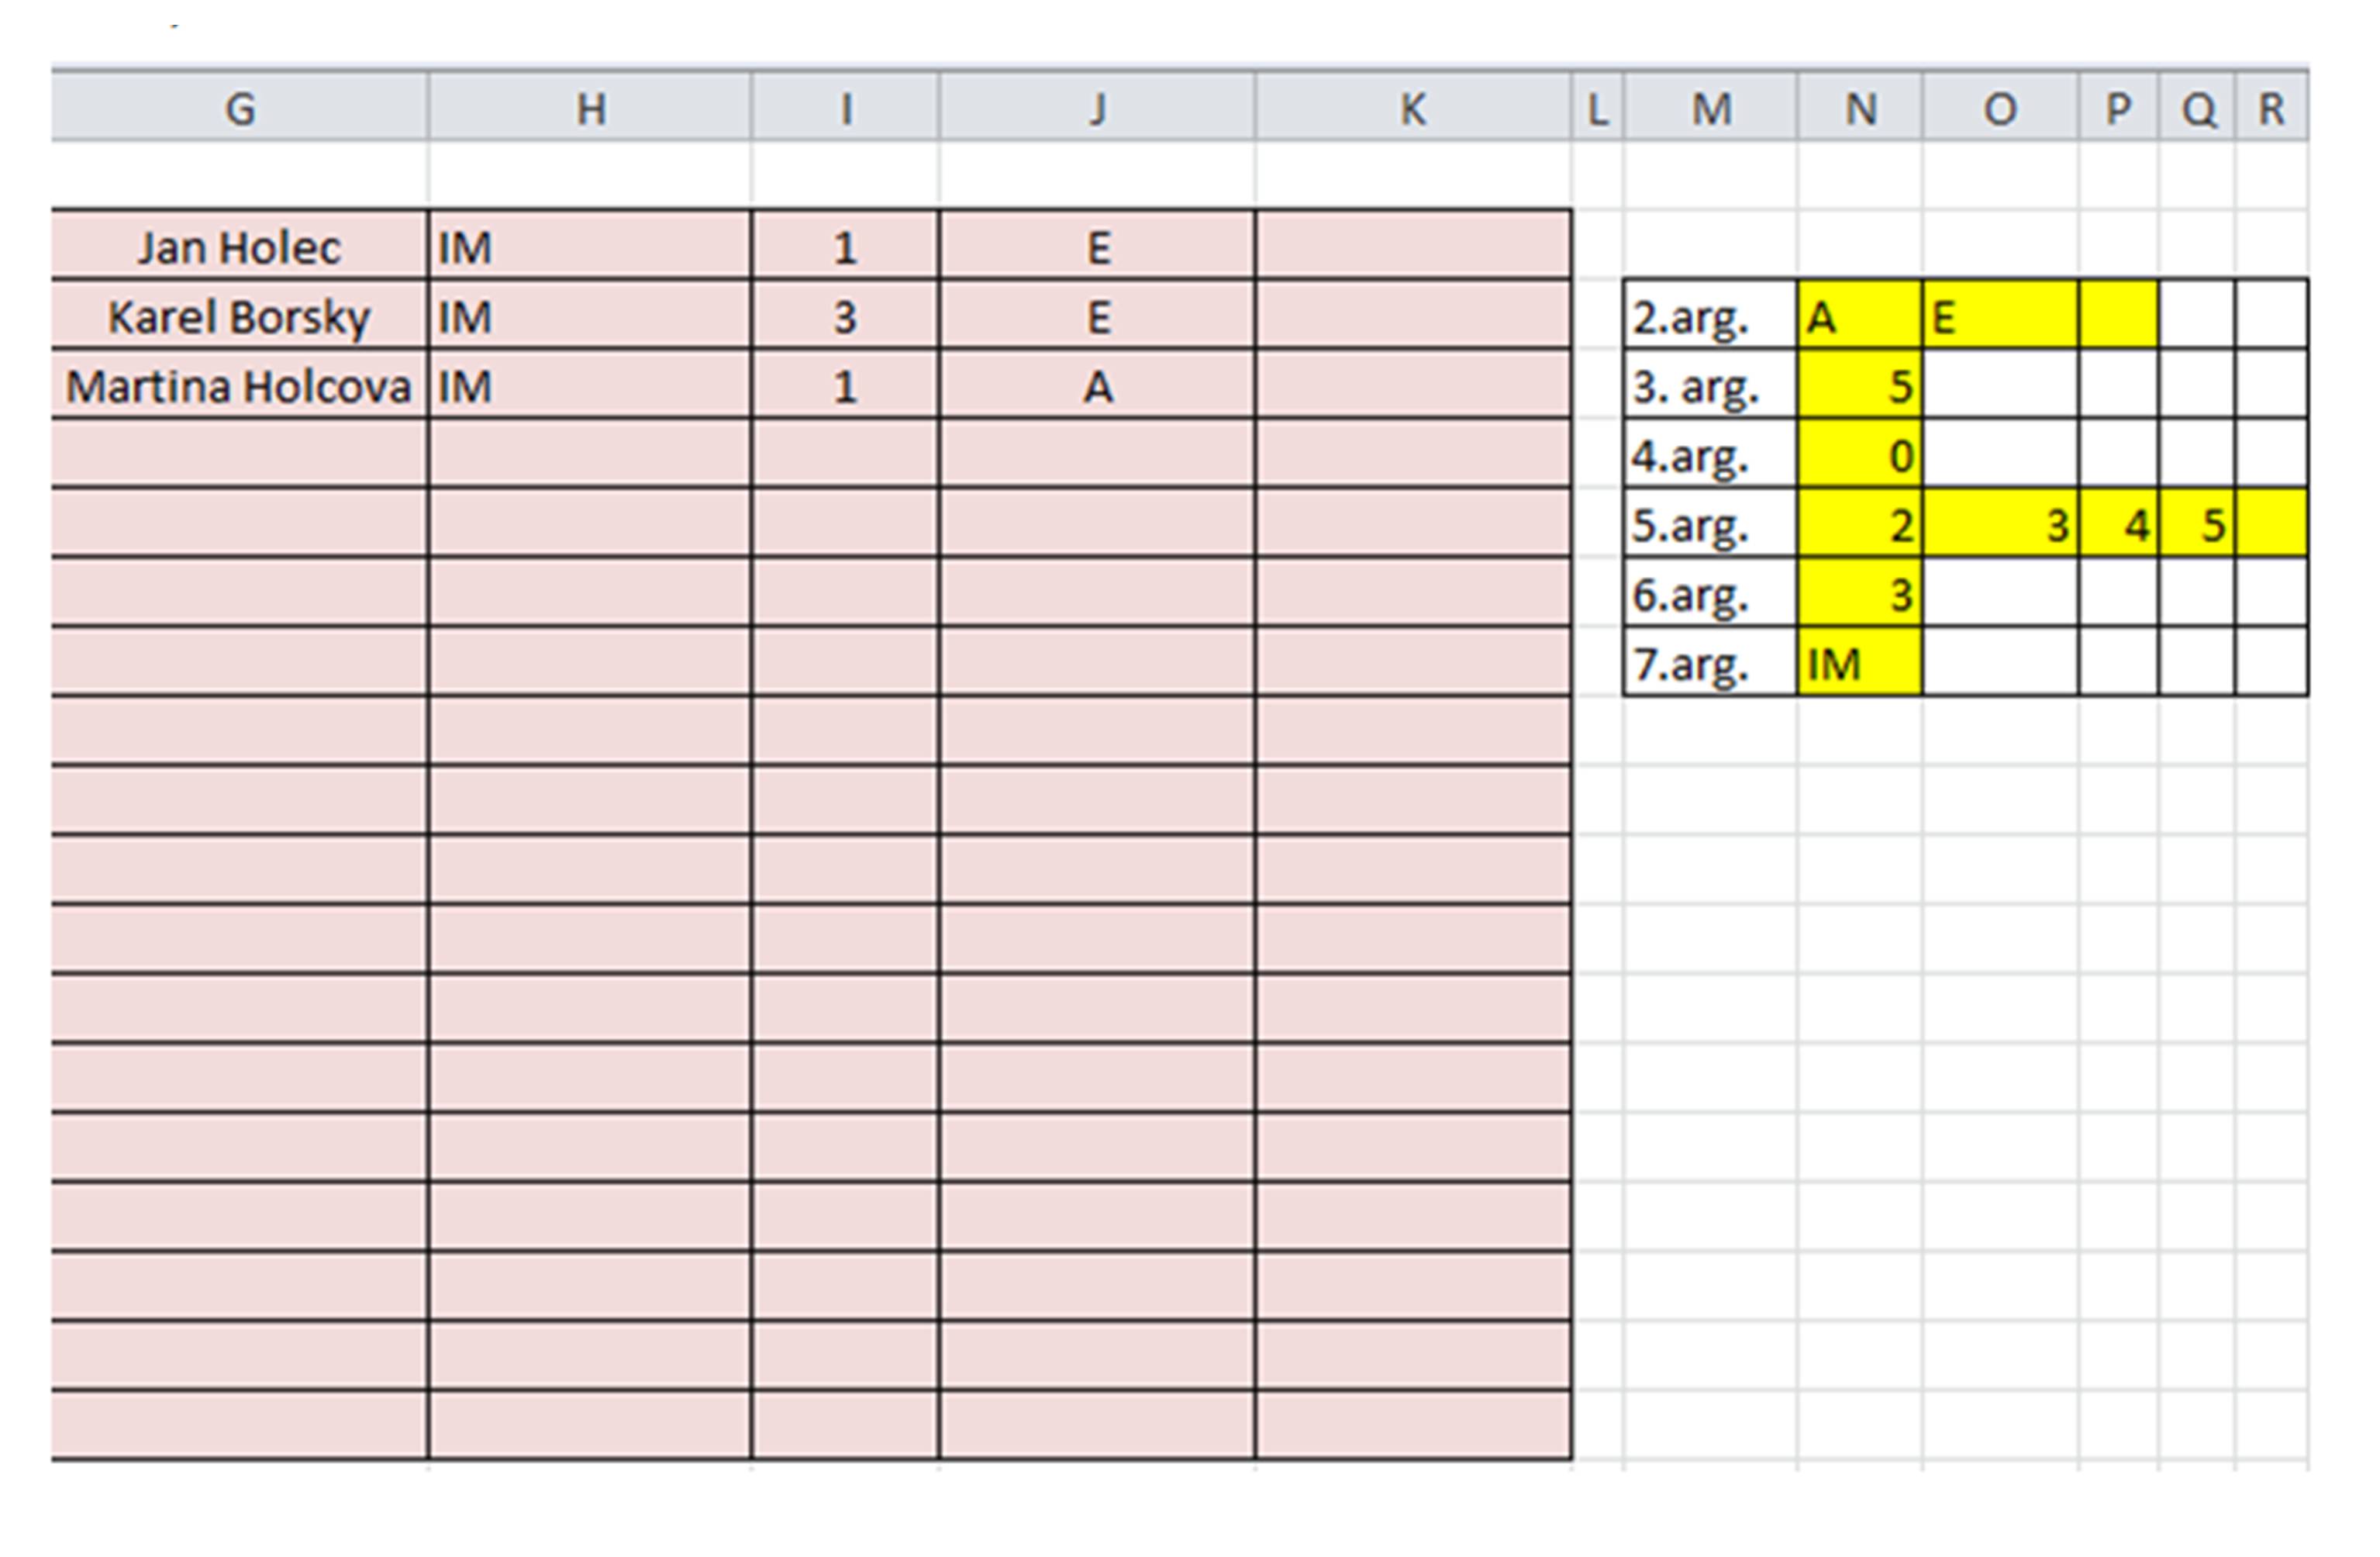
Let us change the formulation of the problem: Filter all students who have grades A or E, are on the branch IM and the order of output columns is as follows: Name, Branch, Year of Study, Grade.
Source: Author
Figure 9: The Function Output with Changed Arguments 2, 3, 5, 6 and 7
Since our function is a matrix function, and its output is defined by a range of values (the number of lines will probably be less or equal to that of the input database table and the number of columns will be in the range 1 — n, where n is the number of columns of the original table), we must use a combination of keys CTRL+ SHIFT+ ENTER instead of just the ENTER key to enter a change of the function arguments. Advantages and disadvantages of FILTEREX function
The disadvantages of upper mentioned internal functions or methods, which are used for data filtration were mentioned already upper, now I would like to evaluate shortly the advantages and disadvantages of suggested function by me.
The function FILTEREX is in contrast to internal functions and methods (VLOOKUP, LOOKUP, HLOOKUP, Automatic Filter Method and Advanced Filter Method) dynamic and it is possible to state, that by its functionality, it reminds outputs of common database aplications. In contrast to internal functions VLOOKUP, LOOKUP, HLOOKUP provides group of outputs thanks to using the matrix function. In addition, it enables to use the combination of logical product and sum over some atributes in input table.
Perhaps the highest similarity of outputs has the function FILTEREX with Automatic Filter Method however at this internal method comes to hiding of whole lines of the table, if the values in some columns do not meet the filter criteria. It follows that, even only temporarily, the table is adjusted to the whole input table of values. XXX
From the sight of assigning of filtrated criteria, the Advanced Filter Method is the most similar to matrix function FILTEREX, at which it is possible to manualy assign the conditions of composed combination of logical product and sum. The disadvantage of this method against the designed function is however the low dynamism of using, because by the change of filter criteria does not come to automatic recalculation of outputs, but the whole process Advanced Filter Method must be repeated again.
The only disadvantage, which does not relate with funcionalism, is the fact that the function FILTEREX contains relatively many arguments, that is some tax for the flexibilty of this function. The user, unlike some other, easier functions, that their using is more intuitive, must thoroughly introduce with the philosophy of this function and understand the composion and princple of input argumetns. Literature Review
Quality engineers who use Excel have the option of creating macros using Microsoft Visual Basic for Applications (VBA), a Basic language that is built into Excel. It is believed that engineering graduates would be more suitably equipped to contribute in an industrial setting, if they were taught how to effectively use Microsoft Excel and, in particular, Visual Basic for Application (VBA) programming, rather than how to write a computer program in a language they may never use again (Chambers at al, 2006). In addition to providing a good introductory vehicle for programming principles and platform for applications within the enterprise, VBA can be a suitable framework for development (Miller at al, 2004). It is also found that Excel is a favorable environment for them to learn programming skills since they are already familiar with Excel Neuwirth & Novotná at al (2011). Excel is familiar to the large majority of scientists and students and by using VBA not necessarily becomes familiar with a new software environment (Diggle at al, 2003). The advantage of using Excel as a development environment is that it provides capabilities that allow for the pre-analysis manipulation of data and the visualization of test output and results (Berardi at al, 2002). Effectiveness is generally defined as the capability in achieving an established goal (Berk at al, 2005). Most engineers entering the workplace spend at least half of their working-hours at their computers (Coronell at al, 2005) and in this time mostly using user-friendly commercial software. So, one of the main goals is basically to improve students’ skills in using Excel so that they can apply it to future projects in their majors (e.g., accounting, finance, economics …) (Berk at al, 2005). It propagates the problem solving with “tools approach” which teaches students to think of various computer software packages, computer programming or any other methods to solve a problem, rather than the “computer science approach” which mainly focuses on programming language syntax without connection to relevant engineering problems (Clough at al, 2002). VBA was added to Microsoft Office to strengthen its future developing function. It was developed based on the very popular programming language Visual Basic and took after its language structure. Moreover, VBA can automate the frequently used program and create user-defined program (Li et al, 2007); (Ma et al, 2003). Microsoft Excel and the attached program Visual Basic for Application (VBA) is an effective tool to solve statistical and analytics problems, and Excel shows its great advantage in further analysis on the results in graphics (Hu at al, 2006). Visual Basic for Applications (or VBA) is an incredibly available programming language (Schulte and Knobelsdorf at al, 2007) (e.g., it is embedded in every instance of Microsoft Word, Excel, PowerPoint, etc.), but this availability and easy of use cause it to not be taken seriously by some academics and many purists (Streib and Chaffee at al, 2004). As with most developer tools, the problem is not primarily with the language but the discipline and standards with which it is applied (Grand and Merrill at al, 2005).
Conclusion
This contribution shows how to create a user function if the existing internal functions or methods which solve the above-formulated problem to some extent, do not meet our needs. However, the article describes a mere fraction of the possibilities offered by the VBA as an application develompment tool. The objective of this article has been achieved, it has been shown how programming can be used to create a user function which, as opposed to the internal functions, produces outputs similar to those commonly met with in database tools. The contribution of this article, in my opinion, consists in the fact that it shows how easy it is to create user-defined functions which are useful in day-to-day practice, in particular in bulk data processing. Since I have been involved in installing such functions in companies, I have the feed back from the people who use them. Apart from the spectacular character of such functions, their use brings higher data processing effectiveness to the companies using them.
Finally, let me make a technical remark. The set of programmed functions located in the module may be stored as a so called ADD-In (.XLM file), an independent file which may be imported through the Developer card and ADD-Ins submenu as a library of support functions. Since this is an independent file containing subprograms (functions) only and no data, it may be distributed normally. Acknowledgement
This paper was supported by grant No: FP-S-13-2148 „The Application of ICT and Mathematical Methods in Business Management“ of the Internal Grant Agency at the Brno University of Technology. References
2. Berk, R A. (2005) ‘Survey of 12 Strategies to Measure Teaching Effectiveness,’ International Journal of Teaching and Learning in Higher Education, 17 (1), 48-62.
3. Braden, M. and Schwimmer, M. (2009) Excel 2007 VBA. Velká kniha řešení, Brno ISBN 978-80-251-2698-1.
4. Clough, D E. (2002) ‘ChE’s teaching introductory computing to ChE students–a modern computing course with emphasis on problem solving and programming,’ Proceedings of the 2002 American Society for Engineering Education Annual Conference & Exposition.
5. Coronell, D G. (2005) ‘Computer science or spreadsheet engineering? ,’ An Excel/VBA-based programming and problem solving course. Chem. Eng. Ed., 39, 142—145.
6. ÄŒihař, J. (2011) 1001 tipů a triků pro Microsoft Excel 2007/2010, Brno ISBN: 978-80-251-2587-8.
7. Diggle, P J. (2003) ‘ Statistical Analysis of Spatial Point Patterns,’ 2nd edn. Arnold, London, UK.
8. Grand, M. and Merrill, B. Visual Basic Design Patterns, Indianapolis, IN: Wiley Publishing, Inc. 2005.
9. Forstová, L. (2010) ‘VBA Excel v příkladech’, Computer Media s.r.o., ISBN: 978-80-7402-042-1
10. Hu, Y. (2006) ‘Application of Excel in Hydrologic frequency analysis,’ Jilin Water Resources, 1-2
11. Chambers, T L. (2006). ’Teaching engineering analysis using VBA for Excel.,’ Proceedings of the 2006 ASEE Gulf-Southest Annual Conference.
12. Král, M. (2010) Excel VBA. Výukový kurz. Brno,. ISBN 978-80-251-2358-4.
13. Král, M. (2010) Excel 2010 — snadno a rychle, Praha, ISBN 80-2473-495-8.
14. Laurenčík, M. (2011) Programování v Excelu 2007 a 2010, Praha, ISBN 978-80-247-3448-4.
15. LI, Z., YI, Q., LI, Y. and ZHANG, D. (2007) ‘Application of Excel in Hydrologic Frequency Computation,’ Journal of Water Resources and Architectural Engineering, 95-97.
16. MA, X., WANG, F. and MA, Q. (2006) ‘Application of VBA in the Optimal Selection of Hydrologic Statistic Parameters,’ Journal of Zhengzhou University of Technology, 67-69.
17. Miller, K W. (2004) ‘Test driven development on the cheap: text files and explicit scaffolding,’ J. Comput. Small Coll, 20, 181-189.
18. Neuwirth, B. and Novotná, V. (2011) ‘ Vztah studentů FP VUT k matematice a výpočetní technice,’ Aplimat 2011, FME STU, Bratislava, 1393-1398.